. 2020 Nov 18;11(1):5890.
doi: 10.1038/s41467-020-19747-0.

High-dimensional super-resolution imaging reveals heterogeneity and dynamics of subcellular lipid membranes

Affiliations

High-dimensional super-resolution imaging reveals heterogeneity and dynamics of subcellular lipid membranes

Karl Zhanghao et al. Nat Commun. .

Abstract

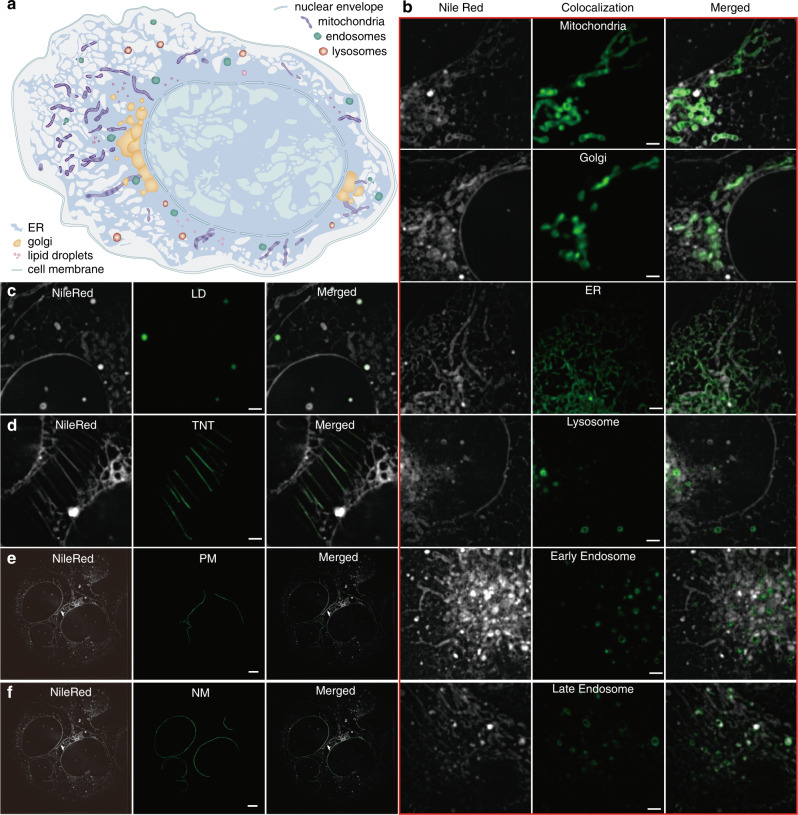
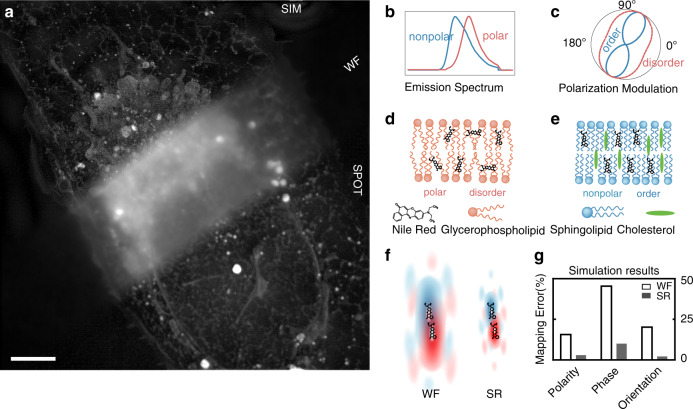
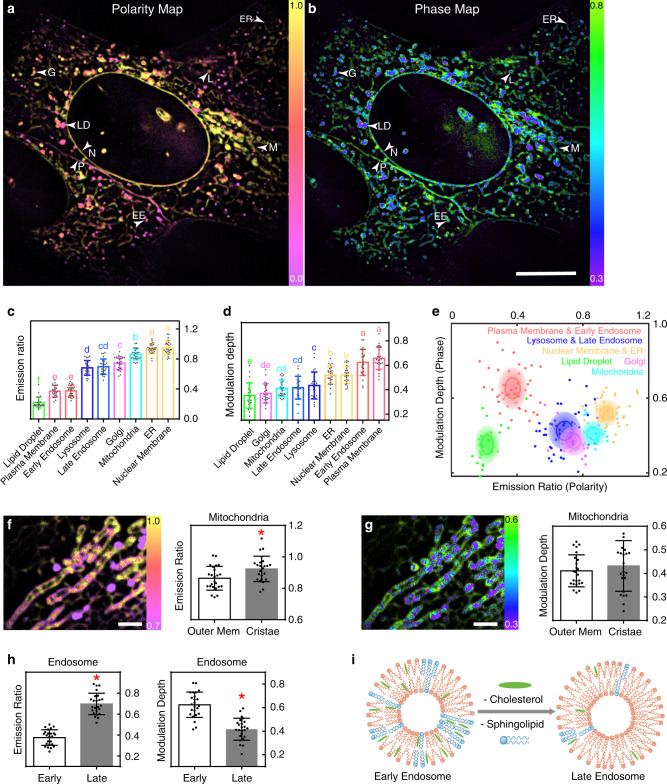
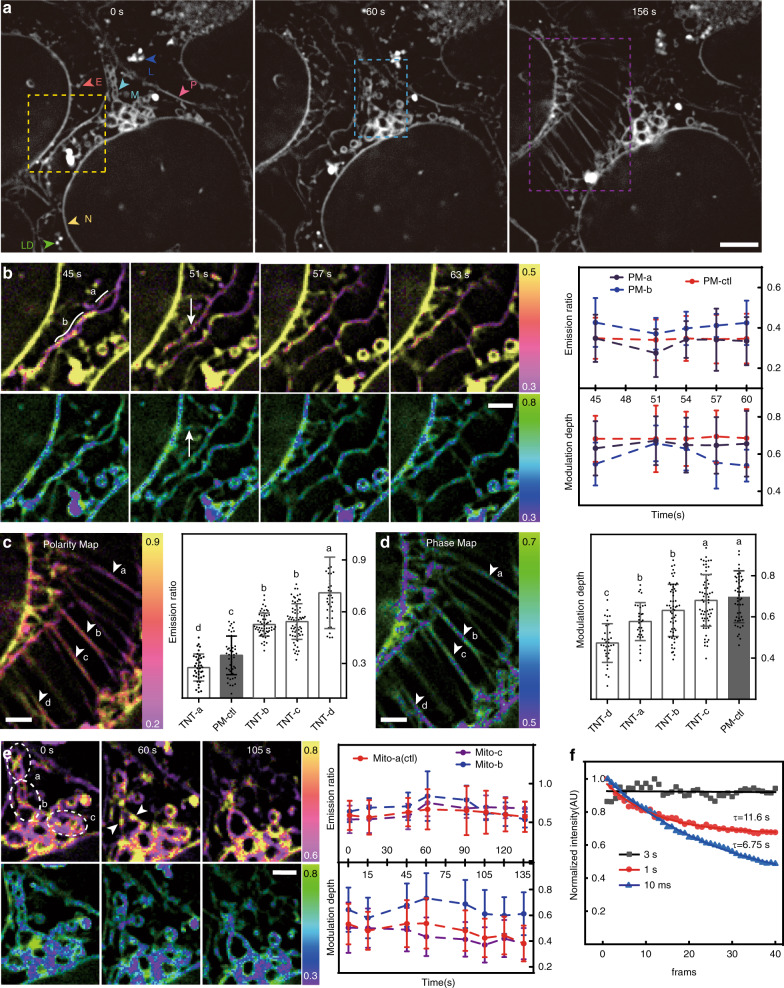
Lipid membranes are found in most intracellular organelles, and their heterogeneities play an essential role in regulating the organelles' biochemical functionalities. Here we report a Spectrum and Polarization Optical Tomography (SPOT) technique to study the subcellular lipidomics in live cells. Simply using one dye that universally stains the lipid membranes, SPOT can simultaneously resolve the membrane morphology, polarity, and phase from the three optical-dimensions of intensity, spectrum, and polarization, respectively. These high-throughput optical properties reveal lipid heterogeneities of ten subcellular compartments, at different developmental stages, and even within the same organelle. Furthermore, we obtain real-time monitoring of the multi-organelle interactive activities of cell division and successfully reveal their sophisticated lipid dynamics during the plasma membrane separation, tunneling nanotubules formation, and mitochondrial cristae dissociation. This work suggests research frontiers in correlating single-cell super-resolution lipidomics with multiplexed imaging of organelle interactome.


Conflict of interest statement

The authors declare no competing interests.

Figures

Fig. 1
Fig. 1. Colocalization of Nile Red-stained compartments in U2-OS cells with spectrum and polarization optical tomography (SPOT) intensity images.
a The cartoon diagram of various compartments in the cell. b GFP colocalization of mitochondria, Golgi apparatus, ER, lysosome, early endosome, and late endosome. The images in each left column are fluorescent images of Nile Red in the yellow channel (excitation: 561 nm, emission: 578–614 nm). The images in the middle are the fluorescent images of GFP in the green channel (excitation: 488 nm, emission: 505–545 nm). c Colocalization of Nile Red signals in both green and yellow emission channels, when excited by the 488-nm laser, identifies lipid droplets, as Nile Red emits both green and yellow fluorescence only in lipid droplets. df The tunneling nanotube (TNT), plasma membrane (PM), and nuclear membrane (NM) are identified from their morphologies, which are manually marked in the middle column. All the experimental results in bf were repeated at least three times with independently prepared samples. Scale bar: (bd) 2 μm; (ef) 5 μm.
Fig. 2
Fig. 2. Principle of the high-dimensional super-resolution imaging of subcellular lipid membranes.
a The max intensity projection image (40 × 40 × 2.75 μm3) shows a U2-OS cell stained by Nile Red that labels lipid membranes of various compartments. In contrast to the blurry wide field (WF) image, 3D structured illumination microscopy (SIM), and SPOT clearly resolve the subcellular structures. Similar results were repeated five times independently. b The schematic emission spectrum of Nile Red is shifted by the polarity of its environment, i.e., a blue-shift in nonpolar lipids and a red-shift in polar lipids. c When Nile Red inserts into the lipid membrane, the wobbling behavior of the fluorescent dipole reflects the lipid phase, which can be quantified by polarization modulation depth. In the ordered phase, the dipole orientation is more uniform, leading to a higher modulation depth (the schematic curve in blue); while in the disordered phase, the dipole orientation is more anomalous, resulting in a smaller modulation depth (the schematic curve in red). d, e The enormous types of lipids can be categorized into glycerophospholipid, sphingolipid, and cholesterol. The polarity descends from glycerophospholipid, sphingolipid, to cholesterol. Glycerophospholipid alone tends to form an disordered phase of membranes, while cholesterol and sphingolipid assist the formation of an ordered phase. f, g Improved spatial resolution can attenuate influencing signals from other molecules when measuring the target molecule. By simulating two molecules with different emission spectrum and dipole behavior, the errors can be reduced from 15.1% to 2.2% in polarity, from 45.5% to 7.9% in phase, and from 19.1% to 1.6% in dipole orientation with doubled lateral and axial resolution. The influence of noise on measurement accuracies is illustrated with simulations in Supplementary Fig. 8. In Nile Red-stained U2-OS cells, the abundant out-of-focus signal lowers the measuring accuracy, where SPOT is demonstrated with superior performance to WF and SIM with comprehensive experimental results (Supplementary Figs. 3 and 4). Scale bar: 5 μm.
Fig. 3
Fig. 3. Heterogeneity analysis of subcellular lipid membranes.
a, b The polarity map and the phase map obtained by SPOT show noticeable contrasts between the lipid membranes of different compartments. The lipid polarity is quantified by the emission ratio and warm-color coded, while the lipid phase is resolved by the polarization modulation depth and cool-color coded. Similar results were repeated three times independently. ce The statistics (n = 24 for each kind of organelle) measured on each colocalized compartment further quantify their lipid heterogeneity. Duncan’s multiple range test is used to analyze the significance of differences between multiple groups where the threshold of p is set to 0.05. The histogram of the emission ratio (c) shows the heterogeneous lipid polarity, and the histogram of the modulation depth (d) shows the heterogeneous lipid phase (n = 24 for each kind of organelle), where characters on the bars indicate significant differences. The polarity-phase plot (e) further categorizes the six groups of the compartments according to their similarities and differences, in which the solid line and the transparent ellipse show the standard deviation σ and 2σ of the measurement. f, g The polarity map and the phase map of mitochondria reveal the heterogeneity between the outer membrane and the cristae. The statistics (n = 24 mitochondria) also show a significantly higher lipid polarity in the outer mitochondria membrane but no significant difference in the lipid phase. Two-sided t-test is applied and p = 0.0118, 0.4265 for f, g respectively. h, i The statistics (n = 24 early endosomes and late endosomes) measured with colocalization show the increase in polarity and the decrease in phase from early endosomes to late endosomes. Two-sided t-test is applied and p < 0.0001 in both polarity and phase. The red ‘asterisk’ in f and h indicate that there exist significant differences. All the data in the bar charts are presented as mean values ± SD. The arrows in a, b indicate the possible compartments recognized by their morphology and lipid properties. The statistical results are based on ≥3 independent experiments. Source data are provided as a Source Data file. EE early endosome, G Golgi apparatus, L lysosome or late endosome, LD lipid droplet, M mitochondria, N nuclear membrane, P plasma membrane. Scale bar: a, b 10 μm; f, g 2 μm.
Fig. 4
Fig. 4. Long-term monitoring of the lipid dynamics of multiple compartments.
a The time-lapse images recorded the late-stage division of two U2-OS cells at 3 s acquisition interval for 10 mins. The bleaching analysis in f shows the non-bleaching imaging power at this interval. Similar results were repeated in two independent experiments. b The enlarged images of the yellow box show the lipid polarity and phase during the division of the plasma membrane. The emission ratio drops during the division and recovers after the separation of two plasma membranes, while the modulation depth first rises and then drops. During the same period, the control plasma membrane that is not dividing keeps constant in both polarity and phase (n = 22, 26, 27 measurement pixels for PM-a, PM-b, PM-ctl respectively). c, d The enlarged images of the purple box show the formation of TNTs after the separation of plasma membranes. The measurements reveal a large variation in the lipid polarity and phase among these TNTs. The histogram plots the pixel values on each TNT, and the characters on the bars indicate significant differences of each group (n = 39, 56, 67, 37, 47 measurement pixels for TNT-a, TNT-b, TNT-c, TNT-d, PM-ctl respectively). e The enlarged images of the blue box show the cristae dissociation of mitochondria during the process. The curves of Mito-b and Mito-c show an increase in the outer membrane in the emission ratio, which drops back afterward. In contrast, the lipid polarity of Mito-1 without cristae dissociation is more constant (n = 95, 107, 88 measurement pixels for Mito-a, Mito-b, Mito-c respectively at 0 s). Data in all the line and bar charts in be are presented as mean values ± SD. f The curves show the average fluorescence signal imaged with different acquisition interval and are fitted with an exponential function to calculate the halftime (n = 3 independent experiments). The exposure time of each image is 40 ms, and the total acquisition time of a SPOT dataset (six raw images) is 240 ms. Similar results are observed in ≥2 experiments. Source data are provided as a Source Data file. Scale bar: a 5 μm; bg 2 μm.

References

    1. van Meer G, Voelker DR, Feigenson GW. Membrane lipids: where they are and how they behave. Nat. Rev. Mol. Cell Biol. 2008;9:112–124. - PMC - PubMed
    1. Harayama T, Riezman H. Understanding the diversity of membrane lipid composition. Nat. Rev. Mol. Cell Biol. 2018;19:281–296. - PubMed
    1. Casares D, Escriba PV, Rossello CA. Membrane lipid composition: effect on membrane and organelle structure, function and compartmentalization and therapeutic avenues. Int. J. Mol. Sci. 2019;20:2167. - PMC - PubMed
    1. Atilla-Gokcumen GE, et al. Dividing cells regulate their lipid composition and localization. Cell. 2014;156:428–439. - PMC - PubMed
    1. Greenspan P, Mayer EP, Fowler SD. Nile red: a selective fluorescent stain for intracellular lipid droplets. J. Cell Biol. 1985;100:965–973. - PMC - PubMed

Publication types

Substances