. 2020 Nov 18;11(1):5886.
doi: 10.1038/s41467-020-19701-0.

Disease-associated gut microbiome and metabolome changes in patients with chronic obstructive pulmonary disease

Affiliations

Disease-associated gut microbiome and metabolome changes in patients with chronic obstructive pulmonary disease

Kate L Bowerman et al. Nat Commun. .

Abstract

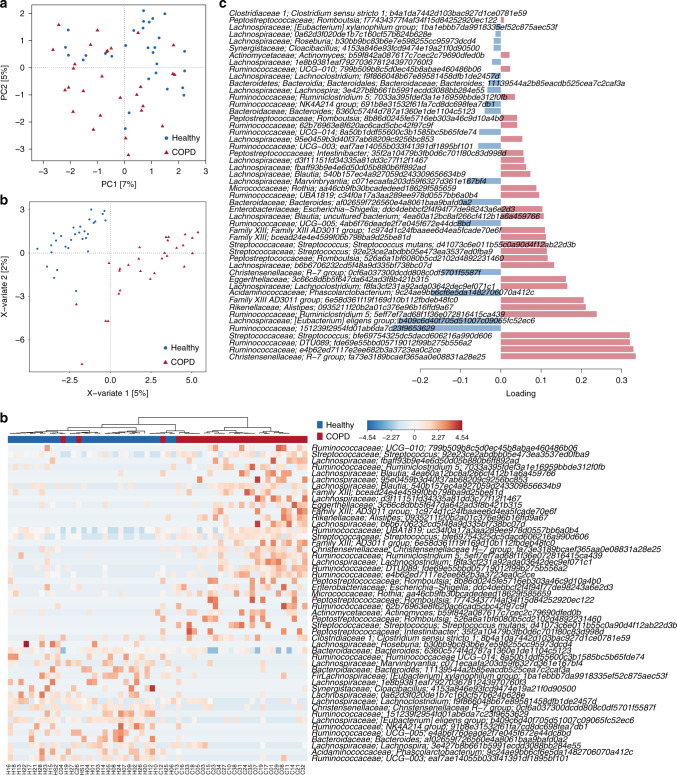
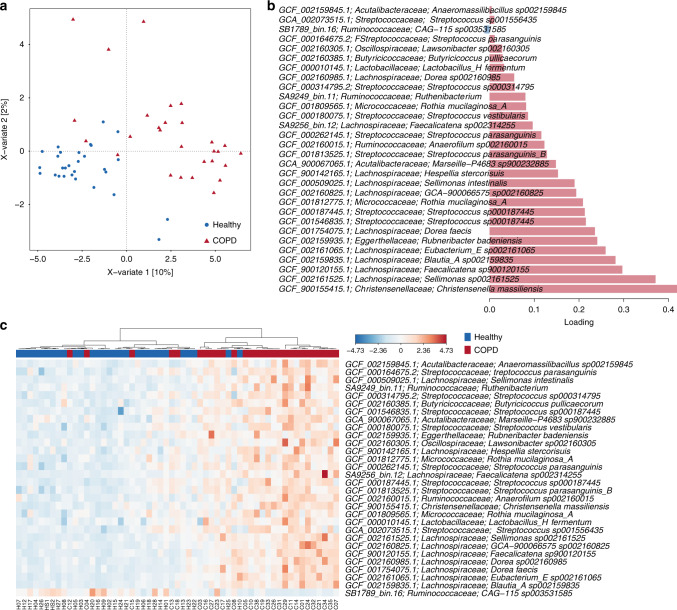
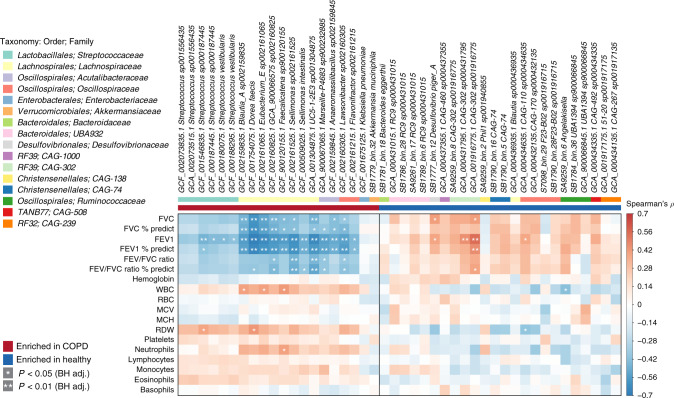
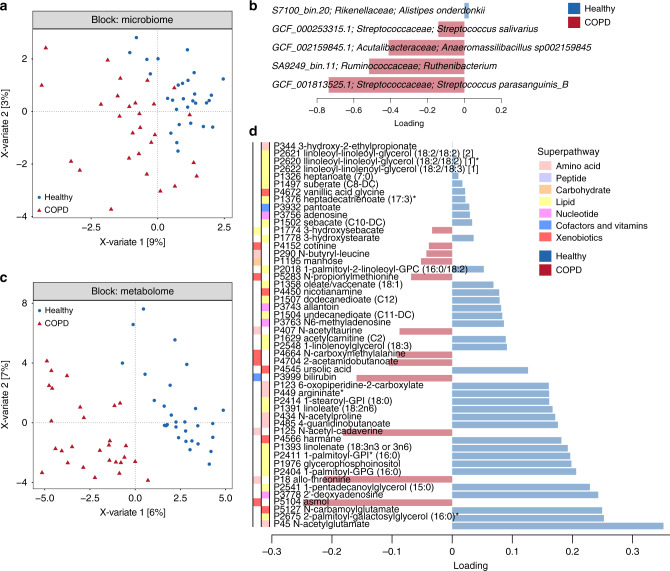
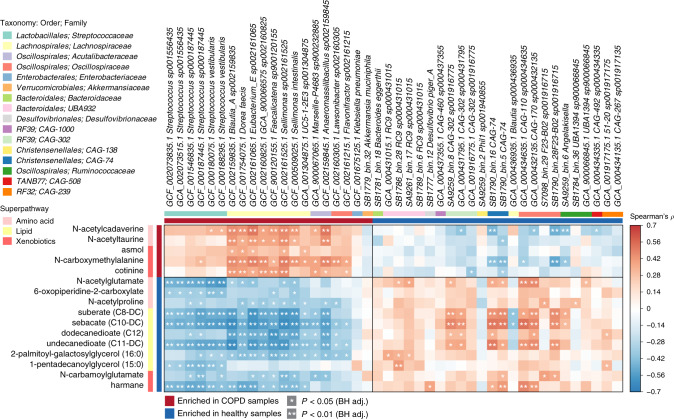
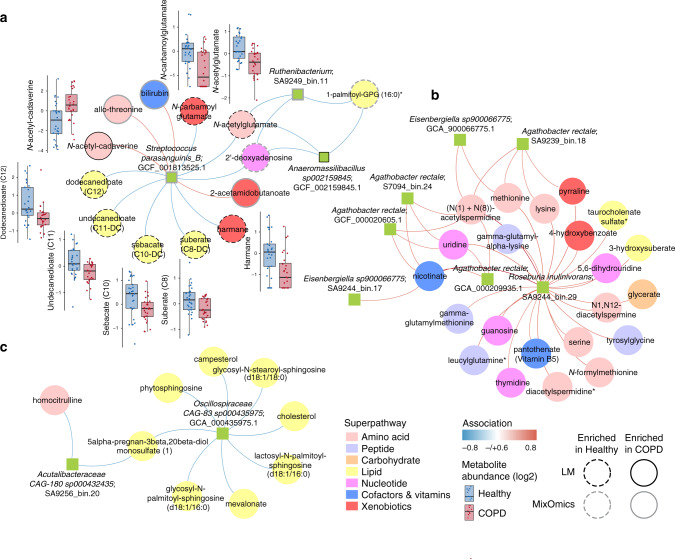
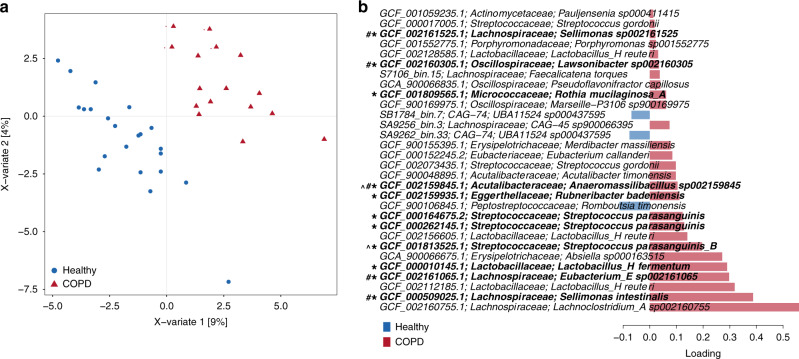
Chronic obstructive pulmonary disease (COPD) is the third commonest cause of death globally, and manifests as a progressive inflammatory lung disease with no curative treatment. The lung microbiome contributes to COPD progression, but the function of the gut microbiome remains unclear. Here we examine the faecal microbiome and metabolome of COPD patients and healthy controls, finding 146 bacterial species differing between the two groups. Several species, including Streptococcus sp000187445, Streptococcus vestibularis and multiple members of the family Lachnospiraceae, also correlate with reduced lung function. Untargeted metabolomics identifies a COPD signature comprising 46% lipid, 20% xenobiotic and 20% amino acid related metabolites. Furthermore, we describe a disease-associated network connecting Streptococcus parasanguinis_B with COPD-associated metabolites, including N-acetylglutamate and its analogue N-carbamoylglutamate. While correlative, our results suggest that the faecal microbiome and metabolome of COPD patients are distinct from those of healthy individuals, and may thus aid in the search for biomarkers for COPD.


Conflict of interest statement

P.H. is a co-founder of Microba Life Sciences Limited, and D.L.A.W. is currently an employee of Microba. The remaining authors declare no competing interests.

Figures

Fig. 1
Fig. 1. Faecal microbiota of COPD patients (n = 28) can be distinguished from that of healthy individuals (n = 29) using 16S rRNA gene amplicon sequencing.
a Principal component (PC) analysis undertaken at the sequence variant level using read counts transformed using log-cumulative-sum scaling. b Multivariate sparse partial least-squares discriminant analysis (sPLS-DA) of read counts transformed using log-cumulative-sum scaling at the sequence variant level. c Sequence variants contributing to separation along with component 1 of sPLS-DA from b. Bar length indicates loading coefficient weight of selected genomes, ranked by importance, bottom to top; bar colour indicates the group in which the sequence variant has the highest median abundance, red = COPD, blue = healthy. d Heatmap of read counts transformed using log-cumulative-sum scaling of discriminatory sequence variants identified along with component 1 of sPLS-DA from (b).
Fig. 2
Fig. 2. Metagenomic sequencing-based exploration of COPD-associated (n = 28) faecal microbiomes supports distinction from those of healthy individuals (n = 29).
a Multivariate sparse partial least-squares discriminant analysis (sPLS-DA) of read-mapping-based relative abundance at the genome level of the faecal microbiome, filtered for genomes with minimum 0.05% relative abundance in at least one sample. b Genomes contributing to separation along with component 1 of sPLS-DA from (a). Bar length indicates loading coefficient weight of selected genomes, ranked by importance, bottom to top; bar colour indicates the group in which the genome has the highest median abundance, red = COPD, blue = healthy. c Heatmap of discriminatory genomes along component 1 of sPLS-DA from (a). Data are centred with log-ratio-transformed relative abundance.
Fig. 3
Fig. 3. Correlation of members of the faecal microbiome with lung function.
Spearman’s rho calculated between mapping-based read counts per genome and phenotypic scores. Genomes included are those from Supplementary Data 11, with enrichment in either COPD or healthy samples indicated by the coloured bar along the top of the heatmap. White stars within heatmap boxes indicate significant results (*p < 0.05; **p < 0.01, Student’s t test (two-sided), Benjamini–Hochberg adjustment for multiple comparisons. Exact p values are provided in Supplementary Data 34). Genome abundances were centred with log-ratio transformation prior to analysis. FVC forced vital capacity, FEV forced expiratory volume, WBC white blood cell, RBC red blood cell, MCV mean corpuscular volume, MCH mean corpuscular haemoglobin, RDW red cell distribution width. COPD: n = 28; healthy: n = 29.
Fig. 4
Fig. 4. Faecal metabolome of COPD patients (n = 28) is distinguished from that of healthy individuals (n = 29) using a multi-omic analysis.
a DIABLO sample plot demonstrating discrimination between COPD and healthy samples based on microbiome data. b Genomes contributing to separation along with component 1 of (a). Bar length indicates loading coefficient weight of selected genomes, ranked by importance, bottom to top; bar colour indicates the group in which the sequence variant has the highest median abundance, red = COPD, blue = healthy. Microbiome data are centred log-ratio-transformed relative abundance, filtered for genomes with minimum 0.05% relative abundance in at least ten samples. c DIABLO sample plot demonstrating discrimination between groups based on metabolomics data. d Metabolites contributing to separation along with component 1 of (c). Metabolome data are log-transformed median-scaled values with missing values imputed using the minimum value for each compound, filtered for metabolites returning measurements in at least ten samples.
Fig. 5
Fig. 5. COPD-associated species correlate with metabolites differentiating COPD (n = 28) and healthy (n = 29) individuals.
Species and metabolites included are those identified as significantly differential between COPD and healthy samples, including age, sex and BMI within the relevant models (Supplementary Data 7 and 21). Enrichment in either group indicated by coloured bars to the left and top of the plot. Significant correlations denoted by white stars (*p < 0.05; **p < 0.01, Student’s t test (two-sided), Benjamini–Hochberg adjustment for multiple comparisons. Exact p values are provided in Supplementary Data 35). Higher taxonomy of species (order, family) and super pathway of metabolites are indicated by coloured bars.
Fig. 6
Fig. 6. Integration of faecal microbiomes and metabolomes identifies a COPD-associated network.
ac Integration of microbiome and metabolome datasets using the software DIABLO produced association networks showing correlations between bacterial species and metabolites. A positive correlation between nodes is indicated by red connecting lines, negative correlation by blue. Species and metabolites enriched in COPD or healthy samples are denoted by solid or dashed borders, respectively. Black borders indicate significance in the linear model adjusted for age, sex and BMI (p < 0.05, Wald test (two-sided) with Benjamini–Hochberg adjustment for multiple comparisons, Supplementary Data 7 and 21) and grey borders indicate selection by MixOmics as discriminatory along with component 1 of Fig. 4a, b. All metabolites significant within the linear model were also selected by MixOmics. The abundance of metabolites (log-transformed median scaled) significant in the linear model provided as boxplots adjacent to the relevant nodes. Each box centres on the median, with lower and upper bounds representing the first and third quartile (25th and 75th percentile), respectively. Whiskers extend 1.5 times the interquartile range from the outer bounds. Microbiome data filtered for genomes with minimum of 0.05% relative abundance in ≥10 samples. Metabolome data filtered for metabolites returning measurements in ≥10 samples. Microbiome data are centred log-ratio- transformed relative abundance. Metabolomics data are log-transformed median-scaled values with missing values imputed using a minimum value for each compound. COPD: n = 28; healthy: n = 29.
Fig. 7
Fig. 7. Association of gut microbiome members with COPD replicate in an independent cohort.
a Multivariate sparse partial least-squares discriminant analysis (sPLS-DA) of read-mapping-based relative abundance at the genome level of the faecal microbiome, filtered for genomes with minimum 0.05% relative abundance in at least one sample. b Genomes contributing to separation along with component 1 of sPLS-DA from (a). Bar length indicates loading coefficient weight of selected genomes, ranked by importance, bottom to top; bar colour indicates the group in which the genome has the highest median abundance, red = COPD, blue = healthy. Genomes marked with * are those within the discriminatory signature defined for the study cohort (Fig. 2), # indicates genomes associated with clinical phenotypes (Fig. 3) and ^ indicates genomes within the disease-associated network (Fig. 6). COPD: n = 16; healthy: n = 22.

References

    1. Rabe KF, Watz H. Chronic obstructive pulmonary disease. Lancet. 2017;389:1931–1940. doi: 10.1016/S0140-6736(17)31222-9. - DOI - PubMed
    1. Keely S, Talley NJ, Hansbro PM. Pulmonary-intestinal cross-talk in mucosal inflammatory disease. Mucosal Immunol. 2012;5:7–18. doi: 10.1038/mi.2011.55. - DOI - PMC - PubMed
    1. Naghavi M, et al. Global, regional, and national age-sex specific mortality for 264 causes of death, 1980-2016: a systematic analysis for the Global Burden of Disease Study 2016. Lancet. 2017;390:1151–1210. doi: 10.1016/S0140-6736(17)32152-9. - DOI - PMC - PubMed
    1. Mannino DM, Buist AS. Global burden of COPD: risk factors, prevalence, and future trends. Lancet. 2007;370:765–773. doi: 10.1016/S0140-6736(07)61380-4. - DOI - PubMed
    1. Fricker M, et al. Chronic cigarette smoke exposure induces systemic hypoxia that drives intestinal dysfunction. JCI Insight. 2018;3:e94040. doi: 10.1172/jci.insight.94040. - DOI - PMC - PubMed

Publication types

MeSH terms