Clinical Trial
. 2020 Nov 18;11(1):5881.
doi: 10.1038/s41467-020-19589-w.

Imidazole propionate is increased in diabetes and associated with dietary patterns and altered microbial ecology

Collaborators, Affiliations
Clinical Trial

Imidazole propionate is increased in diabetes and associated with dietary patterns and altered microbial ecology

Antonio Molinaro et al. Nat Commun. .

Erratum in

  • Author Correction: Imidazole propionate is increased in diabetes and associated with dietary patterns and altered microbial ecology.
    Molinaro A, Bel Lassen P, Henricsson M, Wu H, Adriouch S, Belda E, Chakaroun R, Nielsen T, Bergh PO, Rouault C, André S, Marquet F, Andreelli F, Salem JE, Assmann K, Bastard JP, Forslund S, Le Chatelier E, Falony G, Pons N, Prifti E, Quinquis B, Roume H, Vieira-Silva S, Hansen TH, Pedersen HK, Lewinter C, Sønderskov NB; MetaCardis Consortium; Køber L, Vestergaard H, Hansen T, Zucker JD, Galan P, Dumas ME, Raes J, Oppert JM, Letunic I, Nielsen J, Bork P, Ehrlich SD, Stumvoll M, Pedersen O, Aron-Wisnewsky J, Clément K, Bäckhed F. Molinaro A, et al. Nat Commun. 2020 Dec 21;11(1):6448. doi: 10.1038/s41467-020-20412-9. Nat Commun. 2020. PMID: 33349634 Free PMC article. No abstract available.

Abstract

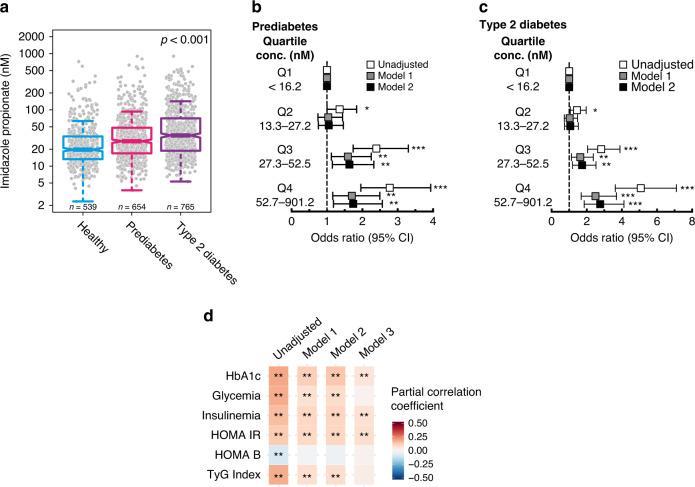
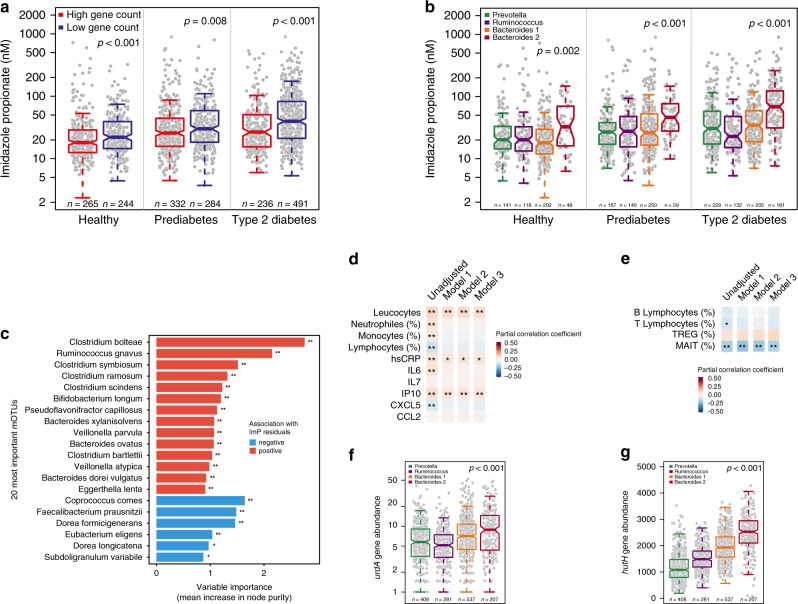
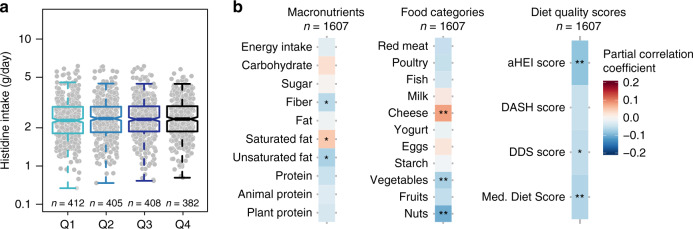
Microbiota-host-diet interactions contribute to the development of metabolic diseases. Imidazole propionate is a novel microbially produced metabolite from histidine, which impairs glucose metabolism. Here, we show that subjects with prediabetes and diabetes in the MetaCardis cohort from three European countries have elevated serum imidazole propionate levels. Furthermore, imidazole propionate levels were increased in subjects with low bacterial gene richness and Bacteroides 2 enterotype, which have previously been associated with obesity. The Bacteroides 2 enterotype was also associated with increased abundance of the genes involved in imidazole propionate biosynthesis from dietary histidine. Since patients and controls did not differ in their histidine dietary intake, the elevated levels of imidazole propionate in type 2 diabetes likely reflects altered microbial metabolism of histidine, rather than histidine intake per se. Thus the microbiota may contribute to type 2 diabetes by generating imidazole propionate that can modulate host inflammation and metabolism.


Conflict of interest statement

F.B. is shareholder in Implexion pharma AB. K.C. is a consultant for Danone Research and LNC therapeutics for work unassociated with the present study. K.C. has held a collaborative research contract with Danone Research in the context of MetaCardis project. M.B. received lecture and/or consultancy fees from AstraZeneca, Boehringer-Ingelheim, Lilly, Novo Nordisk, Novartis and Sanofi. The remaining authors do not report any competing interests.

Figures

Fig. 1
Fig. 1. Imidazole propionate is increased in subjects with type 2 diabetes.
a Serum levels of imidazole propionate in healthy subjects (n = 539), subjects with prediabetes (n = 654), and with type 2 diabetes (n = 765). P-values were calculated with linear regression. Data are represented as boxplots: middle line is the median, the lower and upper hinges are the first and third quartiles, the upper whisker extends from the hinge to the largest value no further than 1.5× the interquartile range (IQR) from the hinge, and the lower whisker extends from the hinge to the smallest value at most 1.5× IQR of the hinge. Gray dots are single data points. b, c. Multinomial logistic regression for prediabetes and type 2 diabetes vs. healthy controls according to imidazole propionate quartiles. Odds ratios (OR) were calculated using the lowest quartile of imidazole propionate (Q1) as reference. Model 1 OR was adjusted for age, gender, body mass index (BMI), and ethnicity. Model 2 OR was adjusted for model 1 plus creatinine clearance. Squares represent OR and the upper and lower whisker the 95% confidence intervals (CI), raw data are presented in Supplementary Table 1. *P < 0.05, **P < 0.01, ***P < 0.001 d. Correlation matrix for imidazole propionate and glycated hemoglobin (HbA1c), glycemia, insulinemia, homeostatic model assessment of insulin resistance (HOMA-IR), updated HOMA model for beta-cell function (HOMA-B), and the triglyceride and glucose (TyG) index. Pearson partial correlation coefficients and P-values were calculated using partial correlations adjusted for Model 1: age, gender, body mass index, and ethnicity. Model 2: Model 1 plus creatinine clearance, Model 3: Model 2 plus diabetes status. False discovery rate (FDR) adjusted *P < 0.05, **P < 0.01. See also Supplementary Table 2. Source data are provided as a Source Data file.
Fig. 2
Fig. 2. Imidazole propionate is associated with a pro-inflammatory microbiota.
Serum levels of imidazole propionate (ImP) in healthy subjects (n = 509), subjects with prediabetes (n = 616), and with type 2 diabetes (n = 727) according to a bacterial gene count and b enterotypes. P-values were calculated with linear regression adjusted for age, gender, BMI, ethnicity, and creatinine clearance. c Random forest for the 20 most significant mOTUs correlated with ImP residuals, after adjustment for age, gender, BMI, ethnicity, creatinine clearance, and diabetes status. FDR adjusted P-value of spearman correlation between taxa and imp residuals *P < 0.05, **P < 0.01. See also Supplementary Table 4. d Partial correlation matrix for ImP serum levels and serum leucocytes count (109/l), neutrophils (%), monocytes (%), lymphocytes (%), C-reactive protein (CRP), Interleukin 6 (IL-6), Interleukin 7 (IL-7), Interferon gamma-induced protein 10 (IP-10), C-X-C motif chemokine 5 (CXCL5), chemokine (C-C motif) ligand 2 (CCL2). Pearson partial correlation coefficients and P-values were calculated using partial correlations adjusted for Model 1: age, gender, body mass index, and ethnicity. Model 2: Model 1 plus creatinine clearance, Model 3: Model 2 plus diabetes status. *P < 0.05, **P < 0.01, ***P < 0.001. See also Supplementary Table 5. e Partial correlation matrix in a subgroup of patients (n = 439) between serum ImP and circulating B- and T lymphocytes (%), regulatory T cells (TREG, %) and mucosal-associated invariant T cell (MAIT, %). Partial correlation coefficients (Pearson for all variables except for MAIT cells for which Spearman coefficient was used since variable distribution remained skewed despite log-transformation) and P-values were calculated using partial correlations for Model 1: age, gender, body mass index, and ethnicity. Model 2: Model 1 plus creatinine clearance, Model 3: Model 2 plus diabetes status. *P < 0.05, **False discovery rate (FDR) adjusted P < 0.05. See also Supplementary Table 6. Relative abundances of urdA gene (f) and hutH (g) according to enterotype. P-values were calculated with linear regression adjusted for age, gender, BMI, and ethnicity. For a, b, f, g data are represented as boxplots: middle line is the median, the lower and upper hinges are the first and third quartiles, the upper whisker extends from the hinge to the largest value no further than 1.5× the interquartile range (IQR) from the hinge and the lower whisker extends from the hinge to the smallest value at most 1.5× IQR of the hinge. Gray dots are single data points. Source data are provided as a Source Data file.
Fig. 3
Fig. 3. Imidazole propionate is associated with an unhealthy diet, but not histidine intake.
a Dietary histidine intake according to quartiles of imidazole propionate. P-values were calculated with linear regression adjusted for age, gender, body mass index, ethnicity, diabetes status, creatinine clearance, daily energy intake (kcal/day), and enrollment center. Data are represented as boxplots: middle line is the median, the lower and upper hinges are the first and third quartiles, the upper whisker extends from the hinge to the largest value no further than 1.5× the interquartile range (IQR) from the hinge, and the lower whisker extends from the hinge to the smallest value at most 1.5× IQR of the hinge. Gray dots are single data points. b Correlation matrix for imidazole propionate serum levels and macronutrients, food categories and dietary scores [the alternate Healthy Eating Index (aHEI), Dietary Approaches to Stop Hypertension (DASH) score, dietary diversity score (DDS) and Mediterranean diet score]. Pearson partial correlation coefficients and P-values were calculated using partial correlations adjusted for age, gender, body mass index, ethnicity, diabetes status, creatinine clearance, daily energy intake (kcal/day), and enrollment center. *P < 0.05, **False discovery rate (FDR) adjusted P < 0.05. See Supplementary Table 8. Source data are provided as a Source Data file.

References

    1. Qin J, et al. A metagenome-wide association study of gut microbiota in type 2 diabetes. Nature. 2012;490:55–60. doi: 10.1038/nature11450. - DOI - PubMed
    1. Karlsson FH, et al. Gut metagenome in European women with normal, impaired and diabetic glucose control. Nature. 2013;498:99–103. doi: 10.1038/nature12198. - DOI - PubMed
    1. Zhou W, et al. Longitudinal multi-omics of host-microbe dynamics in prediabetes. Nature. 2019;569:663–671. doi: 10.1038/s41586-019-1236-x. - DOI - PMC - PubMed
    1. Larsen N, et al. Gut microbiota in human adults with type 2 diabetes differs from non-diabetic adults. PLoS ONE. 2010;5:e9085. doi: 10.1371/journal.pone.0009085. - DOI - PMC - PubMed
    1. Allin KH, et al. Aberrant intestinal microbiota in individuals with prediabetes. Diabetologia. 2018;61:810–820. doi: 10.1007/s00125-018-4550-1. - DOI - PMC - PubMed

Publication types