. 2020 Nov 18;10(1):19778.
doi: 10.1038/s41598-020-75213-3.

The ongoing nutrition transition thwarts long-term targets for food security, public health and environmental protection

Affiliations

The ongoing nutrition transition thwarts long-term targets for food security, public health and environmental protection

Benjamin Leon Bodirsky et al. Sci Rep. .

Abstract

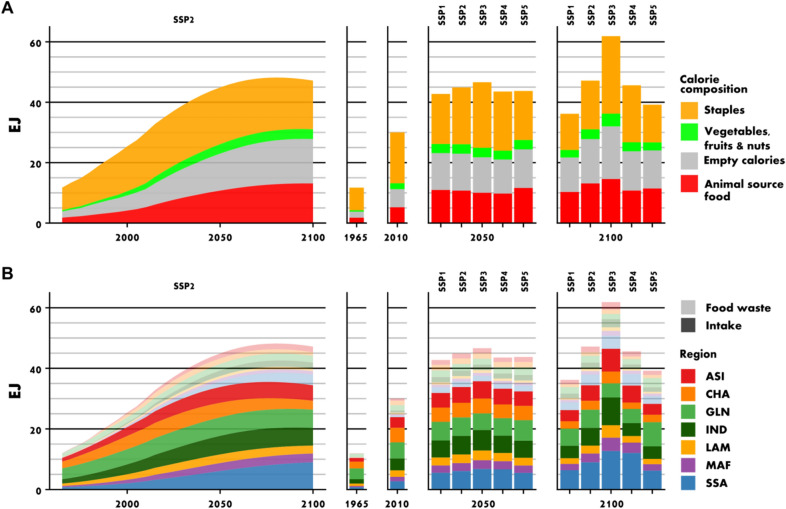
The nutrition transition transforms food systems globally and shapes public health and environmental change. Here we provide a global forward-looking assessment of a continued nutrition transition and its interlinked symptoms in respect to food consumption. These symptoms range from underweight and unbalanced diets to obesity, food waste and environmental pressure. We find that by 2050, 45% (39-52%) of the world population will be overweight and 16% (13-20%) obese, compared to 29% and 9% in 2010 respectively. The prevalence of underweight approximately halves but absolute numbers stagnate at 0.4-0.7 billion. Aligned, dietary composition shifts towards animal-source foods and empty calories, while the consumption of vegetables, fruits and nuts increases insufficiently. Population growth, ageing, increasing body mass and more wasteful consumption patterns are jointly pushing global food demand from 30 to 45 (43-47) Exajoules. Our comprehensive open dataset and model provides the interfaces necessary for integrated studies of global health, food systems, and environmental change. Achieving zero hunger, healthy diets, and a food demand compatible with environmental boundaries necessitates a coordinated redirection of the nutrition transition. Reducing household waste, animal-source foods, and overweight could synergistically address multiple symptoms at once, while eliminating underweight would not substantially increase food demand.


Conflict of interest statement

The authors declare no competing interests.

Figures

Figure 1
Figure 1
The prevalence of underweight decreases in the world population, while overweight and obesity increase. The figure shows the world population by body mass index (BMI) for adults (15+ years) (A) and children (0–14 years) (B) over the period 1965–2100 for different population scenarios of the Shared Socioeconomic Pathways (SSPs) in million people. The left side is the middle of the road scenario SSP2, the right side provides comparison to the other SSPs for 2050 and 2100. Colors categorize by absolute body mass index (BMI) for adults, and by standard deviations from WHO growth standards for children. Blue colors indicate underweight, yellow overweight, and red obesity.
Figure 2
Figure 2
With rising per-capita income, underweight declines and overweight increases, while the share of people with a healthy Body Mass Index (BMI) declines. The figure shows the estimated isoquants for the proportions of the population with specific Body Mass Index (BMI) by per-capita income (in US Dollar 2005 in purchase power parity) for males (left) and females (right) divided by age-groups into children of 0–14 years (top), working age adults of 15–59 years (middle) and retirement age adults of 60+ years (bottom). For children, we use standard deviations from WHO growth standards. Blue colors indicate underweight, yellow overweight, and red obesity.
Figure 3
Figure 3
Unbalanced diets: The shift from scarcity to overconsumption. The map colors show the prevalence of underweight and obesity in the population. For the 16 most populous countries, symbols indicate further details on anthropometrics, dietary composition and food waste. Country abbreviations are ISO3-country-codes. Estimates for 2050 are model projections. For 1965 and 2010, reported data is complemented with model estimates for missing data. Body mass index estimates for 1965 were complemented as reported data only starts in 1975. Dietary composition data had to be complemented for some major countries without reported data such as the Philippines or the Democratic Republic of the Congo. Food waste estimates are all model projections.
Figure 4
Figure 4
Global food demand is expected to strongly increase. Demand for animal-source foods and demand for empty calories increase over-proportionally (A). The largest increase of global food demand is projected for Africa (B). The figure shows total food demand by main food groups (A), and by world regions split by intake and food waste (B). ASI Rest of Asia, CHA China, GLN Global North, IND India, LAM Latin America, MAF Middle East and Northern Africa, SSA Sub-Saharan Africa. See Supplementary Information 1 for the country-region mapping.
Figure 5
Figure 5
Growth in per-capita food demand is driven to similar extents by increasing body mass index (and connected under- or overconsumption), higher food waste and rising food energy requirements (dependent on age, sex and height for a normal-weight BMI) (A). Total demand for animal-source foods is mainly driven by population growth and a higher share of animal-source-foods in diets (B). The figure shows a decomposition of growth rates based on the decomposition method described in Supplementary Information 2, section S11 for different world regions (see Supplementary Information 1 for the country-region mapping). Black line indicates net growth.
Figure 6
Figure 6
Model design. Red font indicates model drivers. Colored layers indicate the dimensionality of the variables.

References

    1. Popkin BM. Nutritional patterns and transitions. Popul. Dev. Rev. 1993;19:138. doi: 10.2307/2938388. - DOI
    1. FAO, IFAD, UNICEF, WFP & WHO. The State of Food Security and Nutrition in the World 2018. 202 (2018).
    1. Masters WA, et al. The nutrition transition and agricultural transformation: A Preston curve approach. Agric. Econ. 2016;47:97–114. doi: 10.1111/agec.12303. - DOI
    1. GBD 2015 Risk Factors Collaborators Global, regional, and national comparative risk assessment of 79 behavioural, environmental and occupational, and metabolic risks or clusters of risks, 1990–2015: A systematic analysis for the global burden of disease study 2015. Lancet. 2016;388:1659–1724. doi: 10.1016/S0140-6736(16)31679-8. - DOI - PMC - PubMed
    1. GBD 2017 Diet Collaborators. Health effects of dietary risks in 195 countries, 1990–2017: A systematic analysis for the Global Burden of Disease Study 2017. Lancet393, 10184 (2019). - PMC - PubMed

Publication types