. 2020 Nov 18;10(1):20074.
doi: 10.1038/s41598-020-76932-3.

JavaCyte, a novel open-source tool for automated quantification of key hallmarks of cardiac structural remodeling

Affiliations

JavaCyte, a novel open-source tool for automated quantification of key hallmarks of cardiac structural remodeling

J Winters et al. Sci Rep. .

Abstract

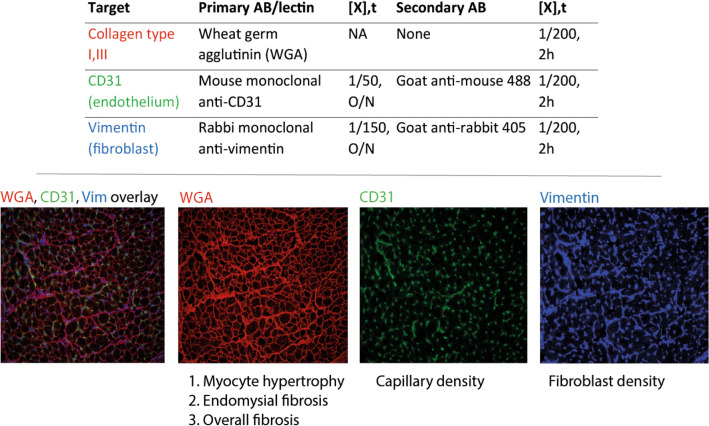
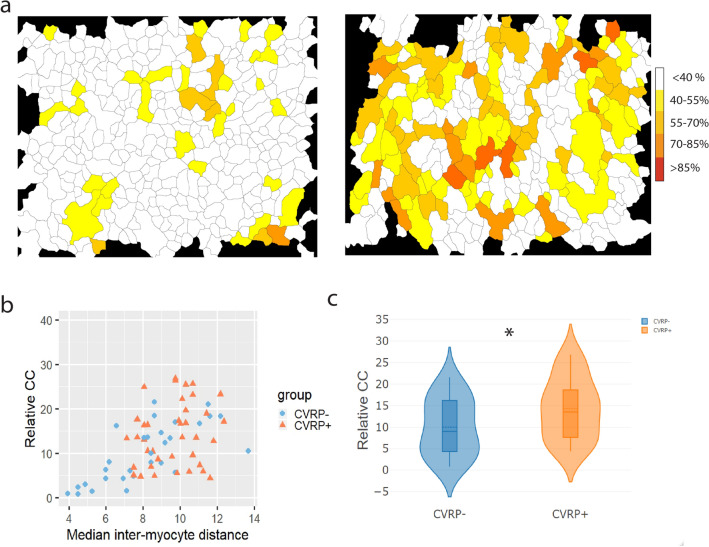
Many cardiac pathologies involve changes in tissue structure. Conventional analysis of structural features is extremely time-consuming and subject to observer bias. The possibility to determine spatial interrelations between these features is often not fully exploited. We developed a staining protocol and an ImageJ-based tool (JavaCyte) for automated histological analysis of cardiac structure, including quantification of cardiomyocyte size, overall and endomysial fibrosis, spatial patterns of endomysial fibrosis, fibroblast density, capillary density and capillary size. This automated analysis was compared to manual quantification in several well-characterized goat models of atrial fibrillation (AF). In addition, we tested inter-observer variability in atrial biopsies from the CATCH-ME consortium atrial tissue bank, with patients stratified by their cardiovascular risk profile for structural remodeling. We were able to reproduce previous manually derived histological findings in goat models for AF and AV block (AVB) using JavaCyte. Furthermore, strong correlation was found between manual and automated observations for myocyte count (r = 0.94, p < 0.001), myocyte diameter (r = 0.97, p < 0.001), endomysial fibrosis (r = 0.98, p < 0.001) and capillary count (r = 0.95, p < 0.001) in human biopsies. No significant variation between observers was observed (ICC = 0.89, p < 0.001). We developed and validated an open-source tool for high-throughput, automated histological analysis of cardiac tissue properties. JavaCyte was as accurate as manual measurements, with less inter-observer variability and faster throughput.


Conflict of interest statement

The authors declare no competing interests.

Figures

Figure 1
Figure 1
Disadvantages of automated analysis of Sirius red and Masson’s Trichrome staining. Similarity in RGB values for myocytes and fibrous tissue following Sirius red staining complicate automated analysis. Manual thresholding is slow, inaccurate and prone to observer bias. Endomysial septa are poorly visibile in both staining approaches. Co-localization of other important markers of structural remodeling is not possible.
Figure 2
Figure 2
Triple immunohistochemical staining for the visualization of fibrous structures, endothelial cells and fibroblasts. Optimal contrast between three fluorescent components allows to study the spatial correlation between fibrous tissue (red, WGA), endothelial cells (green, CD31/GSI-B4) and fibroblasts (vimentin).
Figure 3
Figure 3
Analysis pipeline of WGA images applying JavaCyte. (a) Original image following WGA staining. (b) Phansalkar thresholding of a WGA image. ECM is represented in white, cardiomyocytes in black. (c) For each cardiomyocyte, minimal Feret diameter (green) is determined as a measure for size. Neighbors are detected. Local minima of neighboring cells are connected with a line selection (yellow). (d) Pixel values across the line selection are plotted. The width of the profile plot corresponds to the width of the endomysial septum between two neighboring cardiomyocytes. (e) A control image is generated for visual inspection of accuracy. (f) For each cell, cardiomyocyte dissociation index (CDI) is visualized as a measure for fibrosis surrounding the cell.
Figure 4
Figure 4
Analysis pipeline of CD31/GSI-B4 and vimentin images applying JavaCyte. CD31/GSI-B4 positive objects (top left) and vimentin positive objects (top right) are segmented (bottom left and bottom right) according to Landini’s algorithm for HSB thresholding. Capillary count is determined. Capillary size is obtained for objects that meet circularity requirements. Non-circular objects are ignored in size measurements, but are counted for determination of the total number. Fibroblast count is obtained after correction for cross-reactive endothelial vimentin staining.
Figure 5
Figure 5
Increased inter-myocyte distance in LT-AF goats and myocyte hypertrophy in LT-AF goats and AVB goats. (a) Total ECM content is similar in Sham-operated goats and goats in ST-AF, LT-AF and AVB. (b) Significantly more endomysial fibrosis is observed in the epicardial layer in LT-AF goats (3.61 ± 0.10 µm) than in ST-AF goats (3.19 ± 0.08, p = 0.01 µm) or Sham-operated goats (2.87 ± 0.10 µm, p < 0.001). There is more endomysial fibrosis in AVB goats (3.24 ± 0.09 µm) than Sham-operated goats (2.87 ± 0.10 µm, p = 0.02), and more endomysial fibrosis in LT-AF goats (3.61 ± 0.10 µm) than AVB goats (3.24 ± 0.09 µm, p = 0.03). These differences are not present in the endocardium. (c) Cardiomyocytes are larger in ST-AF goats (11.50 ± 0.48 µm, p = 0.03), LT-AF goats (11.72 ± 0.55 µm, p = 0.02) and AVB goats (12.83 ± 0.52 µm, p < 0.001) compared to Sham-operated goats (9.36 ± 0.57 µm). (d) Capillary density or size did not differ. * significant at p < 0.05, ** significant at p < 0.001.
Figure 6
Figure 6
Two-step validation of JavaCyte algorithm. (a) Human tissue is typically more heterogeneous resulting from (unknown) comorbidities. (b) Manual observations for myocyte count (R = 0.94), correlated strongly to automated results applying JavaCyte. The mean difference in minimal Feret diameter of matched cardiomyocytes is small. (c) Manual Median inter-cardiomyocyte distances correlates strongly with measurements made applying JavaCyte. (d) Intra-class correlation testing showed no difference between two independent, blinded observers who each acquired 10 unique images per sample of 10 patients (ICC = 0.89).
Figure 7
Figure 7
Features of structural remodeling in CVRP+ compared to CVRP– patients. 22 patients were matched and stratified into two equal groups based on their cardiovascular risk profile (CVRP). (a) Total ECM content is similar between the 2 groups. (b) Endomysial fibrosis is significantly more present in atrial tissue of CVRP+ patients (+ 1.90 µm, p < 0.001). (c) The fraction of cells that is at least 50% dissociated from its neighbors (CDI > 50%) is larger in the CVRP+ group (+ 12.6%, p < 0.001). (d) Tissue of CVRP+ patients shows signs of myocyte hypertrophy compared to CVPR- patients (+ 1.6 µm, p = 0.02). (e) The number of capillaries per myocyte was similar between both groups. (f) The fibroblast-to-myocyte ratio is enhanced in CVRP+ patients compared to CVRP– patients (+ 9.2%, p = 0.003). * significant at p < 0.05, ** significant at p < 0.001.
Figure 8
Figure 8
Clustering of enhanced endomysial fibrosis in CVRP– and CVRP+ patients. (a) Heat maps showing spatial distribution of CDI for each cardiomyocyte in an image, representing the degree of surrounding fibrosis. (b) Relative deviation in clustering coefficient (CC) from the expected clustering coefficient based on permutation testing. More clustering than expected in CVRP– (p score = 0.965) and CVRP+ (p score  = 0.957) patients. (c) The observed CC deviates more relative to the expected CC in CVRP+ patients than in CVRP– patients (+ 4.3%, p = 0.02). * significant at p < 0.05.

References

    1. Piek A, Sillje HHW, de Boer RA. The vicious cycle of arrhythmia and myocardial fibrosis. Eur. J. Heart Fail. 2019;21(4):492–494. doi: 10.1002/ejhf.1421. - DOI - PubMed
    1. Frangogiannis NG. Cardiac fibrosis: cell biological mechanisms, molecular pathways and therapeutic opportunities. Mol. Aspects Med. 2019;65:70–99. doi: 10.1016/j.mam.2018.07.001. - DOI - PubMed
    1. Burstein B, Nattel S. Atrial fibrosis: mechanisms and clinical relevance in atrial fibrillation. J. Am. Coll. Cardiol. 2008;51(8):802–809. doi: 10.1016/j.jacc.2007.09.064. - DOI - PubMed
    1. Weber KT, Pick R, Jalil JE, Janicki JS, Carroll EP. Patterns of myocardial fibrosis. J. Mol. Cell Cardiol. 1989;21(Suppl 5):121–131. doi: 10.1016/0022-2828(89)90778-5. - DOI - PubMed
    1. Kawara T, Derksen R, de Groot JR, Coronel R, Tasseron S, Linnenbank AC, et al. Activation delay after premature stimulation in chronically diseased human myocardium relates to the architecture of interstitial fibrosis. Circulation. 2001;104(25):3069–3075. doi: 10.1161/hc5001.100833. - DOI - PubMed

Publication types