. 2020 Nov 18;10(1):20044.
doi: 10.1038/s41598-020-76960-z.

Identification of the HECT E3 ligase UBR5 as a regulator of MYC degradation using a CRISPR/Cas9 screen

Affiliations

Identification of the HECT E3 ligase UBR5 as a regulator of MYC degradation using a CRISPR/Cas9 screen

Lina Schukur et al. Sci Rep. .

Abstract

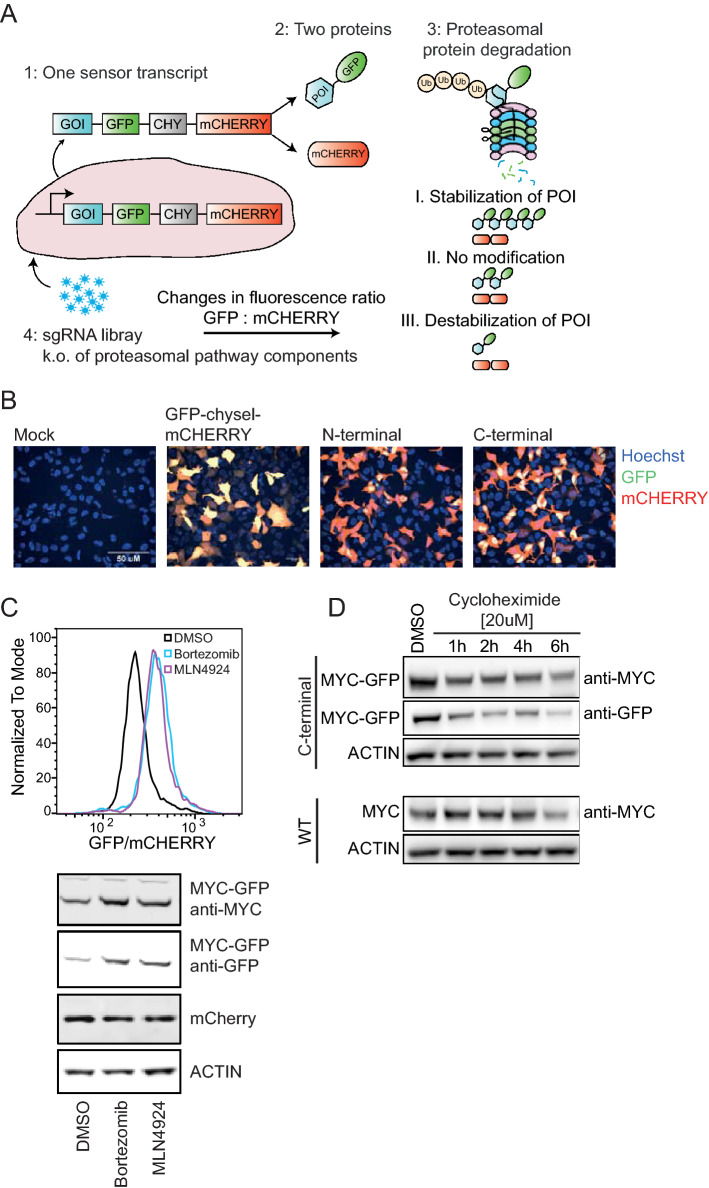
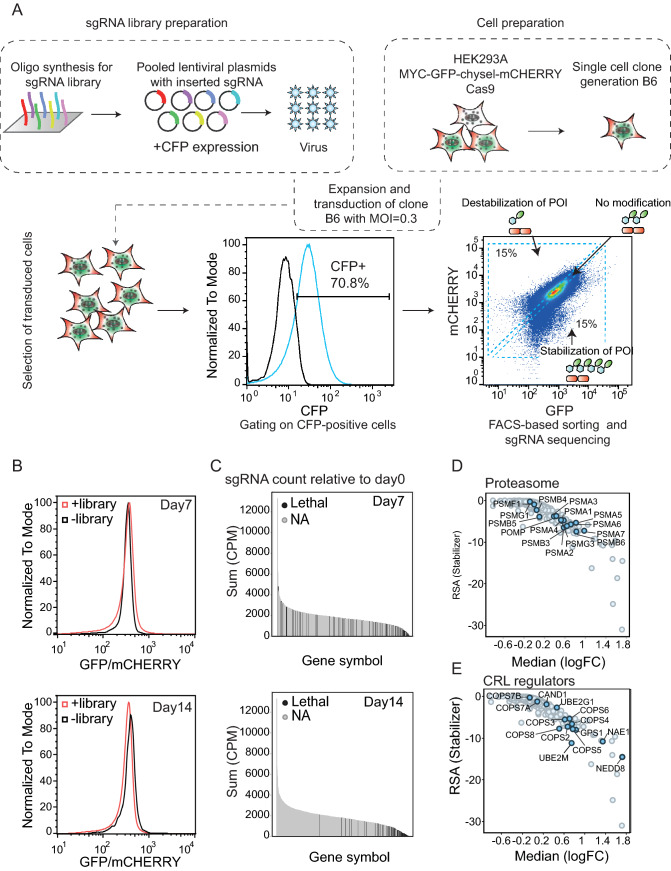
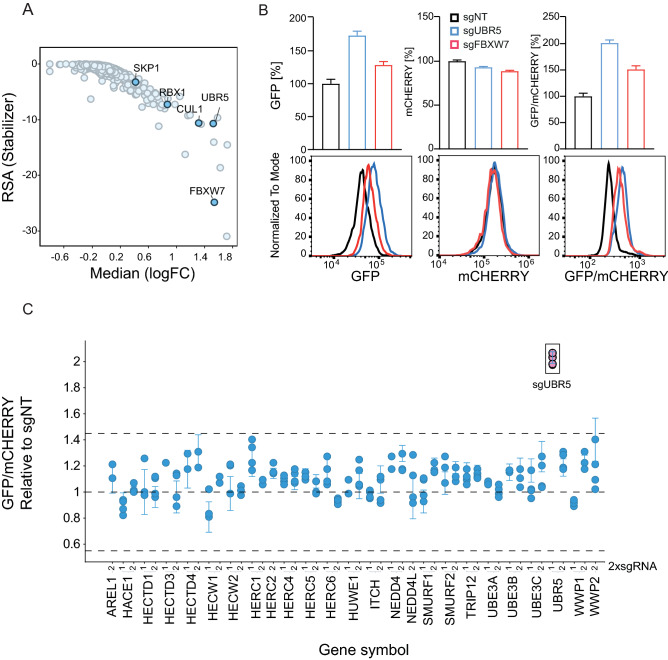
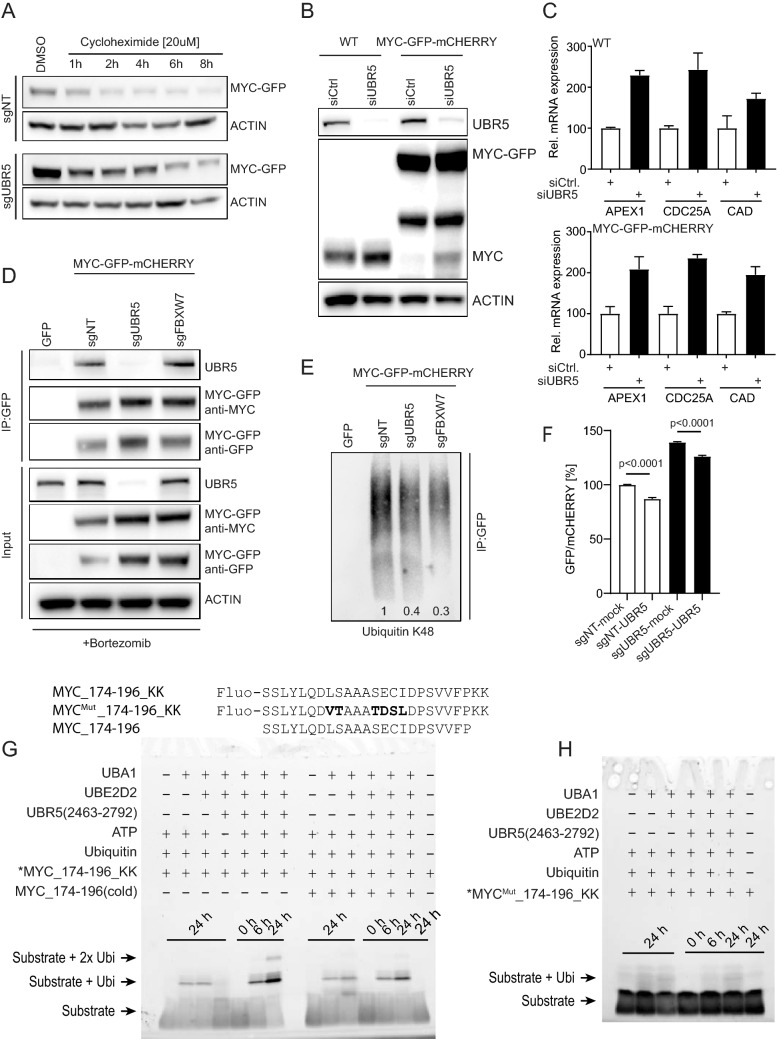
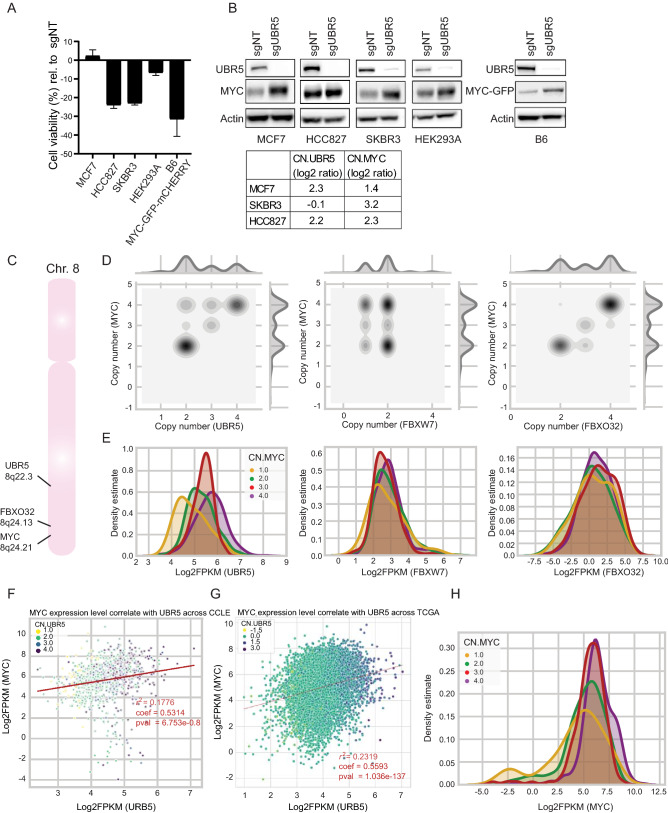
MYC oncoprotein is a multifunctional transcription factor that regulates the expression of a large number of genes involved in cellular growth, proliferation and metabolism. Altered MYC protein level lead to cellular transformation and tumorigenesis. MYC is deregulated in > 50% of human cancers, rendering it an attractive drug target. However, direct inhibition of this class of proteins using conventional small molecules is challenging due to their intrinsically disordered state. To discover novel posttranslational regulators of MYC protein stability and turnover, we established a genetic screen in mammalian cells by combining a fluorescent protein-based MYC abundance sensor, CRISPR/Cas9-based gene knockouts and next-generation sequencing. Our screen identifies UBR5, an E3 ligase of the HECT-type family, as a novel regulator of MYC degradation. Even in the presence of the well-described and functional MYC ligase, FBXW7, UBR5 depletion leads to accumulation of MYC in cells. We demonstrate interaction of UBR5 with MYC and reduced K48-linked ubiquitination of MYC upon loss of UBR5 in cells. Interestingly, in cancer cell lines with amplified MYC expression, depletion of UBR5 resulted in reduced cell survival, as a consequence of MYC stabilization. Finally, we show that MYC and UBR5 are co-amplified in more than 40% of cancer cells and that MYC copy number amplification correlates with enhanced transcriptional output of UBR5. This suggests that UBR5 acts as a buffer in MYC amplified settings and protects these cells from apoptosis.


Conflict of interest statement

All authors are or were employees and shareholders of Novartis Pharma AG.

Figures

Figure 1
Figure 1
Design and assembly of the UPS screen. (A) The UPS gene cassette drives the expression of a single transcript containing the GFP-fusion to the gene of interest (GOI) and mCHERRY, separated by the chysel peptide (CHY). The sgRNA library targeting the proteasomal pathway components is introduced into mammalian cells that stably express the UPS cassette and Cas9 through lentiviral infection. Stability modulation through sgRNA-mediated knockout is represented by changes in GFP/mCHERRY signal ratio and FACS-sorted into separate bins, followed by NGS sequencing. (B) Confocal microscopy of HEK293A cells expressing either Mock DNA, GFP-chysel-mCHERRY, or N- or C-terminal GFP-CHYSEL-mCHERRY tag to MYC ORF. (C) Single cell clone B6 was treated with MLN4942 ([1 µM]) and Bortezomib ([50 nM]) for 24 h and GFP/mCHERRY ratio was compared to DMSO control using FACS based analysis as well as western blot. The Y-axis scaling (Normalized To Mode) is a feature in the FACS analysis program flowjo based on normalizing to the peak height at mode of the distribution (the maximum Y-axis value in the absolute count = 100%).(D) Cycloheximide chase assay to compare the half-life of wild type MYC and MYC-GFP-chysel-mCHERRY in HEK293A.
Figure 2
Figure 2
UPS screen workflow and selection of MYC stability modulators. (A, B) HEK293A cells are engineered to stably overexpress C-terminal MYC sensor and Cas9. A single cell clone (B6) is generated from a multi-clonal cell population, expanded and infected with the CFP-labeled sgRNA encoding lentiviral library at a multiplicity of infection (MOI) of 0.3. After seven or 14 days of infection, puromycin-selected and CFP-positive cells (+ library) were FACS-sorted based on their GFP/mCHERRY ratio (high, low, or unmodified) and compared to uninfected cells (− library). Enrichment of sgRNA in the respective bins is compared to unsorted cell population. (C) sgRNA count on day 7 and day 14 relative to day 0 in cells with high GFP/mCHERRY ratio comparing genes essential for cell survival (lethal) to nonessential genes (NA). (D, E) Plots showing gene enrichment score in high GFP/mCHERRY-sorted cells relative to unsorted cell population visualized as LogFC.
Figure 3
Figure 3
UBR5 is a modulator of MYC stability. (A) Gene enrichment score in high GFP/mCHERRY-sorted cells relative to unsorted cell population on day 7 of library infection visualized as LogFC. (B) sgRNA-mediated knockout of UBR5 (sgUBR5), FBXW7 (sgFBXW7) or a non-targeting sgRNA control (sgNT) in B6 clone and analysis of GFP, mCHERRY, and GFP/mCHERRY ratio using FACS 7 days post-knockout. (C) MYC degradation screen using an arrayed sgRNA sublibrary. MYC-GFP/mCHERRY cells were infected with lentiviruses encoding for sgRNAs targeting HECT E3 ligases. 2 sgRNAs were used per gene (indicated as 1, 2). Seven days after infection and selection with puyromycin, GFP/mCHERRY was measured using flow cytometry and the increase in GFP/mCHERRY ratio upon knockout of the singlegenes was compared to a non-targeting control (sgNT).
Figure 4
Figure 4
Validation of UBR5 as a regulator of MYC protein stability and interaction. (A) B6 clone was transfected with sgNT or sgUBR5 for 7 days, followed by treatment with cycloheximide at 20 µM concentrations. MYC-GFP level were assessed by western blot at the indicated time points (quantification is shown in Supplementary Fig. 4A). (B) Increase in the protein level of MYC-wt as well as MYC-GFP fusion protein upon UBR5 knockdown in HEK293A cells (WT) and B6 clone (MYC-GFP-mCHERRY). (C) qPCR analysis of MYC target genes upon knockdown of UBR5. (D) Immunoprecipitation analysis showing interaction between UBR5 and MYC in B6 clone. (E) Decrease in ubiquitination of MYC-GFP immunoprecipitated protein upon knockout of UBR5 and FBXW7. Relative decrease in K48 ubiquitination was normalized to sgNT (1) and values are indicated on the bottom of the corresponding lane. (F) B6 clone was transfected with sgNT or sgUBR5 for 4 days and then further transfected with vector expressing mock DNA or UBR5 ORF, respectively to rescue the phenotype. GFP/mCHERRY was measured 72 h after transfection with rescue construct. (G) Ubiquitination assay utilizing UBR5(2463–2792) and peptide substrates MYC_174–196_KK (Fluo-SSLYLQDLSAAASECIDPSVVFPKK) and MYC_174–196 (SSLYLQDLSAAASECIDPSVVFP) resolved on a 5–20% SDS-PAGE gel. Fluorescein fluorophore was detected on a ChemiDoc System (Bio-Rad). (H) Ubiquitination assay utilizing UBR5(2463–2792) and the conservatively mutated peptide substrate MYC_174–196_KKMut (Fluo-SSLYLQDVTAAATDSLDPSVVFPKK), in which mutated residues are highlighted in bold. Samples were resolved on a 5–20% SDS-PAGE gel and fluorescence was detected on a ChemiDoc System (Bio-Rad).
Figure 5
Figure 5
Targeting UBR5 in cell lines with MYC amplification. (A) Cell viability analysis using cell titer glow assay in cell lines upon knockout of UBR5. Data are normalized to cells transfected with sgNT. (B) Western blot analysis showing knockout of UBR5 and stabilization of MYC in cell lines with or without MYC amplification. (C) Localization of UBR5 (8q22.3) and FBXO32 (8q24.13) in proximity to MYC (8q24.21) on Chromosome 8, unlike FBXW7 (4q31.3, not shown). (D) Correlation of cell line copy number (CN) estimates of UBR5, FBXO32, and FBXW7 show co-amplification of UBR5 and FBXO32 with MYC amplifications. (E) Transcript-level distributions (shown as kernel density estimates of log2 FPKM values) of UBR5, FBXO32, and FBXW7 in cell lines as a function of MYC copy number demonstrate distinct expression upregulation of UBR5. (F) Transcriptional correlation of MYC and UBR5 level across CCLE. (G) Transcriptional correlation of MYC and UBR5 level across TCGA. (H) Transcript-level distributions of MYC as a function of MYC copy number.

References

    1. Vogel C, Marcotte EM. Insights into the regulation of protein abundance from proteomic and transcriptomic analyses. Nat. Rev. Genet. 2012;13:227–232. doi: 10.1038/nrg3185. - DOI - PMC - PubMed
    1. Varshavsky A. The ubiquitin system, autophagy, and regulated protein degradation. Annu. Rev. Biochem. 2017;86:123–128. doi: 10.1146/annurev-biochem-061516-044859. - DOI - PubMed
    1. Westermarck J. Regulation of transcription factor function by targeted protein degradation: an overview focusing on p53, c-Myc, and c-Jun. Methods Mol. Biol. 2010;647:31–36. doi: 10.1007/978-1-60761-738-9_2. - DOI - PubMed
    1. Lee TI, Young RA. Transcriptional regulation and its misregulation in disease. Cell. 2013;152:1237–1251. doi: 10.1016/j.cell.2013.02.014. - DOI - PMC - PubMed
    1. Bushweller JH. Targeting transcription factors in cancer—from undruggable to reality. Nat. Rev. Cancer. 2019;19:611–624. doi: 10.1038/s41568-019-0196-7. - DOI - PMC - PubMed