. 2021 Jan;40(3):618-632.
doi: 10.1038/s41388-020-01554-y. Epub 2020 Nov 18.

BAP1 mutant uveal melanoma is stratified by metabolic phenotypes with distinct vulnerability to metabolic inhibitors

Affiliations

BAP1 mutant uveal melanoma is stratified by metabolic phenotypes with distinct vulnerability to metabolic inhibitors

Anna Han et al. Oncogene. 2021 Jan.

Erratum in

Abstract

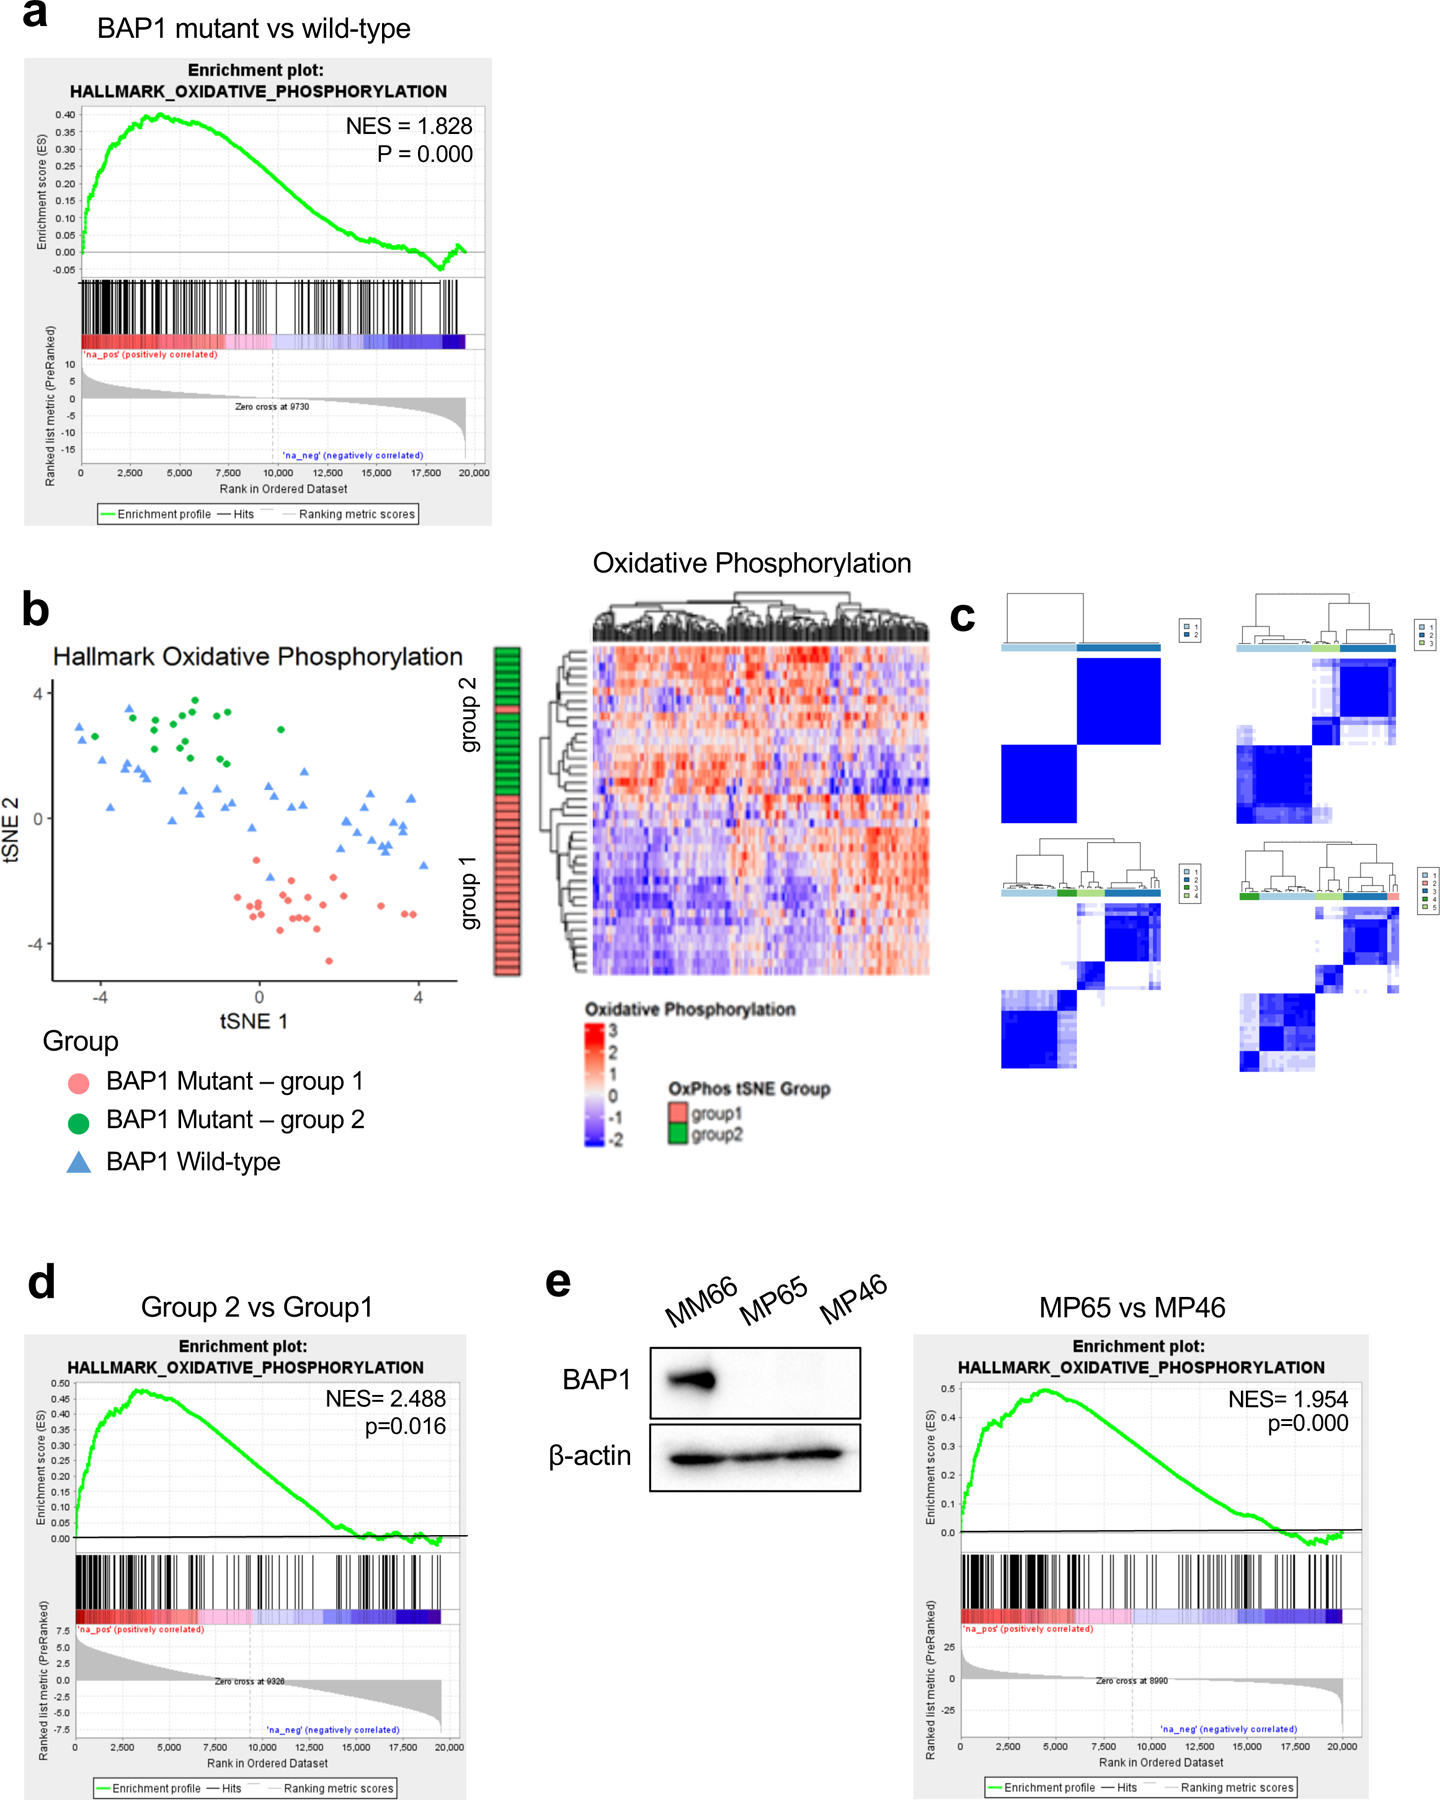
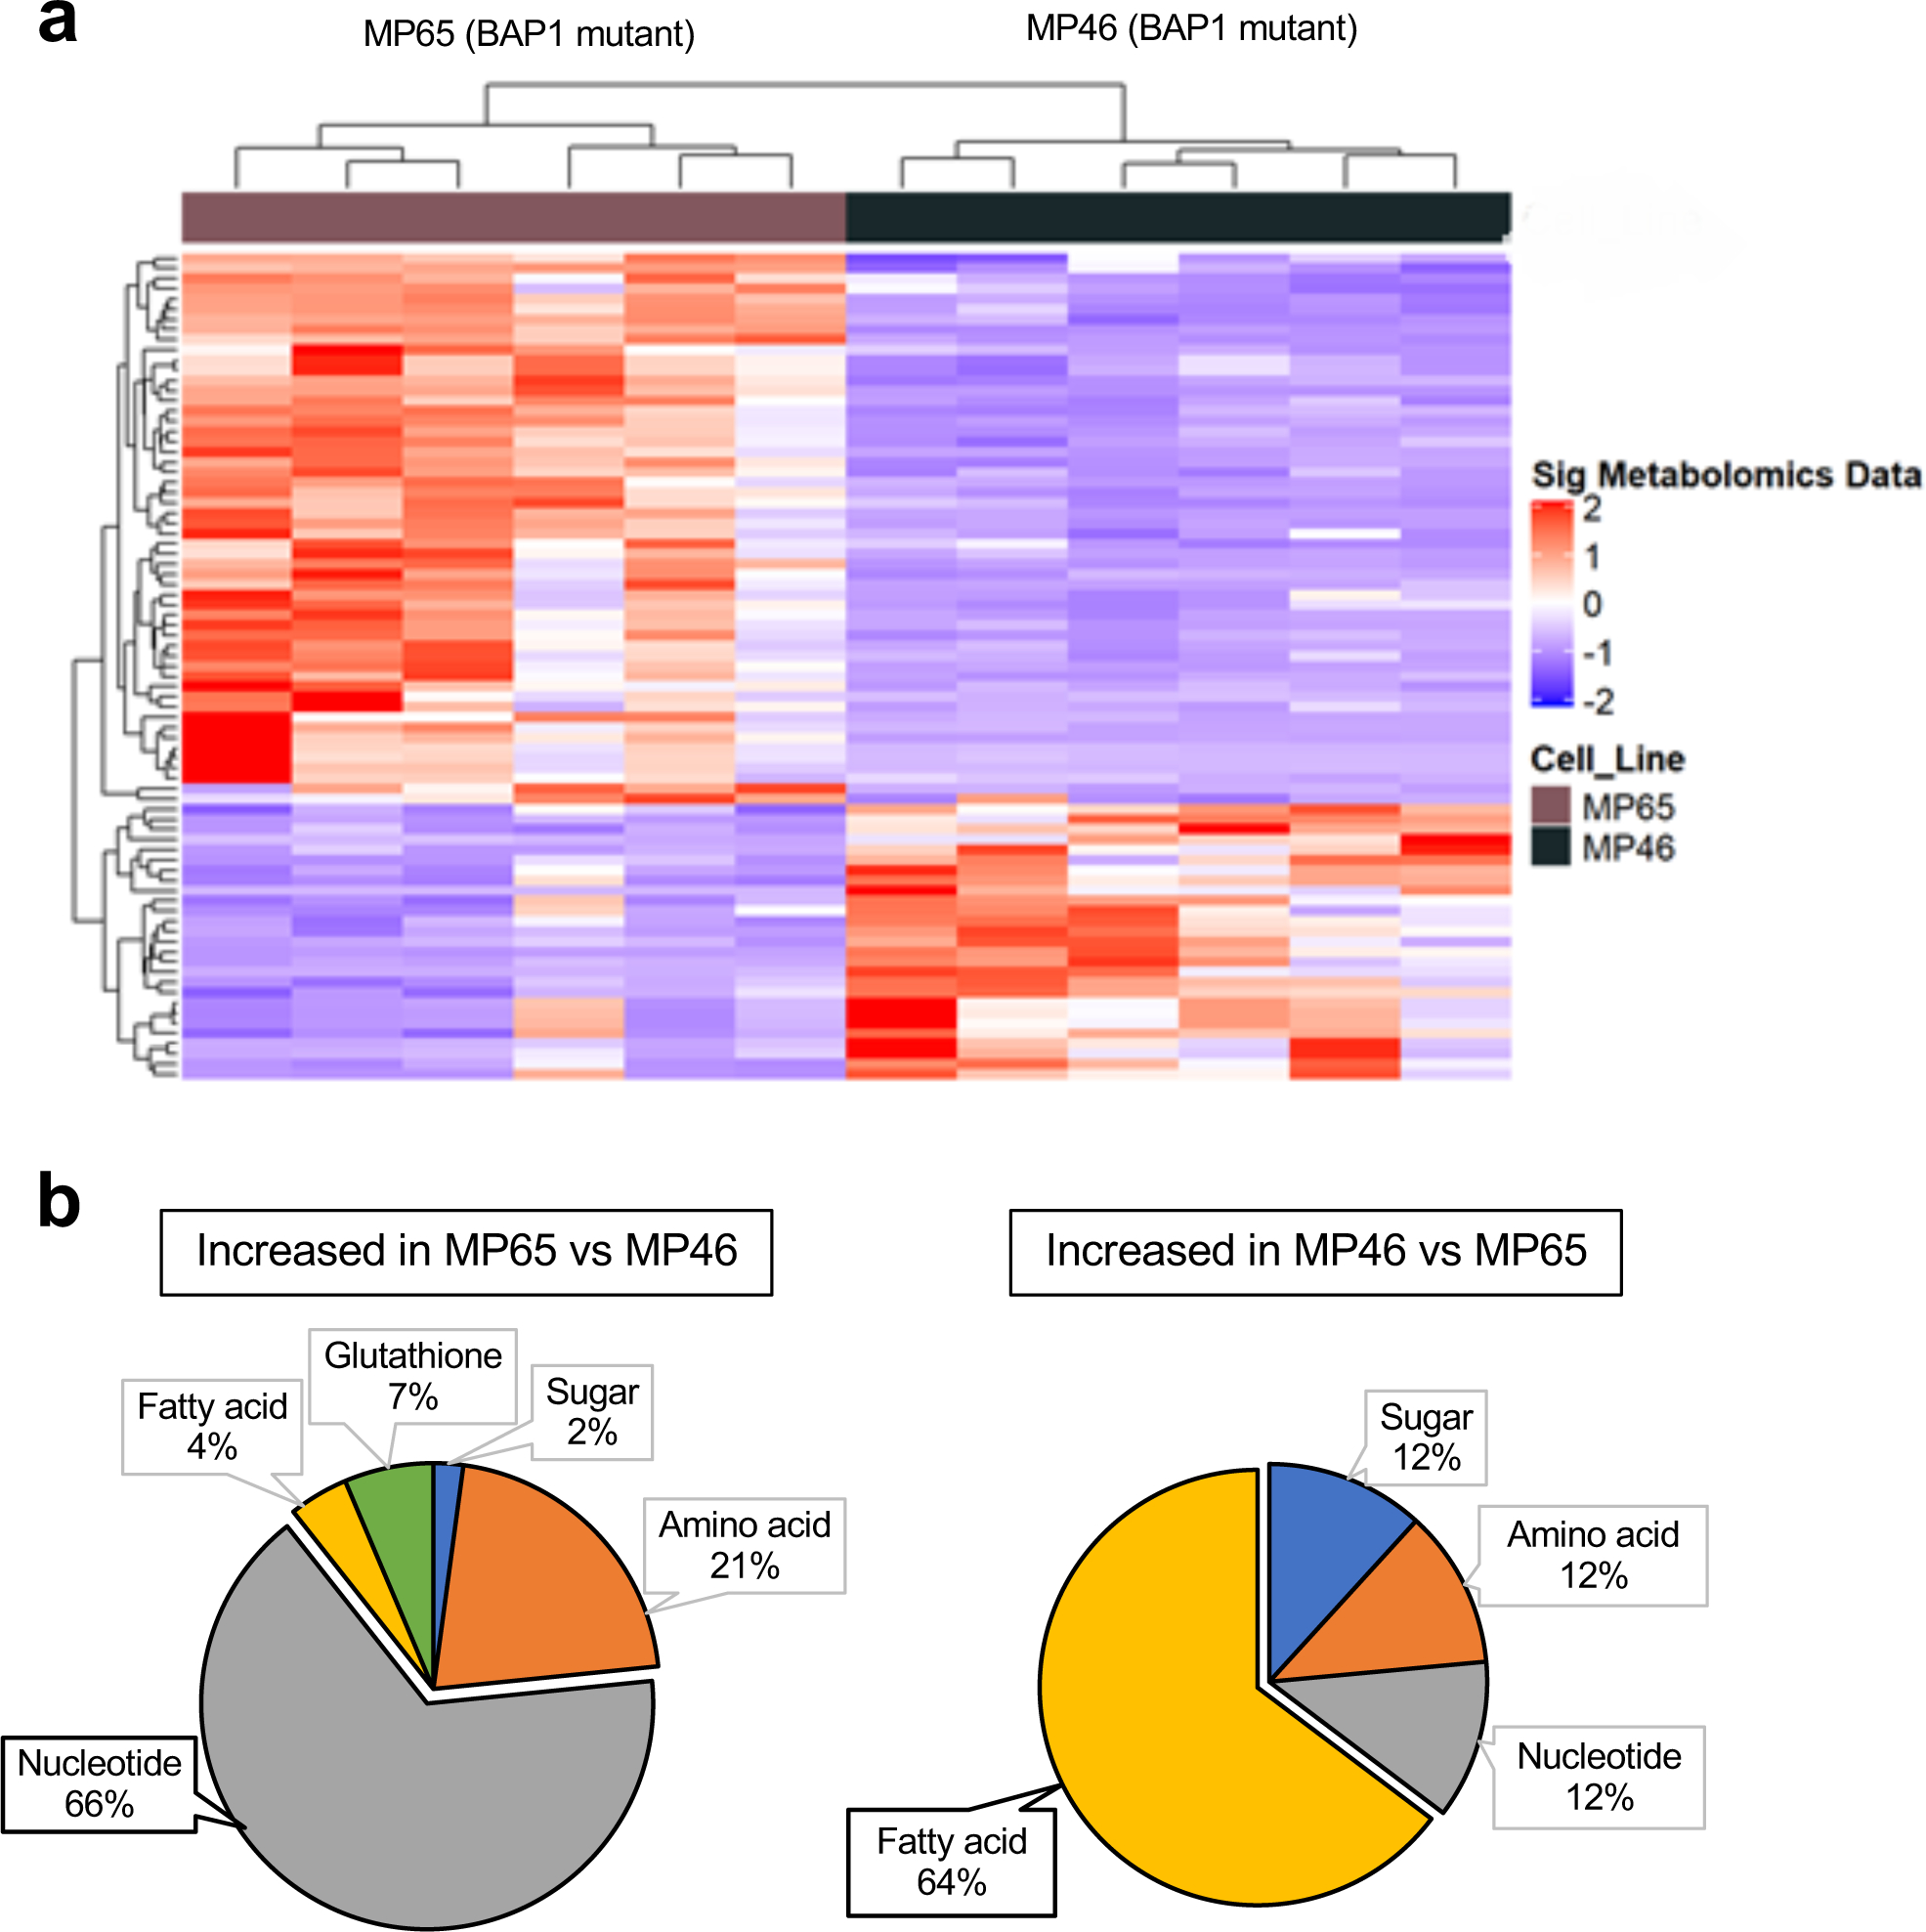
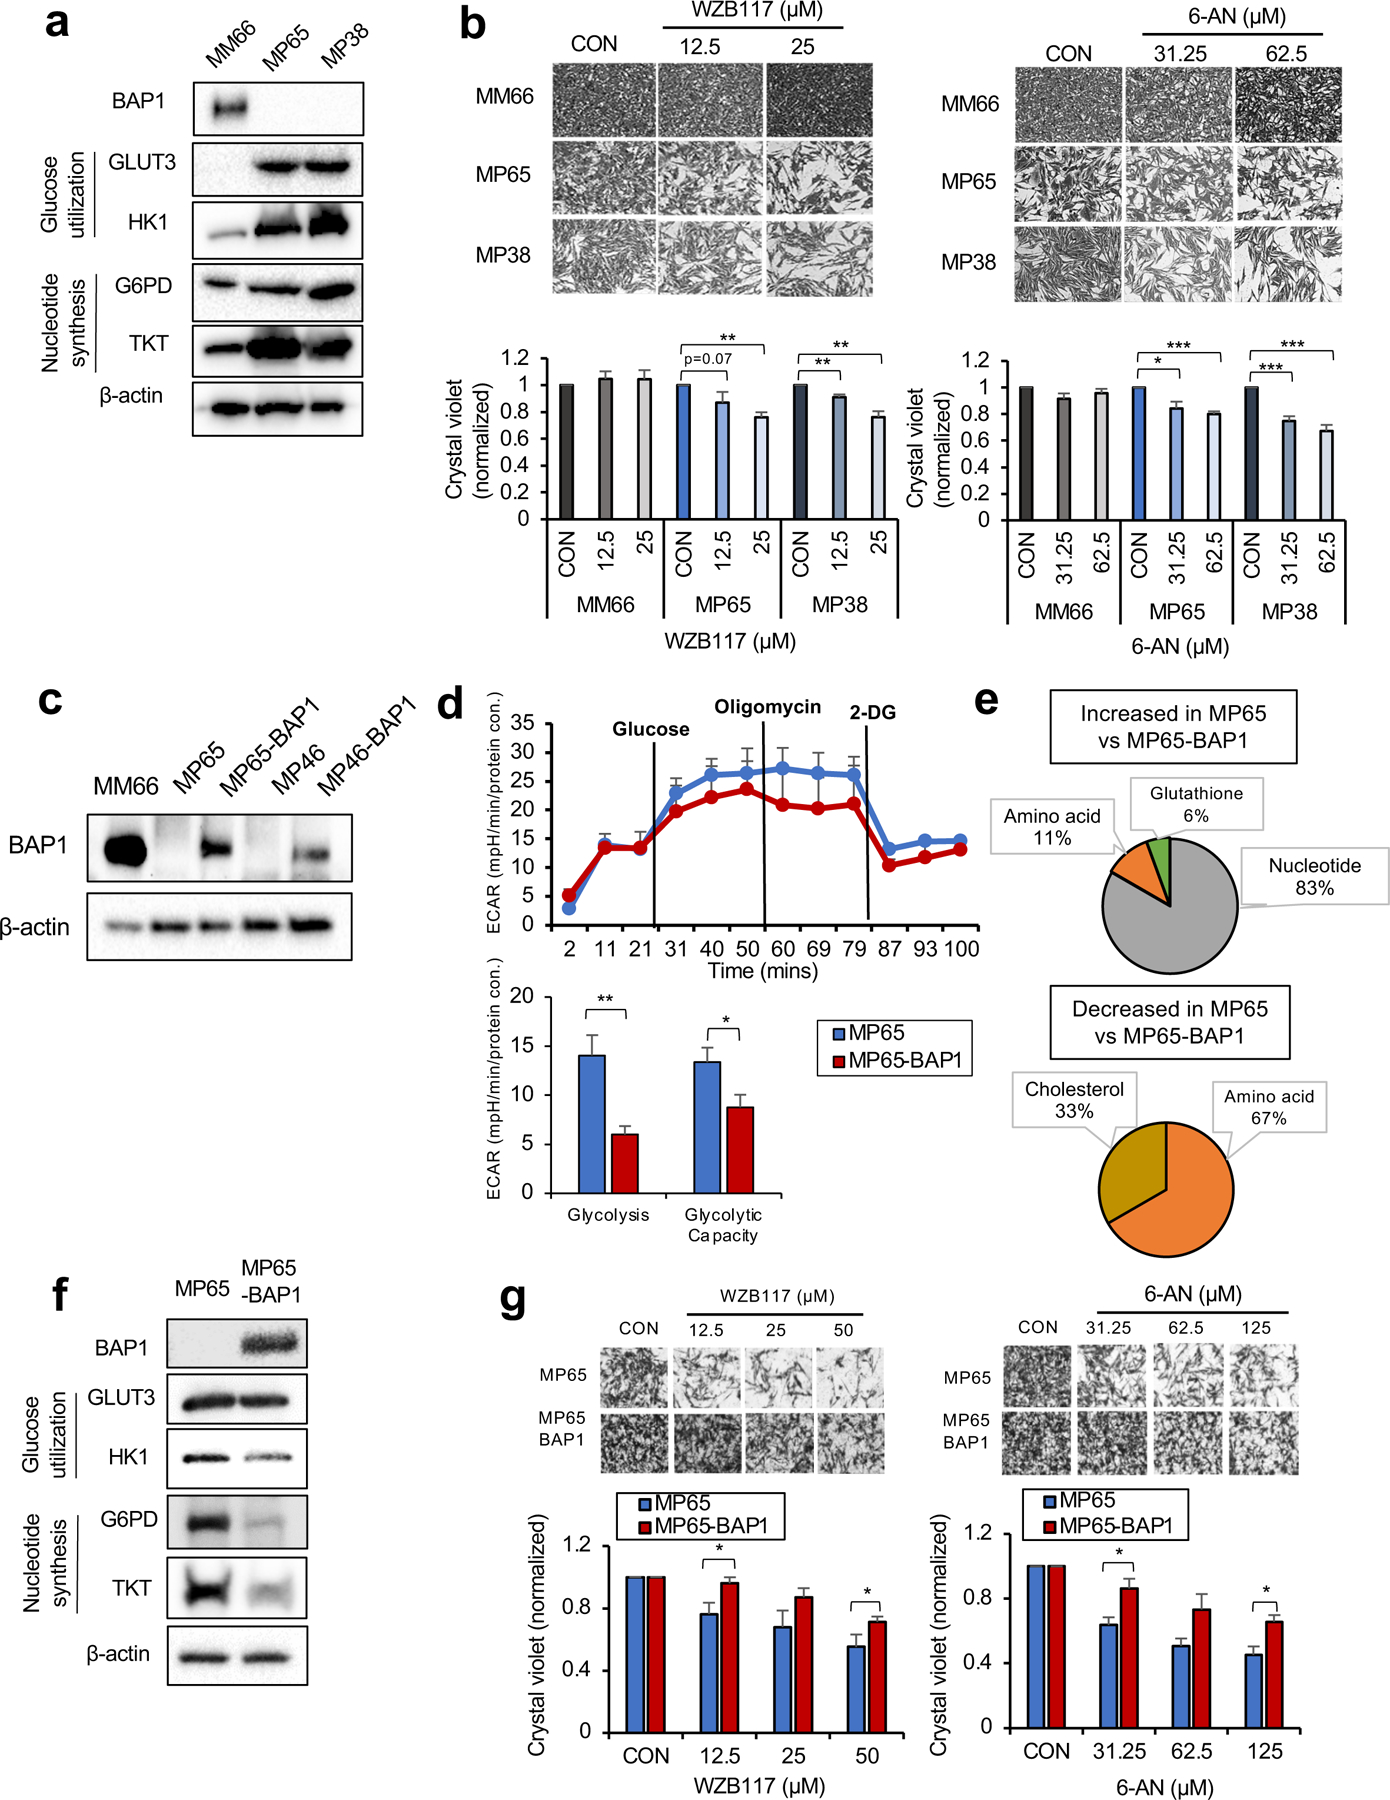
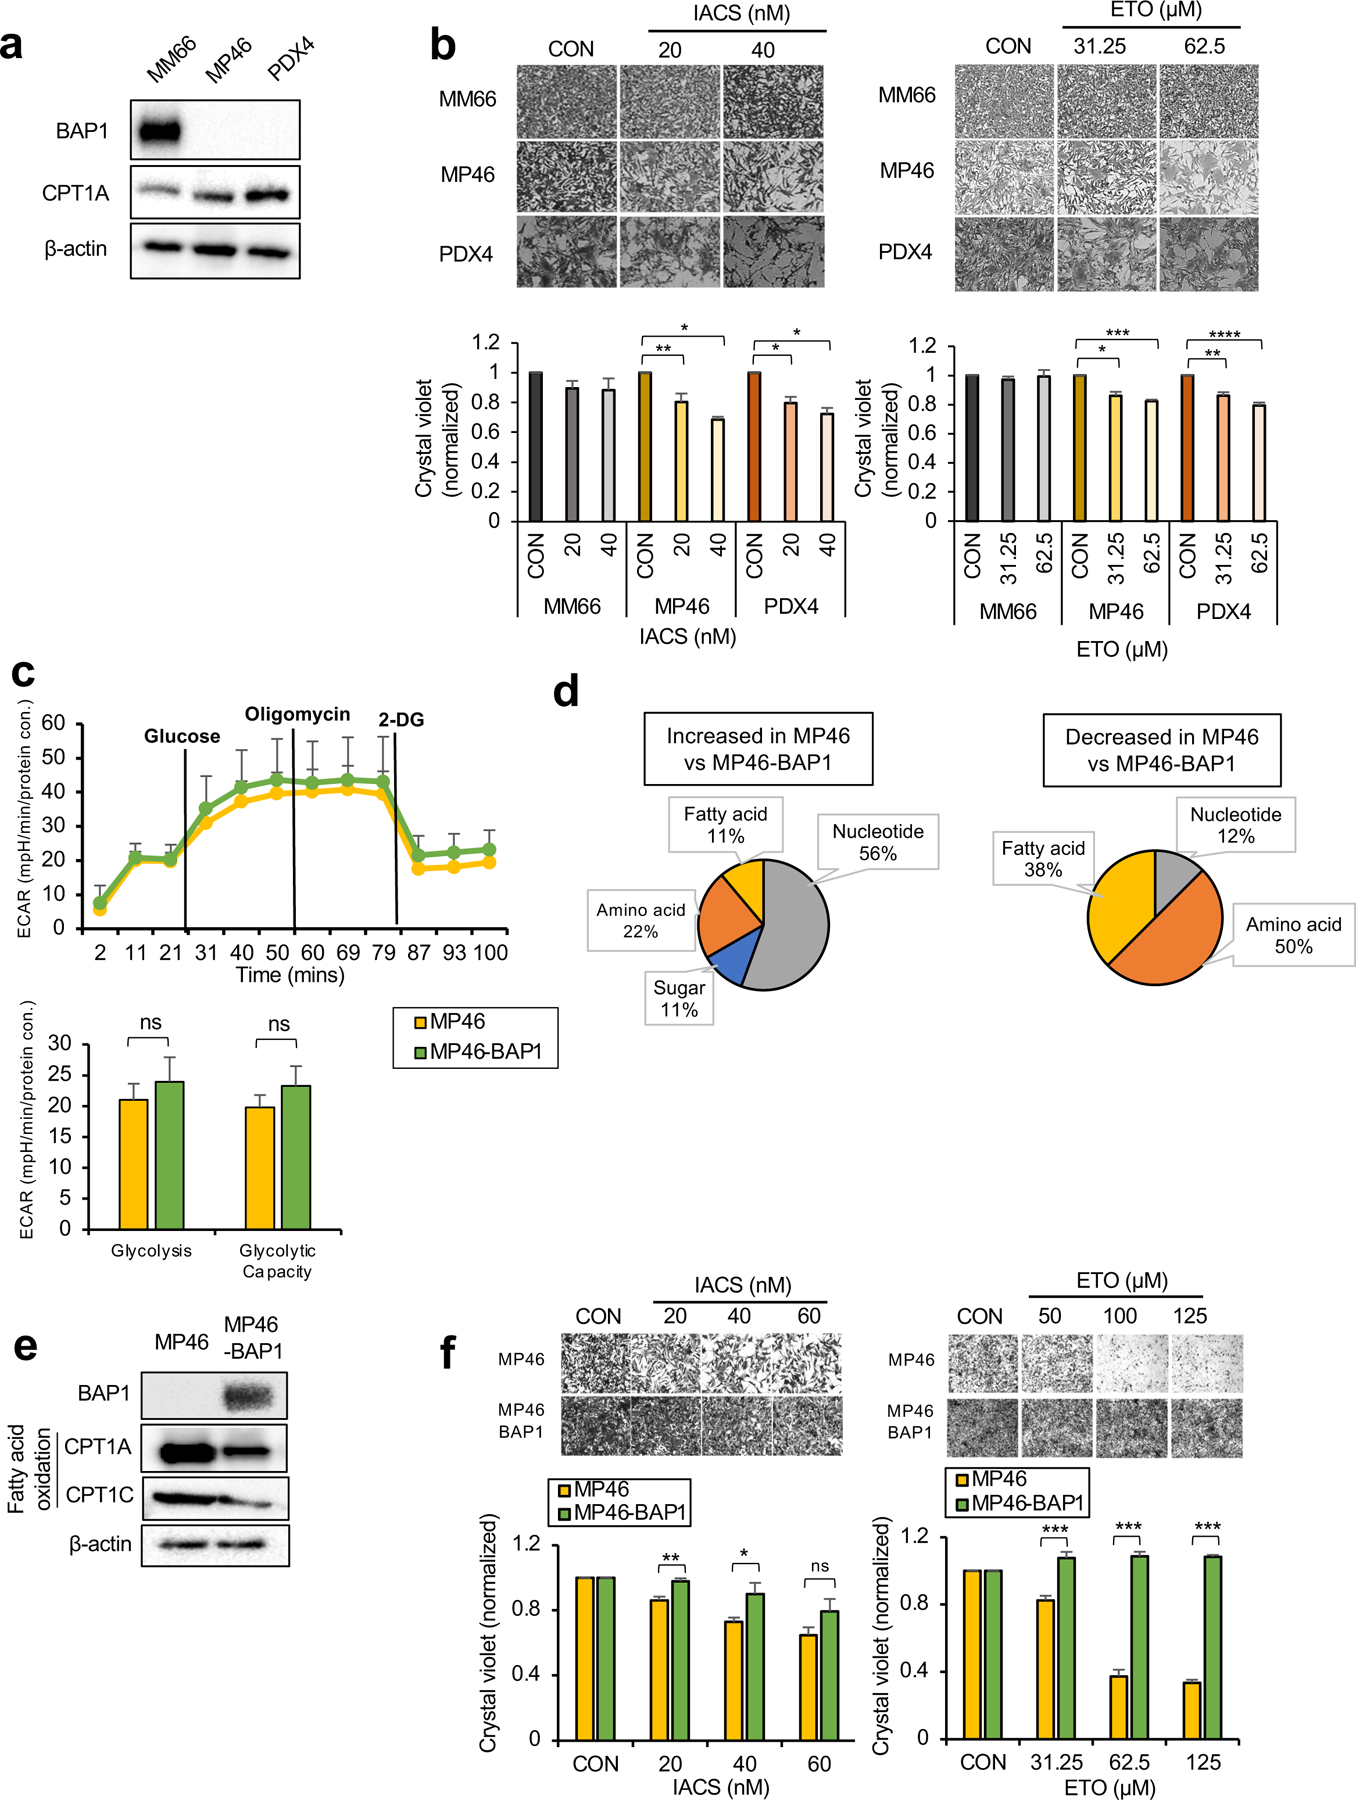
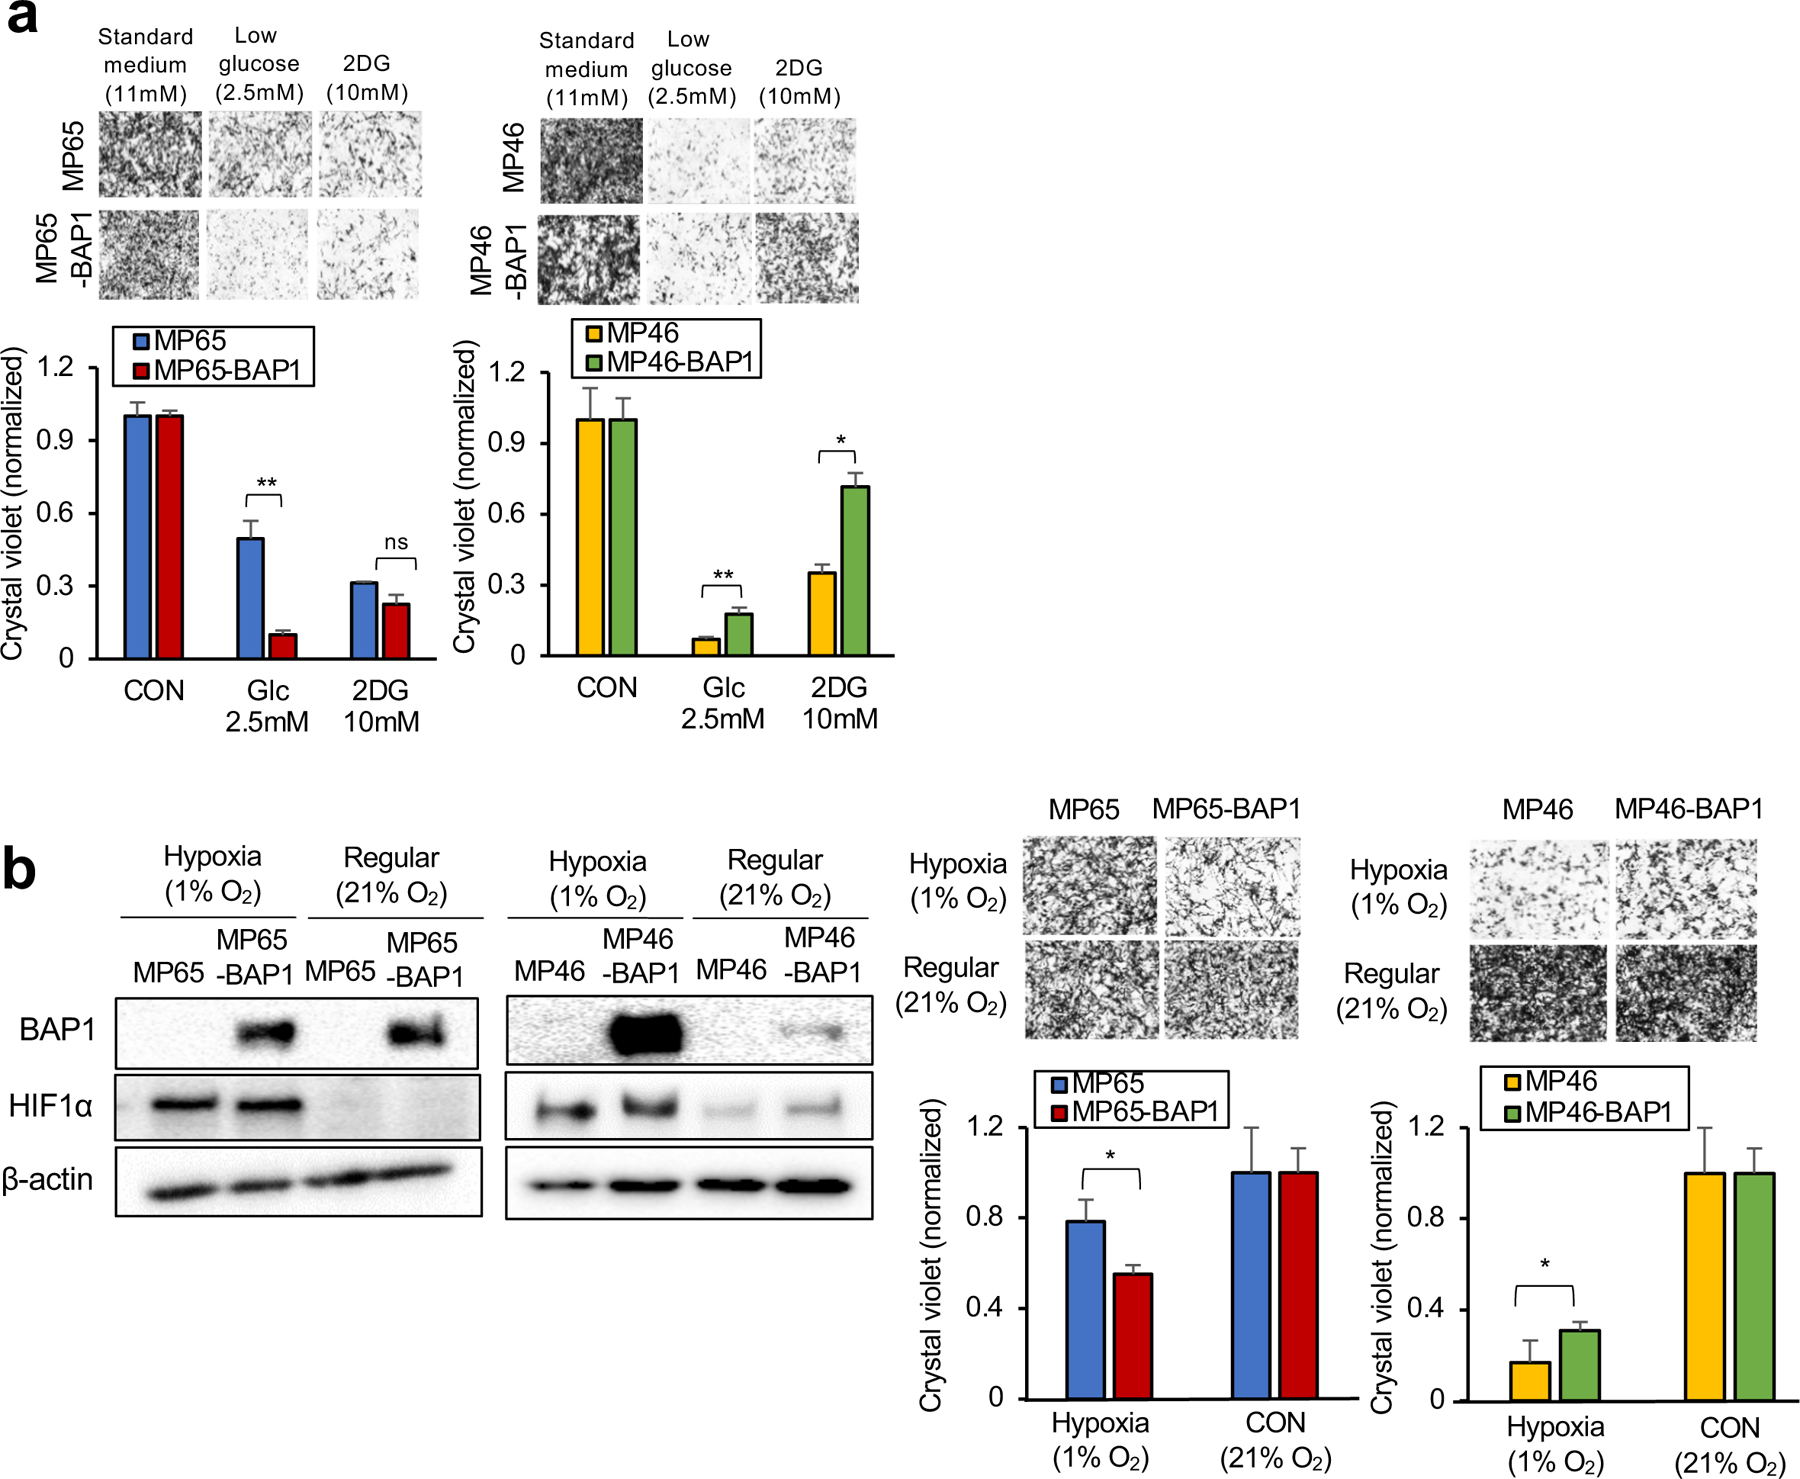
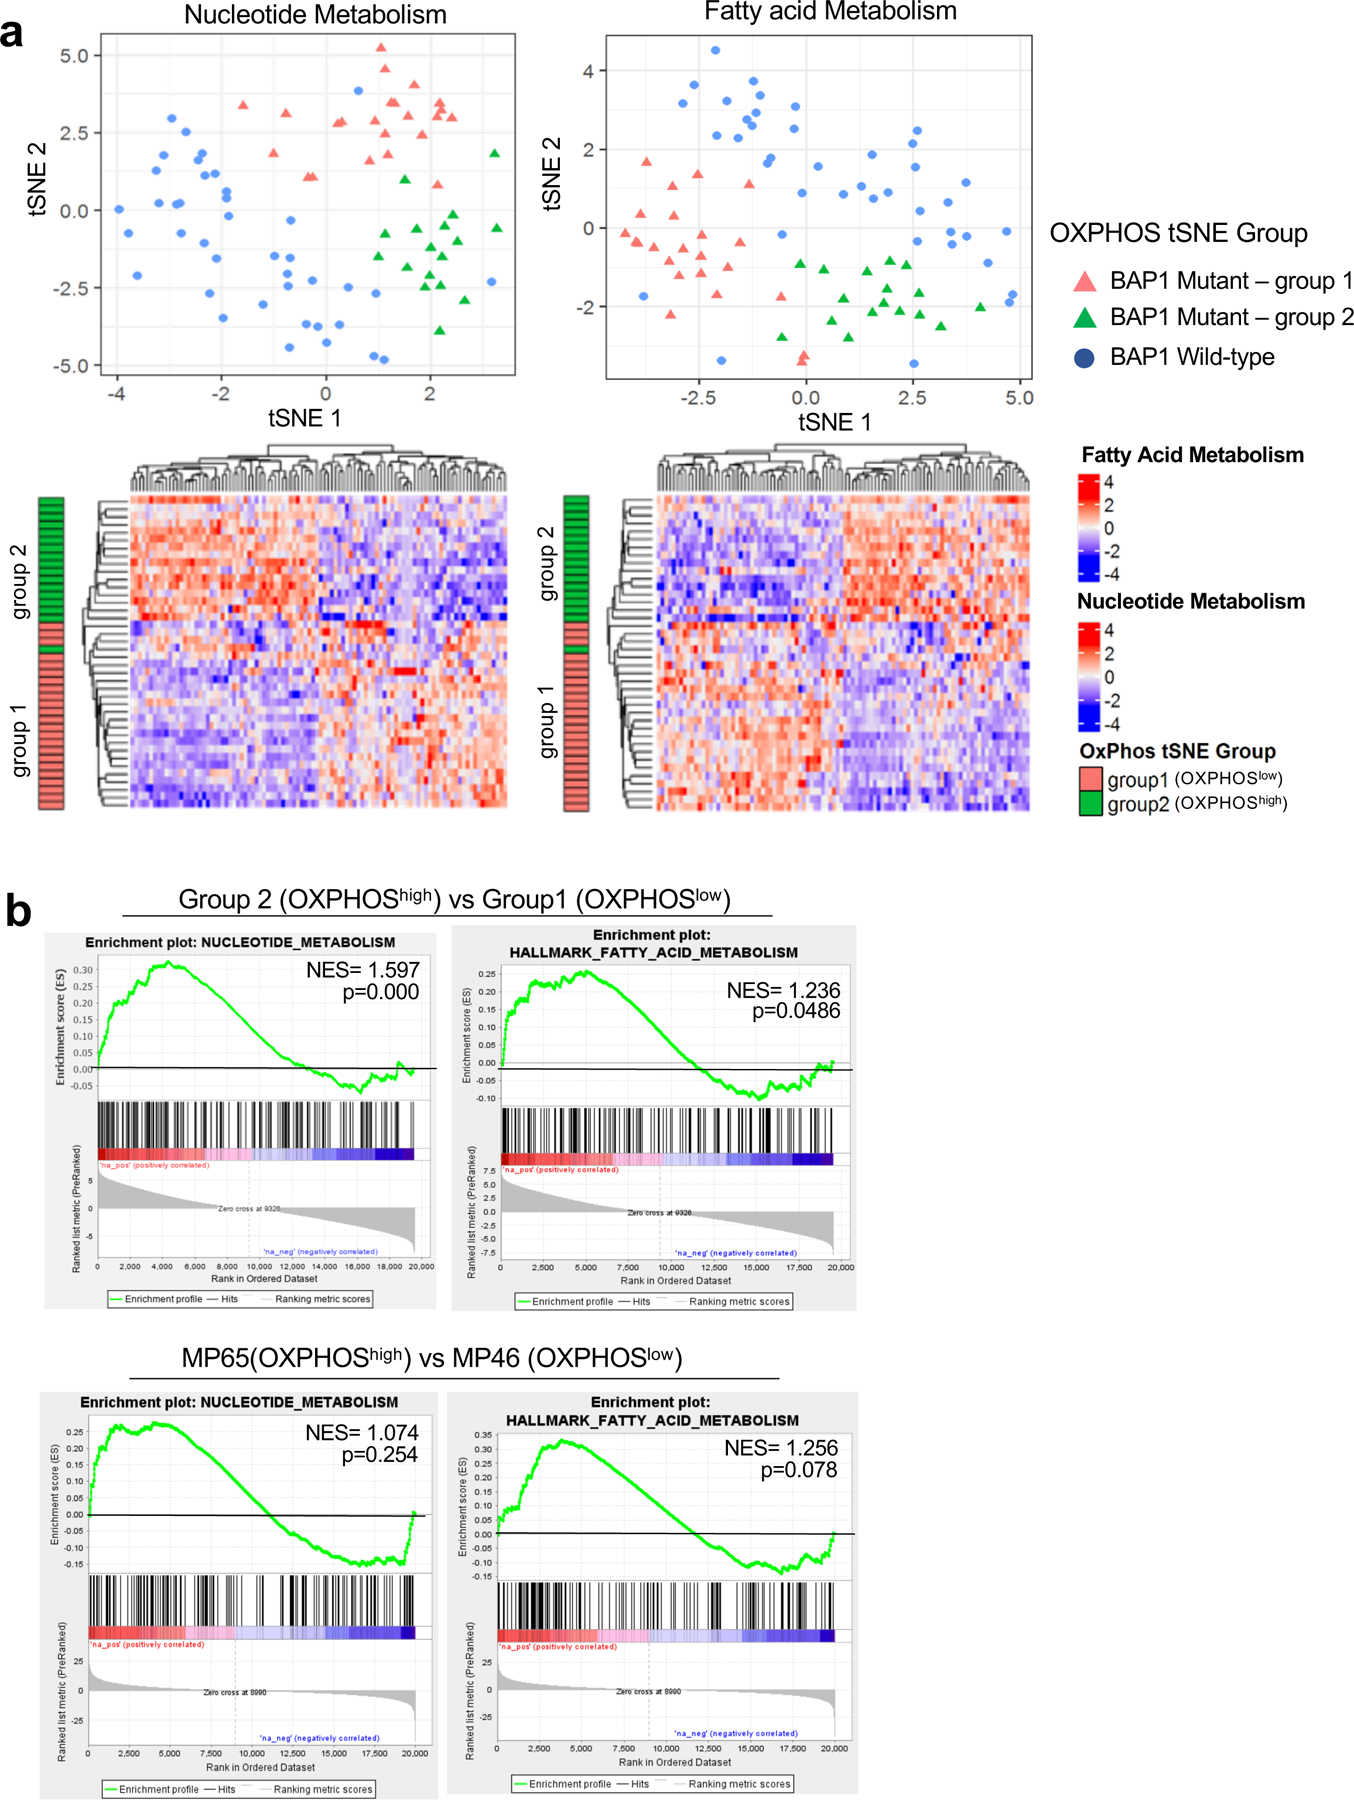
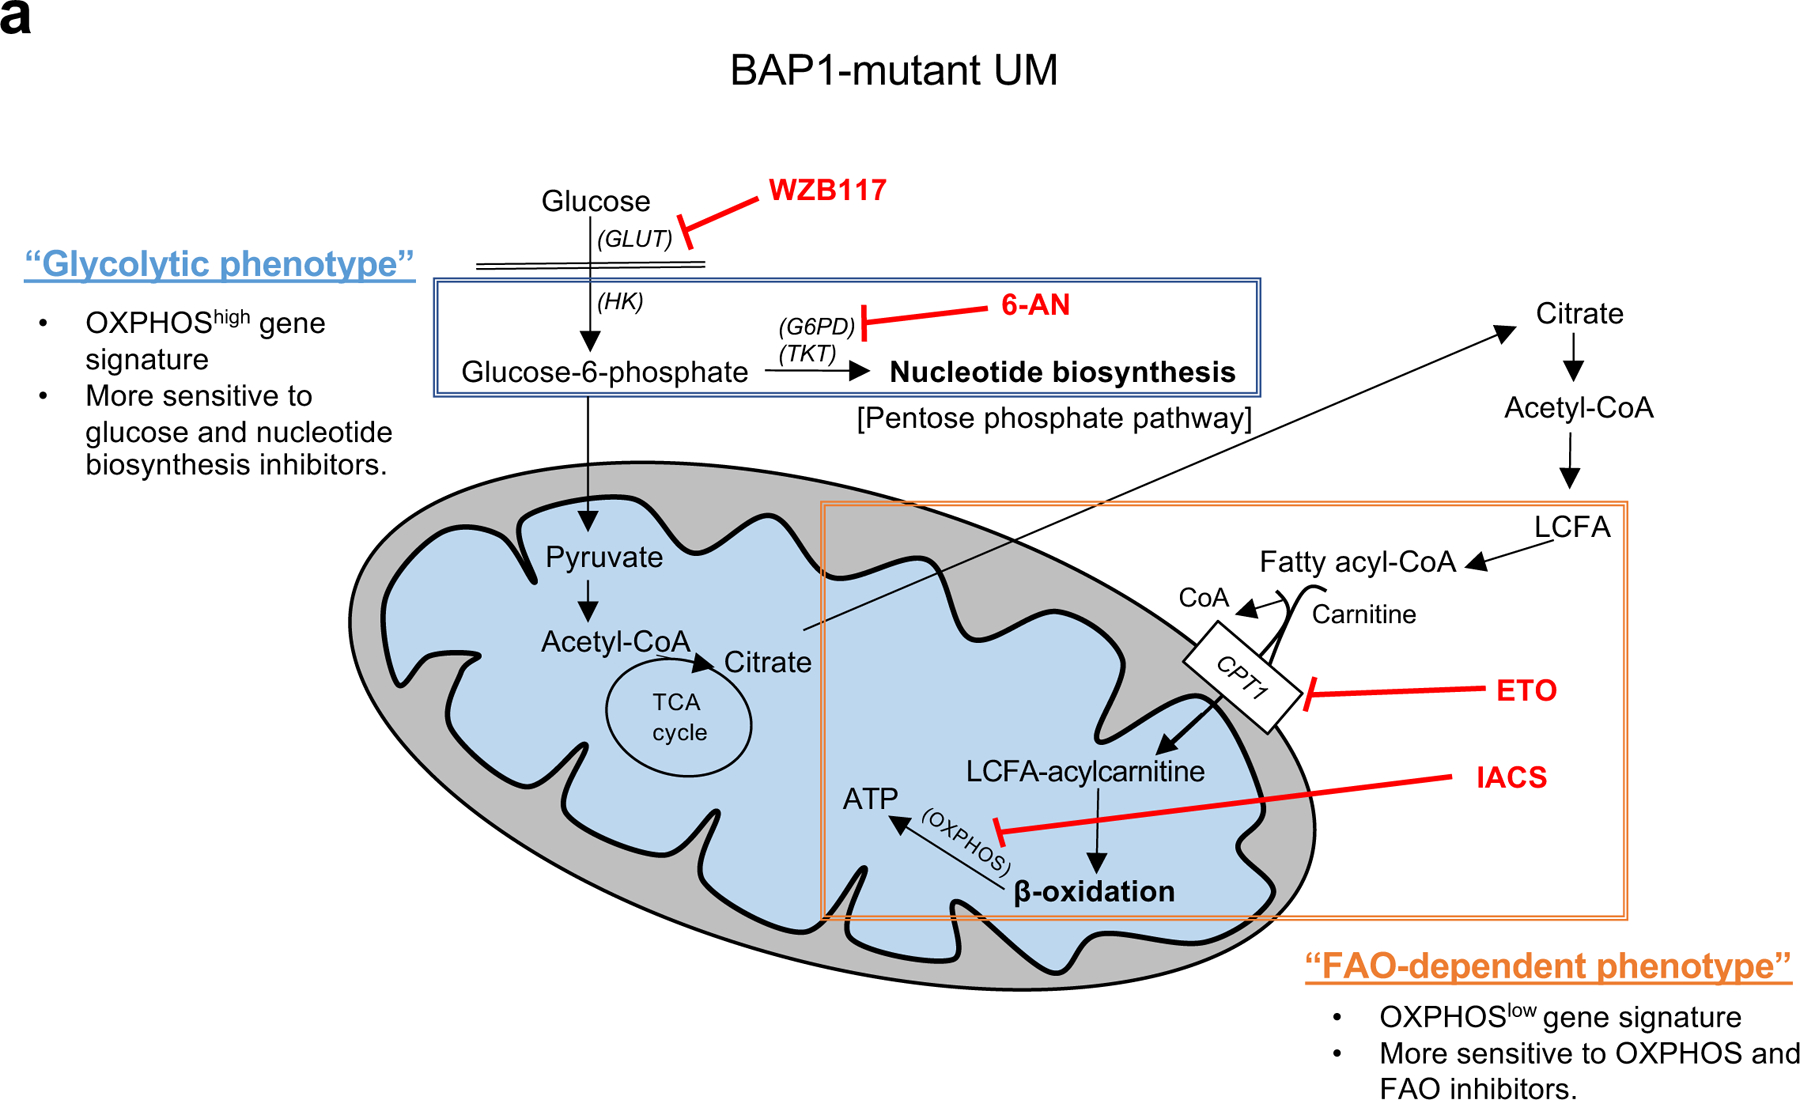
Cancer cell metabolism is a targetable vulnerability; however, a precise understanding of metabolic heterogeneity is required. Inactivating mutations in BRCA1-associated protein 1 (BAP1) are associated with metastasis in uveal melanoma (UM), the deadliest adult eye cancer. BAP1 functions in UM remain unclear. UM patient sample analysis divided BAP1 mutant UM tumors into two subgroups based on oxidative phosphorylation (OXPHOS) gene expression suggesting metabolic heterogeneity. Consistent with patient data, transcriptomic analysis of BAP1 mutant UM cell lines also showed OXPHOShigh or OXPHOSlow subgroups. Integrated RNA sequencing, metabolomics, and molecular analyses showed that OXPHOShigh BAP1 mutant UM cells utilize glycolytic and nucleotide biosynthesis pathways, whereas OXPHOSlow BAP1 mutant UM cells employ fatty acid oxidation. Furthermore, the two subgroups responded to different classes of metabolic suppressors. Our findings indicate that targeting cancer metabolism is a promising therapeutic option for BAP1 mutant UM; however, tailored approaches may be required due to metabolic heterogeneities.


Conflict of interest statement

Declaration of Interests:

A.E. Aplin reports receiving a commercial research grant from Pfizer Inc. (2013–2017) and has ownership interest in patent number 9880150. No potential conflicts of interest are disclosed by the other authors. J.W. Harbour is the inventor of intellectual property related to prognostic testing for uveal melanoma. He is a paid consultant for Castle Biosciences, licensee of this intellectual property, and he receives royalties from its commercialization.

Figures

Fig 1.
Fig 1.. BAP1 mutant UM samples are divided into two distinct metabolic subpopulations based on OXPHOS gene set.
UVM RNA-seq V2 gene expression data from TCGA were retrieved from the latest Broad GDAC Firehose data run (stddata_2016_01_28). Based on BAP1 mutation and copy loss, samples were stratified into BAP1 mutant and wild-type groups. Differential expression analysis was performed between BAP1 mutant (n=40) and wild-type (n=40) and used for performing GSEA. a. GSEA enrichment plots of the OXPHOS hallmark gene set for comparison in BAP1 mutant vs wild-type group. b. tSNE plot of BAP1 mutant samples grouped into two subgroups (group 1 and group 2) and BAP1 wild-type samples based on OXPHOS genes. Heatmaps of OXPHOS gene expression from the RNA-seq data for BAP1 mutant samples with group indexing based on tSNE clustering Fig. 1b. c. Sample-group similarity matrices from consensus cluster plus k-means clustering analysis of BAP1 mutant UM samples, with the number of groups ranging from 2 to 5. d. GSEA enrichment plot of the top-ranked OXPHOS hallmark gene set for comparison in group 2 vs group 1. e. Protein expression of BAP1 in BAP1 wild-type (MM66) and two BAP1 mutant (MP65 and MP46) UM cell lines was analyzed by western blot. GSEA enrichment plot of the top-ranked OXPHOS hallmark gene set for comparison in MP65 vs MP46 cells.
Fig 2.
Fig 2.. BAP1 status alters the metabolic pathways in UM cells.
a. Heatmap showing z-scores for significantly different levels of metabolites (FC >2, adj. p-val. < 0.05) between two BAP1 mutant cell lines, MP65 and MP46. Unsupervised hierarchical clustering of samples and metabolites is shown. b. Percentage distributions of upregulated metabolites in MP65 or MP46 cells. Metabolites were categorized with specific metabolic pathways (FC >2, adj. p-val. < 0.05). Metabolite data were analyzed from whole cell extractions (n=6).
Fig 3.
Fig 3.. OXPHOShigh BAP1 mutant phenotype is linked to increased glycolytic-nucleotide biosynthetic pathway.
a. Protein expression of BAP1 and metabolic enzymes involved in glucose utilization and nucleotide synthesis in MM66, MP65 and MP38 cells. b. MM66, MP65 and MP38 cells were treated with WZB117 (12.5 or 25 μM) or 6-aminonicotinamide (6-AN, 31.25 or 62.5 μM) for 3 days. Cell viability changes were determined by crystal violet staining. Quantification of cell growth with WZB117 and 6-AN treatments in MM66, MP65 and MP38 cells presented as fold change in crystal violet staining of colonies. Representative crystal violet images of cell growth are shown. Scale bar: 100 μm. c. Re-expression of BAP1 in UM mutant cell clines, MP65 and MP46, was confirmed by western blot. MM66 serves as a positive control for BAP1 expression. d. The effect of BAP1 re-expression on the glycolytic capacity of MP65 cells was measured by ECAR using the Seahorse XF24 analyzer. Seahorse data were normalized to protein concentration and analyzed by Agilent Seahorse XF report generators. Data are shown as mean ± SEM (n=12). e. Metabolite percentage distributions within specific metabolic pathways that are increased or decreased in MP65 compared to MP65-BAP1 cells (FC >2, adj. p-val. < 0.05). f. Protein expression of metabolic enzymes involved in glucose utilization and nucleotide synthesis in MP65 and MP65-BAP1 cells. g. MP65 and MP65-BAP1 cells were treated with WZB117 (12.5, 25 or 50 μM) or 6-aminonicotinamide (6-AN, 31.25, 62.5 or 125 μM) for 5 days. Cell viability changes were determined by crystal violet staining. Quantification of cell growth with WZB117 and 6-AN treatments in MP65 and MP65-BAP1 cells presented as fold changes in crystal violet stain. Data are shown as mean ± SEM from biological replicate experiments (n=4). *p<0.05 and **p<0.01 unpaired t-test. ECAR; extracellular acidification rate, GLUT; glucose transporter, HK; hexokinase, G6PD; glucose-6-phosphate dehydrogenase and TKT; transketolase.
Fig 4.
Fig 4.. OXPHOSlow BAP1 mutant phenotype is associated with an elevated FA oxidation pathway.
a. Protein expression of BAP1 and metabolic enzymes involved in FAO in MM66, MP46 and PDX4 cells. b. MM66, MP46 and PDX4 cells were treated with IACS (20 or 40 nM) or etomoxir (ETO, 31.25 or 62.5 μM) for 3 days. Cell viability changes were determined by crystal violet staining. Quantification of cell growth with IACS or ETO treatments in cells presented as fold change in crystal violet staining. Representative crystal violet images of cell growth are shown. Scale bar represents 100 μm. c. Effects of BAP1 re-expression on the glycolytic capacity of MP46 cells was measured by ECAR using the Seahorse XF24 Analyzer. Seahorse data were normalized to protein concentration and generated by Agilent Seahorse XF report generators. Data are shown as mean ± SEM (n=12). d. Metabolite percentage distribution within specific metabolic pathways that are upregulated or down-regulated in MP46 compared to MP46-BAP1 cells (FC >2, adj. p-val. < 0.05). e. Protein expression of metabolic enzymes involved in FA synthesis and oxidation in MP46 and MP46-BAP1 cells. f. MP46 and MP46-BAP1 cells were treated with IACS (20, 40 or 60 nM) or etomoxir (ETO, 31.25, 62.5 or 125 μM) for 5 days. Cell viability changes were determined by crystal violet staining. Quantification of cell growth with IACS and ETO treatments in cells presented as fold change in crystal violet staining. Data are shown as mean ± SEM from biological replicate experiments (n=4). *p<0.05, **p<0.01, ***p<0.001 and not significant (ns) unpaired t-test. ECAR; extracellular acidification rate, CPT1; carnitine palmitoyltransferase1, 2DG; 2-deoxyglucose and PHX; perhexiline.
Fig 5.
Fig 5.. The two metabolic phenotypes respond differently to metabolic stress.
MP65, MP65-BAP1, MP46 and MP46-BAP1 cells were exposed to metabolic stress; glucose deprivation for 3 days or hypoxic conditions for 5 days. a. Cells were cultured in regular growth medium (11 mM glucose), medium with low glucose (2.5 mM) or medium containing 2-DG (10 mM) for 3 days. b. For 5 days, the cells were under either hypoxic (1% O2) or normoxic (21% O2) conditions. As a marker of hypoxia, expression of HIF1α was probed on day 3 by western blotting. Cell viability changes were measured by crystal violet staining. Representative crystal violet images of cell growth are shown. Scale bar: 100 μm. Data are shown as mean ± SEM from biological replicate experiments (n=4). The unpaired t-test was used for statistical significance. *p<0.0, **p<0.01 and not significant (ns).
Fig 6.
Fig 6.. Nucleotide and FA metabolism gene expression separate BAP1 mutant samples into two distinct subgroups.
UM RNA-seq V2 gene expression data from the TCGA were retrieved from the latest Broad GDAC Firehose data run (stddata__2016_01_28). The samples were stratified into BAP1 mutant and wild-type groups based on BAP1 mutation and copy loss. Differential expression analysis was performed between BAP1 mutant (n=40) and wild-type (n=40). a. tSNE plot presenting BAP1 mutant samples with two subgroups (group 1 and group 2) and BAP1 wild-type samples based on nucleotide metabolism (left) and FA metabolism (right) genes. Below, heatmaps showing unsupervised hierarchical clustering of z-scores for each gene set in BAP1 mutant samples with group indexing based on OXPHOS clustering analysis in Fig. 1. b. GSEA plots of the nucleotide and FA metabolism gene set for comparison of group 2 vs group 1 in BAP1 mutant UM data from TCGA, and two BAP1 mutant cells, MP65 vs MP46.
Fig 7.
Fig 7.. Two distinct metabolic phenotypes in BAP1 mutant UM.
Summary figure showing two different metabolic phenotypes in BAP1 mutant UM. The glycolytic phenotype has a high OXPHOS gene signature and primarily relies on glucose utilization, which can upregulate oxidative PPP. This phenotype is specifically sensitive to glycolysis or nucleotide synthesis inhibitors. The second subtype has low OXPHOS gene expression and is more dependent on FAO. This subtype is vulnerable to either OXPHOS or FAO-specific inhibitors. FA; fatty acid, GLUT; glucose transporter, HK; hexokinase, G6PD; glucose-6-phosphate dehydrogenase, TKT; transketolase, LCFA; long chain fatty acid, CPT1; carnitine palmitoyltransferase1, 6-AN; 6-aminonicotinamide and ETO; etomoxir.

References

    1. Pacella I, Procaccini C, Focaccetti C, Miacci S, Timperi E, Faicchia D, et al. Fatty acid metabolism complements glycolysis in the selective regulatory T cell expansion during tumor growth. PNAS. 2018;115(28):E6546–E55. - PMC - PubMed
    1. Phan LM, Yeung S-CJ, Lee M-H. Cancer metabolic reprogramming: importance, main features, and potentials for precise targeted anti-cancer therapies. Cancer biology & medicine. 2014;11(1):1. - PMC - PubMed
    1. DeBerardinis RJ, Chandel NS. Fundamentals of cancer metabolism. Sci Adv. 2016;2(5):e1600200. - PMC - PubMed
    1. Jones NP, Schulze A. Targeting cancer metabolism–aiming at a tumour’s sweet-spot. Drug Discov Today. 2012;17(5–6):232–41. - PubMed
    1. Stine ZE, Walton ZE, Altman BJ, Hsieh AL, Dang CV. MYC, metabolism, and cancer. Cancer Discov. 2015;5(10):1024–39. - PMC - PubMed

Publication types