. 2020 Dec;588(7837):308-314.
doi: 10.1038/s41586-020-2915-3. Epub 2020 Nov 18.

LDLRAD3 is a receptor for Venezuelan equine encephalitis virus

Affiliations

LDLRAD3 is a receptor for Venezuelan equine encephalitis virus

Hongming Ma et al. Nature. 2020 Dec.

Abstract

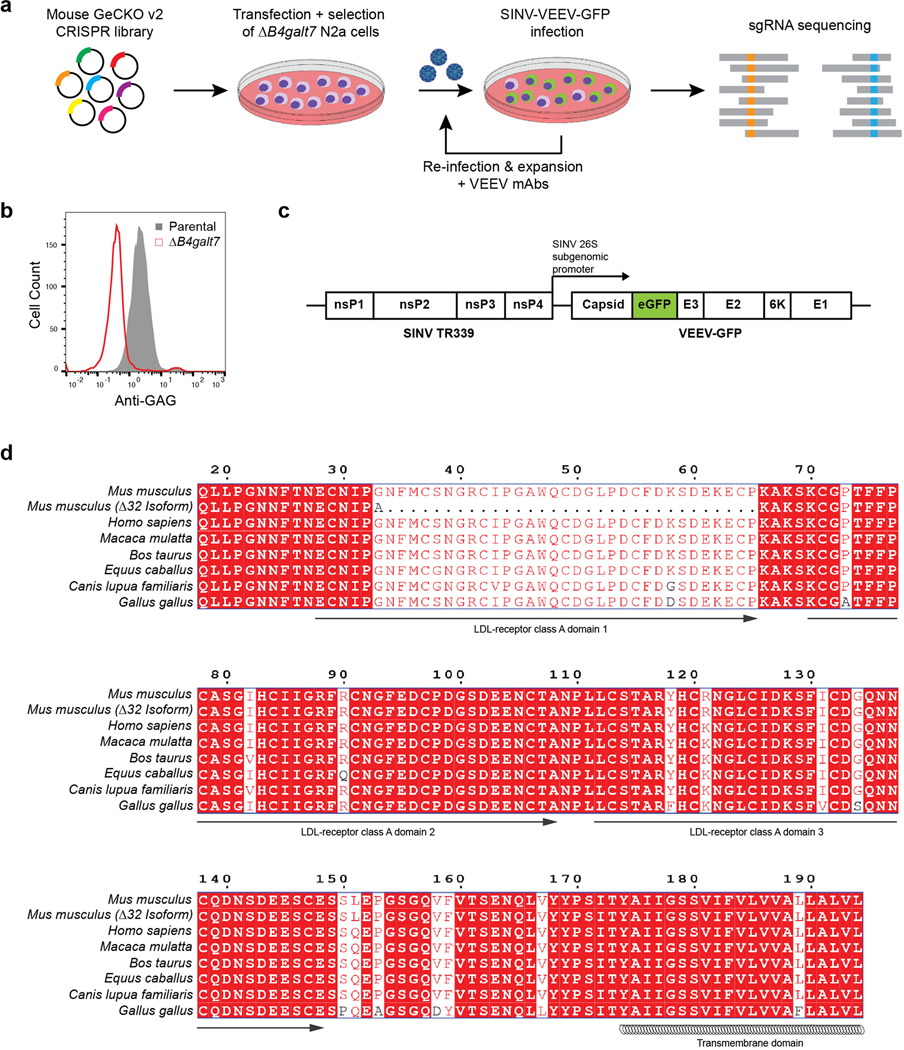
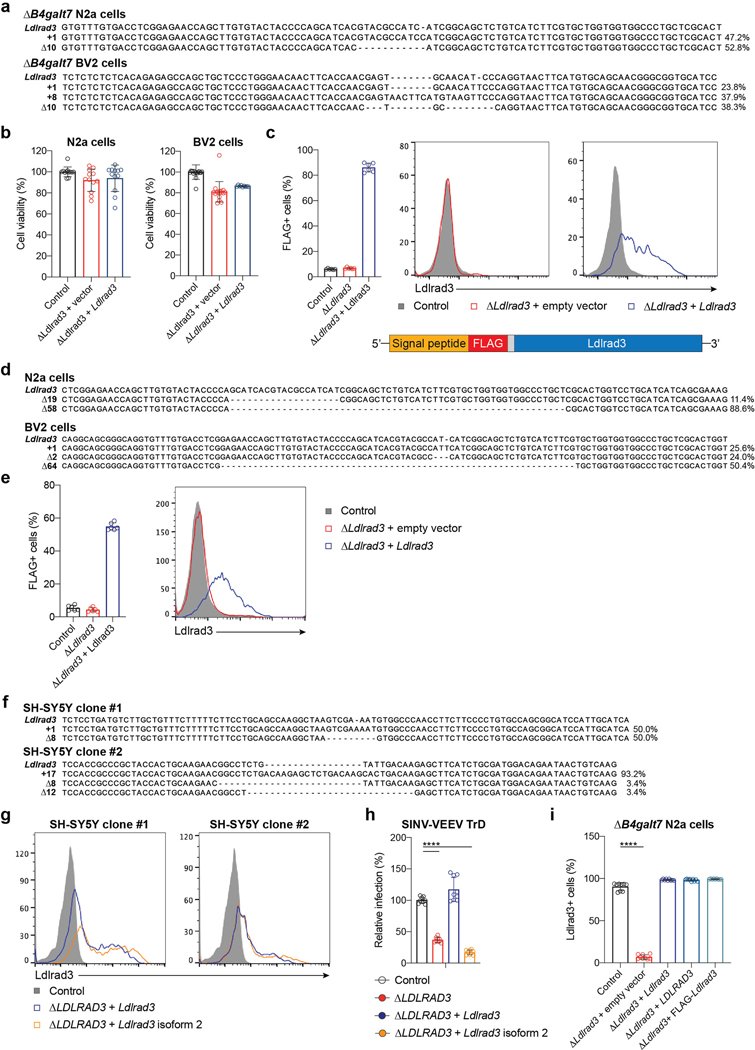
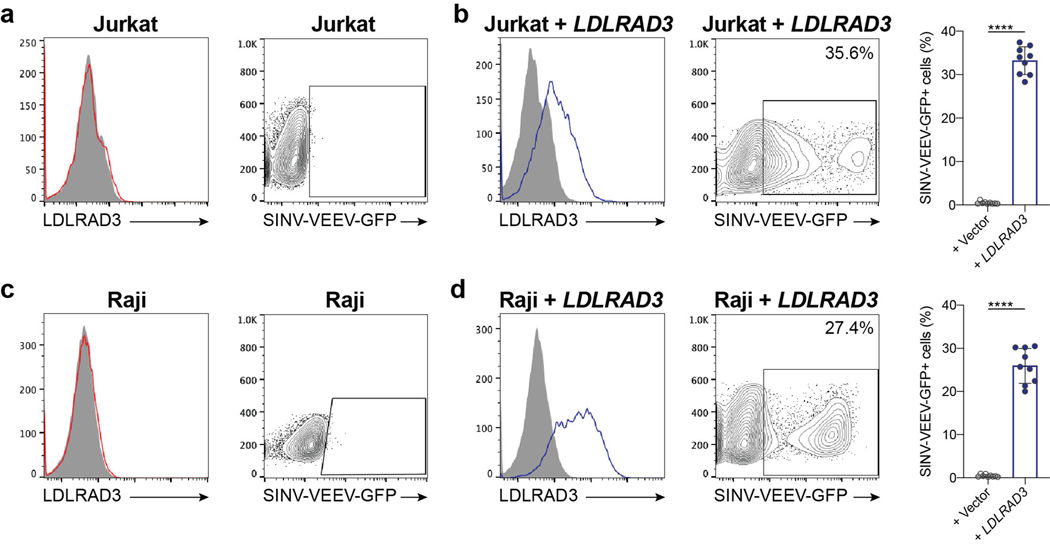
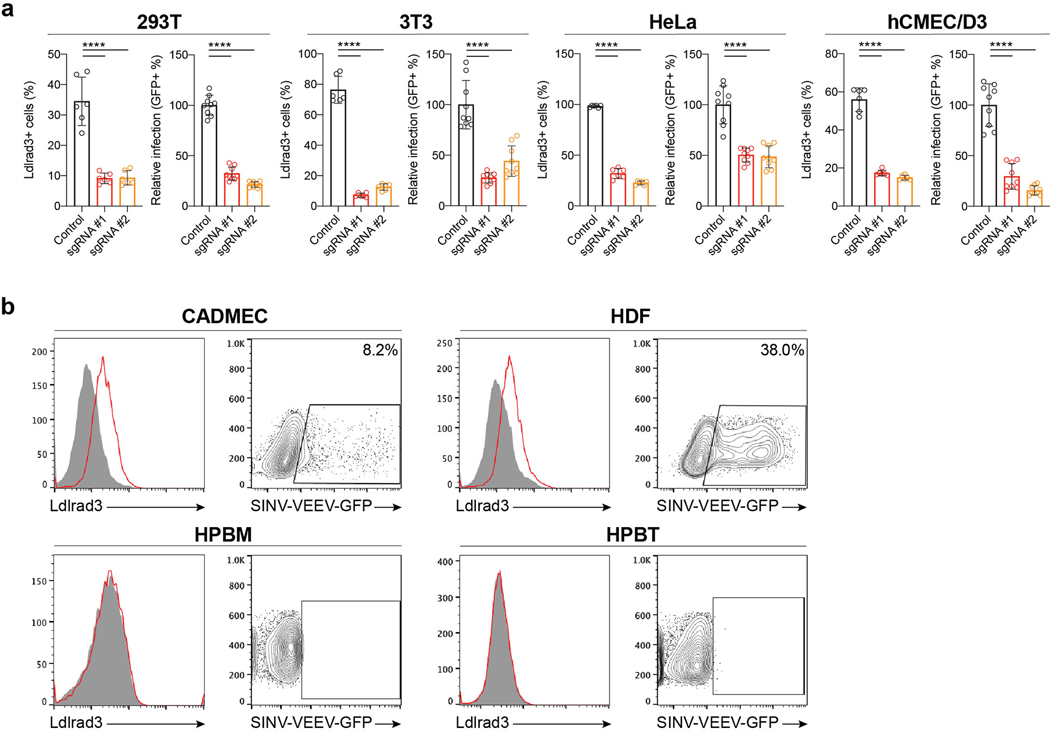
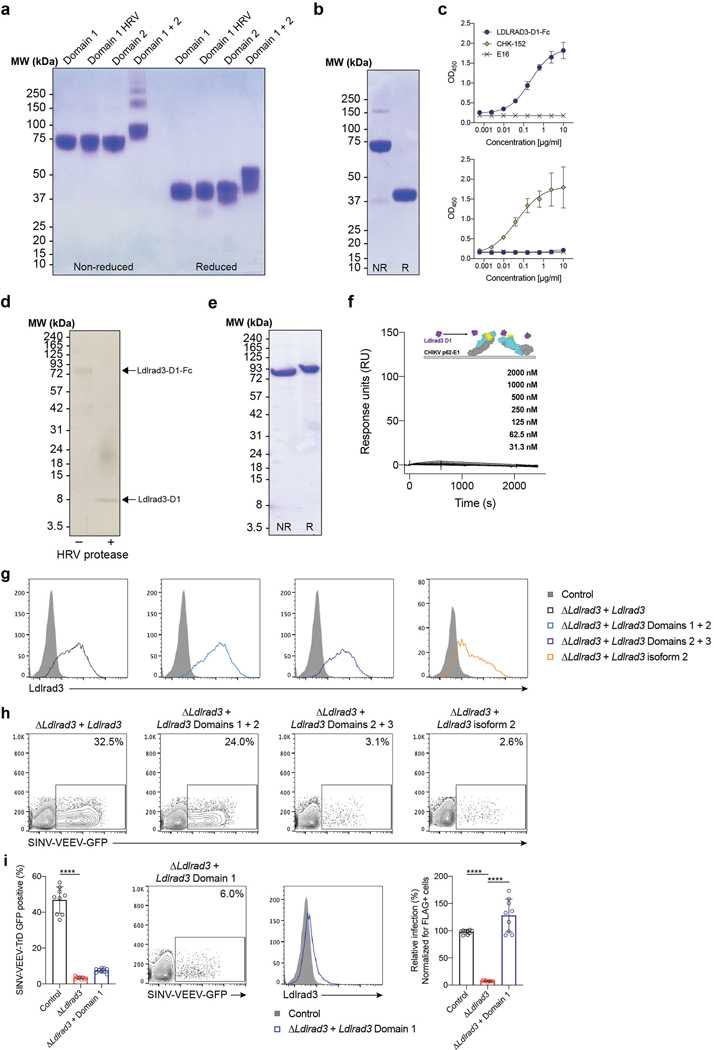
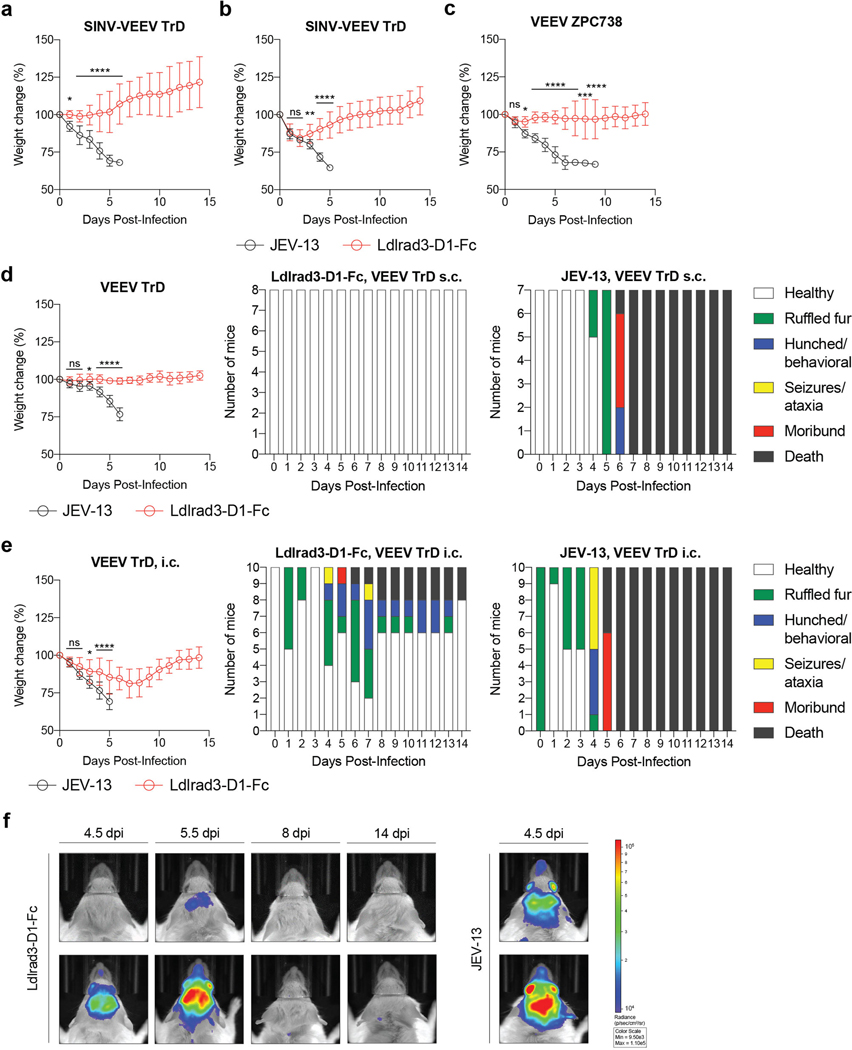
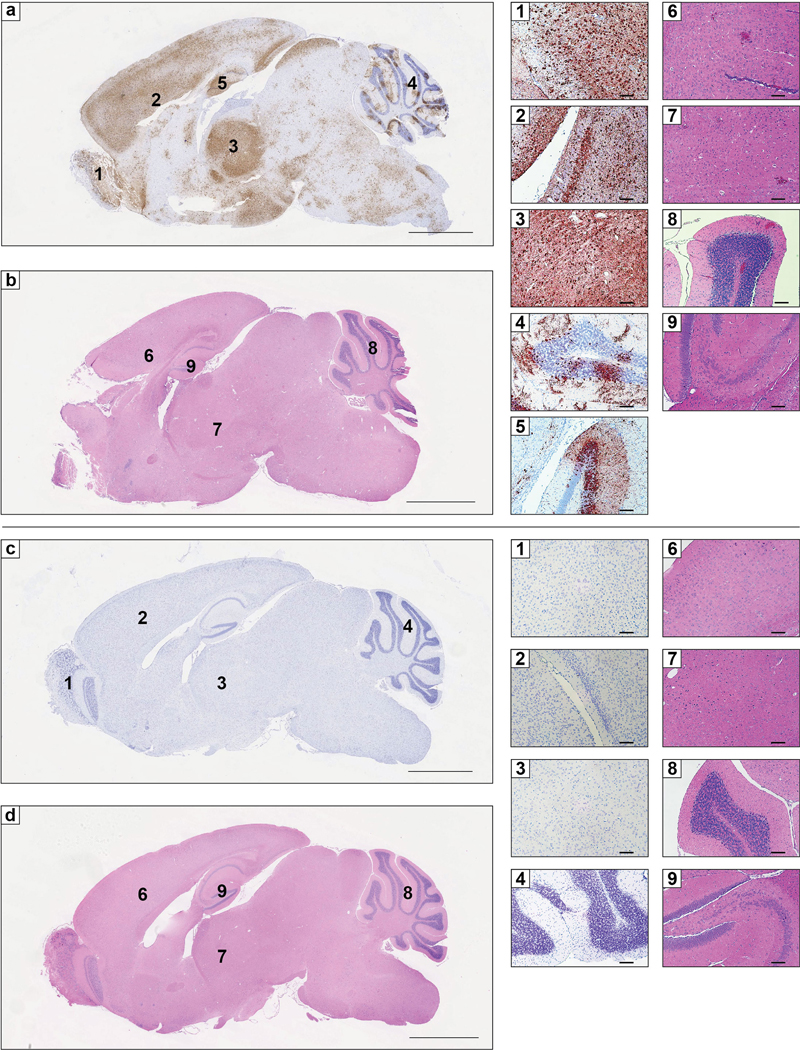
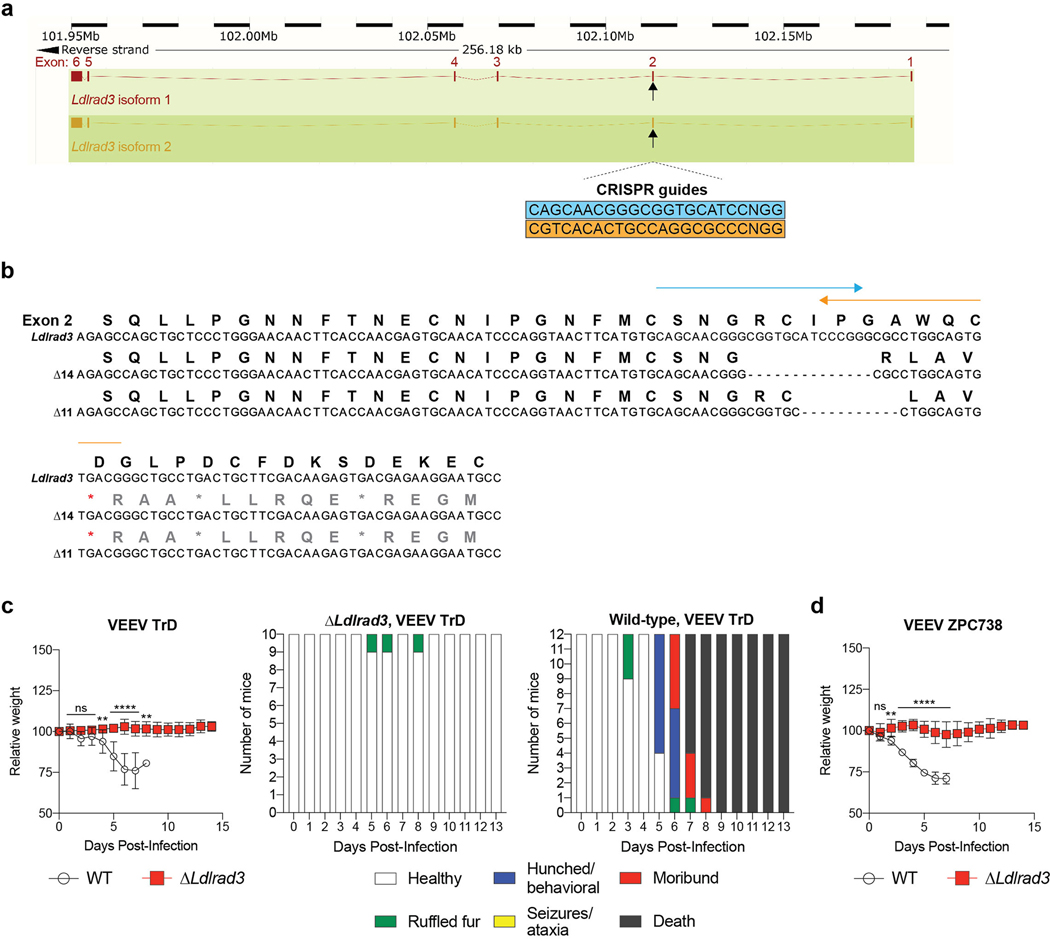
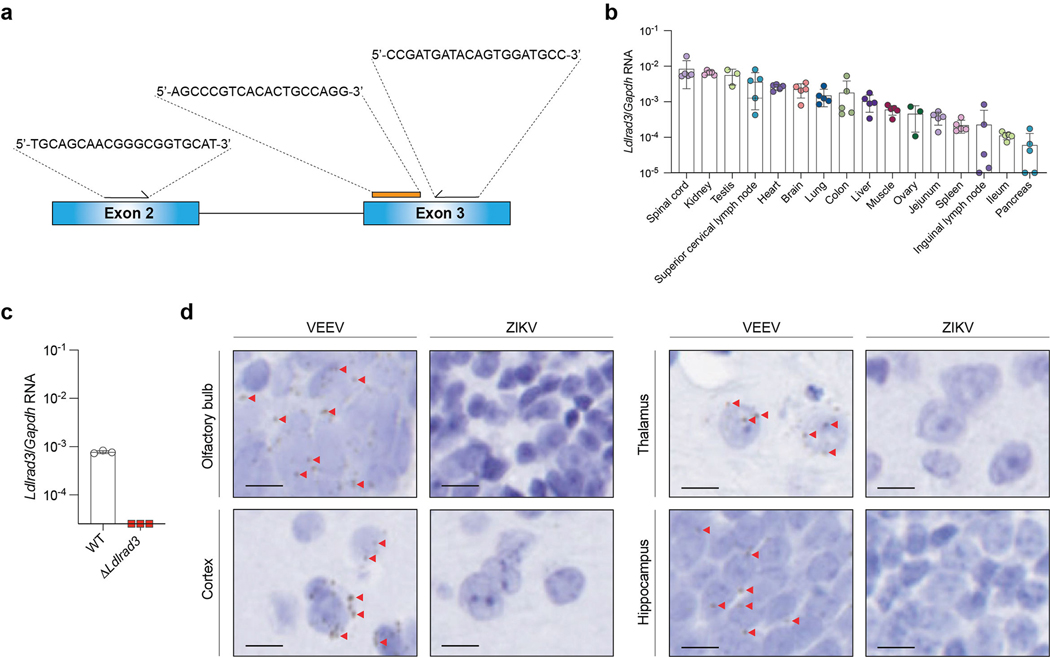
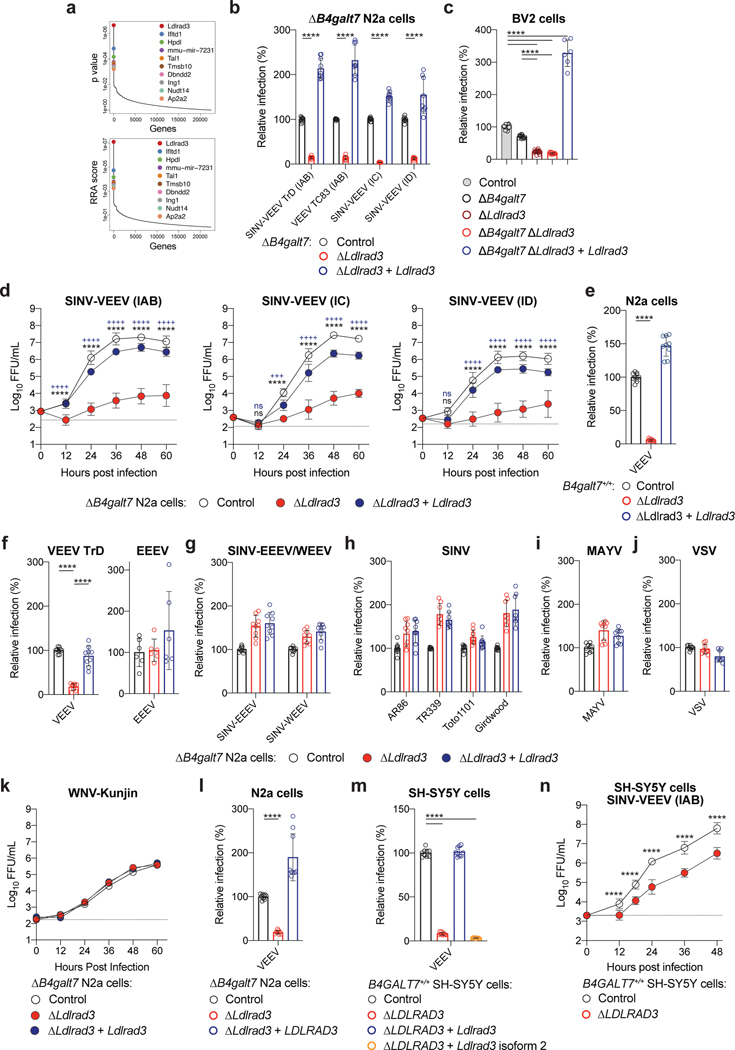
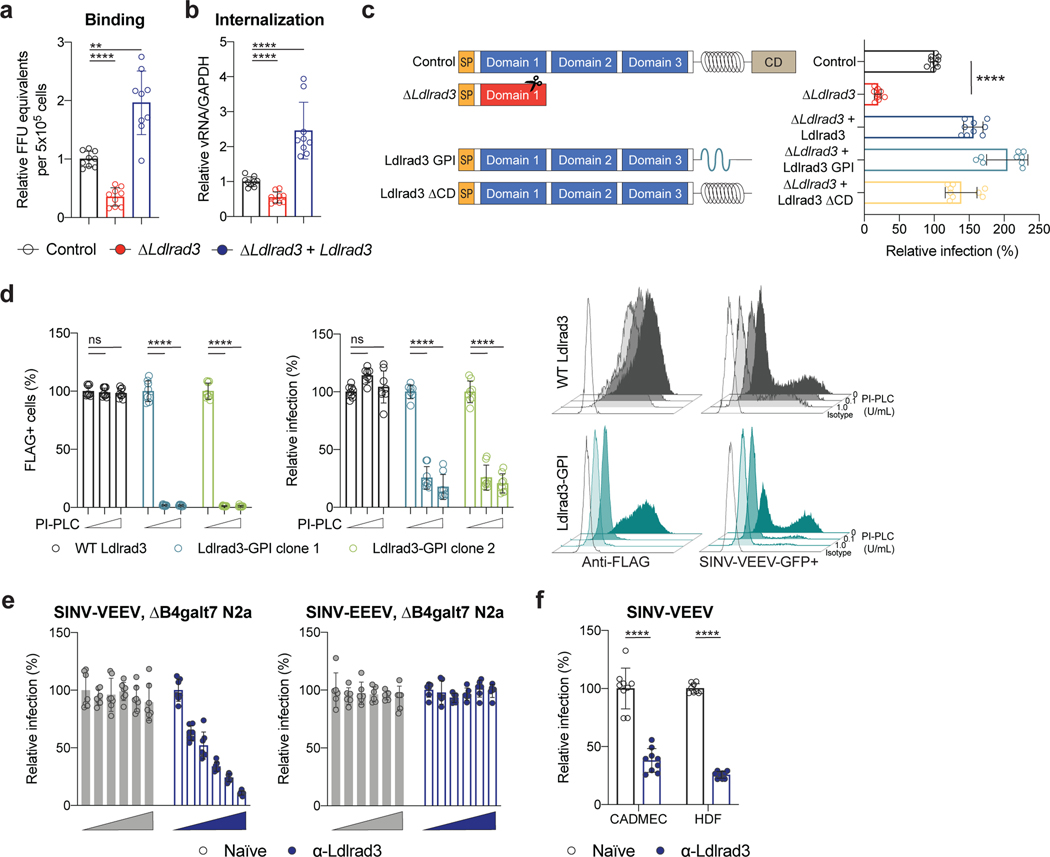
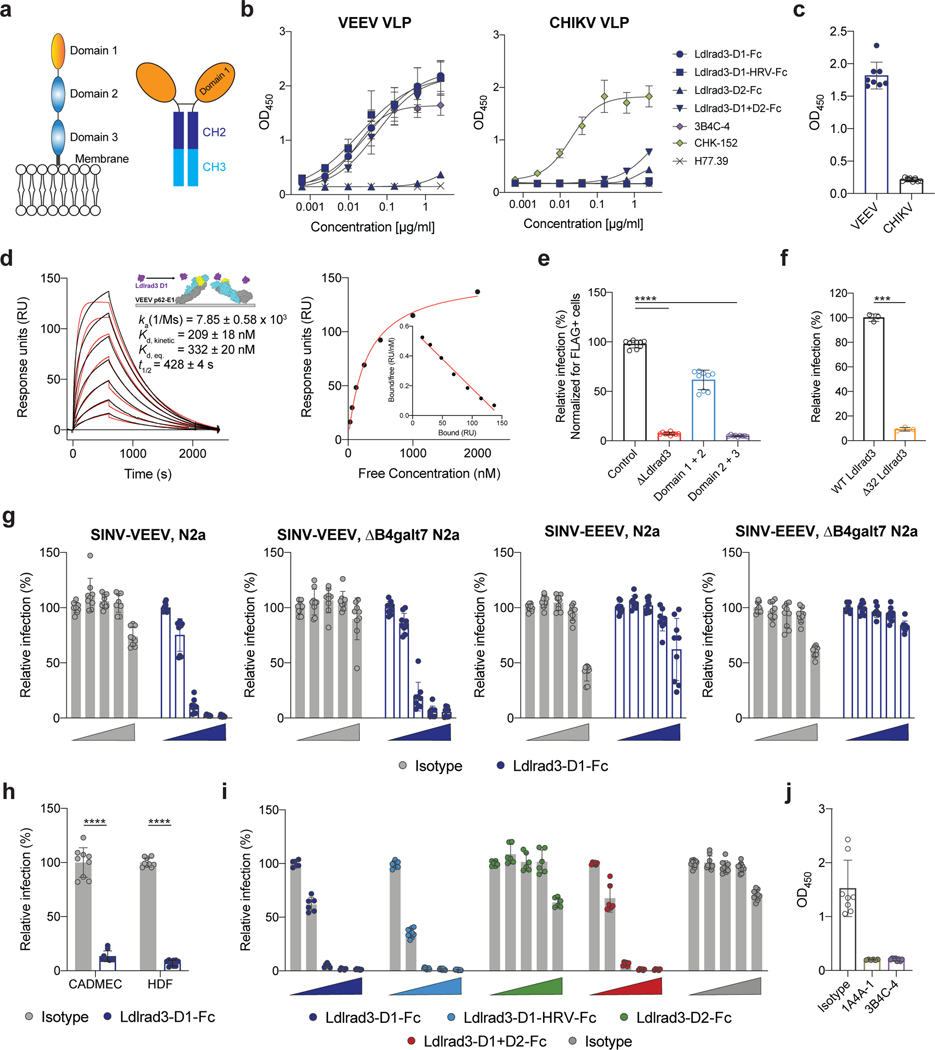
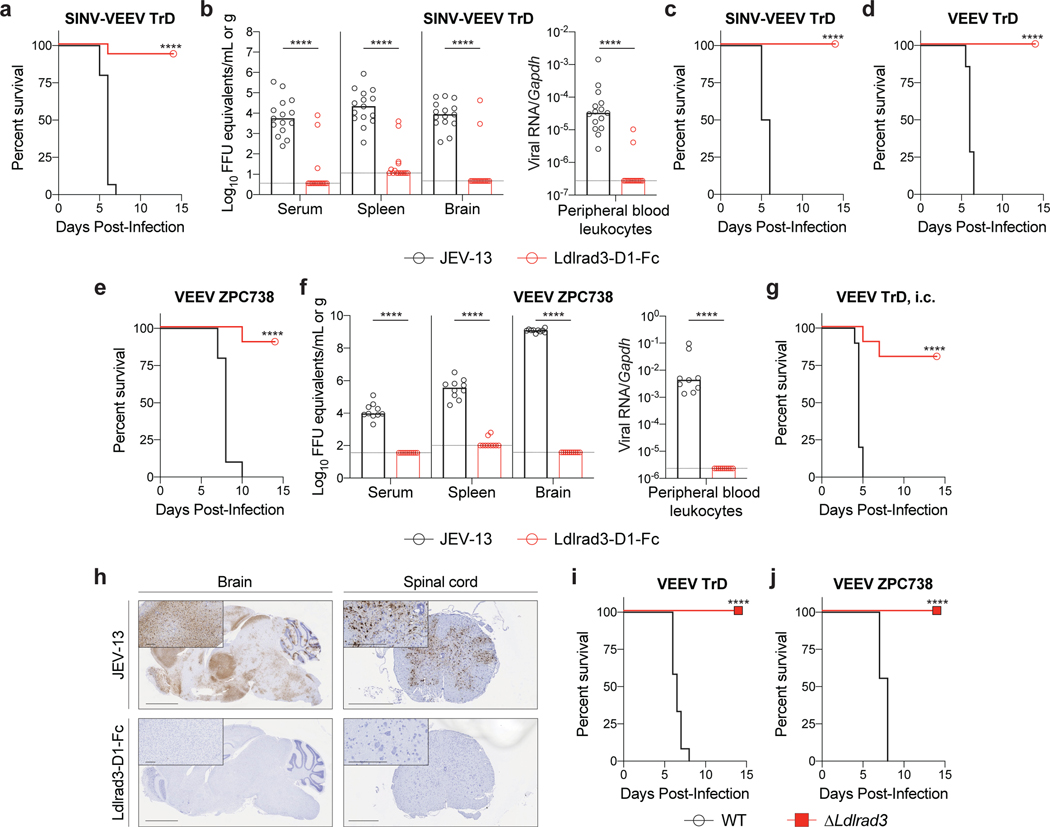
Venezuelan equine encephalitis virus (VEEV) is a neurotropic alphavirus transmitted by mosquitoes that causes encephalitis and death in humans1. VEEV is a biodefence concern because of its potential for aerosol spread and the current lack of sufficient countermeasures. The host factors that are required for VEEV entry and infection remain poorly characterized. Here, using a genome-wide CRISPR-Cas9-based screen, we identify low-density lipoprotein receptor class A domain-containing 3 (LDLRAD3)-a highly conserved yet poorly characterized member of the scavenger receptor superfamily-as a receptor for VEEV. Gene editing of mouse Ldlrad3 or human LDLRAD3 results in markedly reduced viral infection of neuronal cells, which is restored upon complementation with LDLRAD3. LDLRAD3 binds directly to VEEV particles and enhances virus attachment and internalization into host cells. Genetic studies indicate that domain 1 of LDLRAD3 (LDLRAD3(D1)) is necessary and sufficient to support infection by VEEV, and both anti-LDLRAD3 antibodies and an LDLRAD3(D1)-Fc fusion protein block VEEV infection in cell culture. The pathogenesis of VEEV infection is abrogated in mice with deletions in Ldlrad3, and administration of LDLRAD3(D1)-Fc abolishes disease caused by several subtypes of VEEV, including highly virulent strains. The development of a decoy-receptor fusion protein suggests a strategy for the prevention of severe VEEV infection and associated disease in humans.


Figures

Extended Data Figure 1.
Extended Data Figure 1.. CRISPR-Cas9-based screen identifying Ldlrad3 as required factor for VEEV infectivity.
a. ΔB4galt7 N2a cells were transfected separately with two half libraries containing 130,209 sgRNAs, puromycin selected, and then inoculated with SINV-VEEV-GFP (TrD strain) at an MOI of 1. After 24 h, GFP-negative cells were sorted, expanded in the presence of anti-VEEV mAbs (VEEV-57, VEEV-67, and VEEV-68 [2 μg/ml]), and re-inoculated with SINV-VEEV-GFP. The infection and sorting process were repeated twice. Genomic DNA from GFP-negative cells was sequenced for sgRNA abundance. b. Representative flow cytometry histogram of parental N2a (gray) and ΔB4galt7 N2a (red) cells stained for heparan sulfate (HS) surface expression using R1725, a rodent herpesvirus immune evasion protein that binds to HS. c. Schematic diagram of chimeric SINV-VEEV virus. The chimera contains the non-structural genes from SINV (strain TR339), structural genes from VEEV (IAB strain TrD, IC strain INH9813, or ID strain ZPC738), and an eGFP gene (green) between the capsid and E3 protein. The insertion of GFP has minimal effects on virus infection and replication,. d. Sequence alignment of mouse (Mus musculus), mouse Δ32 N-terminus isoform, human (Homo sapiens), rhesus macaque (Macaca mulatta), cattle (Bos taurus), horse (Equus caballus), dog (Canis lupus familiaris), and chicken (Gallus gallus) Ldlrad3 ectodomain using ESPript 3. Red boxes indicate conserved residues between orthologs. The predicted domains based on sequence similarity to other related proteins and the transmembrane domain are indicated below the sequence.
Extended Data Figure 2.
Extended Data Figure 2.. Gene-editing of Ldlrad3 expression.
a. Parental and gene-edited ΔB4galt7 N2a (top) and BV2 (bottom) cells were subjected to next-generation sequencing to confirm gene-editing of Ldlrad3. Sequences were aligned to the Ldlrad3 gene to identify nucleotide insertions or deletions (indels). Allele frequency is indicated next to each sequence. b. Viability of ΔB4galt7 (control, black), ΔB4galt7 ΔLdlrad3 (red), and Ldlrad3-complemented ΔB4galt7 ΔLdlrad3 (blue) N2a (left panel) and BV2 (right panel) cells as determined by Cell-Titer Glo assay. Mean ± SD of three to six experiments (N2a: n = 12; BV2: Control, n = 17; ΔLdlrad3 + vector, n = 17; ΔLdlrad3 + Ldlrad3, n = 9). c. Anti-FLAG staining of ΔB4galt7 N2a cells (control, black) and lentivirus complemented ΔB4galt7 ΔLdlrad3 N2a cells with empty vector (red) or Ldlrad3 cDNA (blue) containing an N-terminal FLAG-tag sequence (left panel). Schematic diagram of the FLAG-tagged Ldlrad3 protein (bottom panel) indicating the signal peptide (orange), FLAG tag (red), GGS linker (gray), and Ldlrad3 coding region (blue). Cells were stained with an anti-FLAG mAb and analyzed by flow cytometry. Mean ± SD of two experiments (n = 6). Representative flow cytometry histograms (right panel) showing Ldlrad3 surface expression of empty vector (red) and Ldlrad3 (blue) complemented ΔLdlrad3 cells. d. Next-generation sequencing confirmation of Ldlrad3 gene-editing in N2a (top) and BV2 (bottom) cells retaining HS biosynthetic capacity. Allele frequency is indicated next to each sequence. e. B4galt7+/+ (control, black), B4galt7+/+ ΔLdlrad3 (red), and B4galt7+/+ ΔLdlrad3 complemented with Ldlrad3 cDNA (blue) N2a cells were analyzed for surface expression of Ldlrad3 by flow cytometry using an anti-FLAG mAb. Mean ± SD of two experiments (n = 6). Representative flow cytometry histograms (right panel) showing Ldlrad3 surface expression of empty vector (red) and Ldlrad3 (blue) complemented ΔLdlrad3 cells. f. Next-generation sequencing of Ldlrad3 gene-editing in two independent SH-SY5Y cell lines. Allele frequency is indicated next to each sequence. g. Two clonal ΔLDLRAD3 SH-SY5Y cell populations were complemented with full-length Ldlrad3 or truncated Ldlrad3 isoform (N-terminal 32 amino acid deletion, isoform 2) cDNA containing an N-terminal FLAG-tag sequence, stained with an anti-FLAG mAb, and analyzed by flow cytometry. Representative flow cytometry histograms are shown. h. A second clonal population of ΔLDLRAD3 SH-SY5Y (red) cells were complemented with full-length Ldlrad3 (blue) or the truncated Ldlrad3 isoform (orange), inoculated with SINV-VEEV-GFP, and infection was assessed by flow cytometry. Mean ± SD of three experiments (n = 9; one-way ANOVA with Dunnett’s post-test: **** P < 0.0001). i. ΔB4galt7 (control, black), ΔB4galt7 ΔLdlrad3 (red), Ldlrad3-complemented ΔB4galt7 ΔLdlrad3 (blue), LDLRAD3-complemented ΔB4galt7 ΔLdlrad3 (light blue), and N-terminal FLAG-tagged Ldlrad3-complemented B4galt7 ΔLdlrad3 (teal) N2a cells were analyzed for Ldlrad3 or LDLRAD3 cell surface expression with anti-Ldlrad3 polyclonal serum. Mean ± SD of three experiments (n = 9; one-way ANOVA with Dunnett’s post-test: **** P < 0.0001).
Extended Data Figure 3.
Extended Data Figure 3.. Surface expression of LDLRAD3 and VEEV infection of human lymphocyte cell lines.
a. Representative flow cytometry histograms of Ldlrad3 surface expression using anti-Ldlrad3 polyclonal serum (left panel) and contour plots of SINV-VEEV-GFP infection (right panel) of Jurkat cells. b. LDLRAD3-complemented Jurkat cells were assessed for LDLRAD3 surface expression (left panel) and infection by SINV-VEEV-GFP TrD (center and right panels). Representative flow cytometry histograms and contour plots are shown. Mean ± SD of three experiments (n = 9; Mann-Whitney test: **** P < 0.0001). c. Representative flow cytometry histograms of Ldlrad3 surface expression using anti-Ldlrad3 polyclonal serum (left panel) and contour plots of SINV-VEEV-GFP infection (right panel) of Raji cells. d. LDLRAD3-complemented Raji cells were assessed for LDLRAD3 surface expression (left panel) and infection by SINV-VEEV-GFP TrD (center and right panels). Representative flow cytometry histograms are shown. Mean ± SD of three experiments (n = 9; Mann-Whitney test: **** P < 0.0001).
Extended Data Figure 4.
Extended Data Figure 4.. Surface expression of Ldlrad3 or LDLRAD3 and VEEV infection in different cell lines.
a-b. Representative flow cytometry histograms of Ldlrad3 or LDLRAD3 surface expression using anti-Ldlrad3 polyclonal serum (a) and contour plots of SINV-VEEV-GFP infection (b) of 293T, 3T3, A549, HAP1, HeLa, hCMEC/D3, HT1080, Huh7.5, K562, LADMAC, MRC-5, and U2OS cells. The population of infected cells are indicated for each cell line (b). Data are representative of two or three experiments.
Extended Data Figure 5.
Extended Data Figure 5.. Assessment of Ldlrad3 or LDLRAD3 surface expression and VEEV infection in gene-edited cell lines and primary cells.
a. Control and ΔLdlrad3 293T, 3T3, HeLa, and hCMEC/D3 cells were assessed for Ldlrad3 or LDLRAD3 surface expression (left panels) and SINV-VEEV-GFP TrD infection via GFP expression by flow cytometry (right panels). Two independent Ldlrad3 or LDLRAD3 gene-edited cell lines were generated (sgRNAs #1 and #2) and evaluated. Mean ± SD of three experiments (Ldlrad3 surface expression, n = 6; VEEV infection, n = 9; one-way ANOVA with Dunnett’s post-test: **** P < 0.0001). b. Primary cell lines (CADMEC, HDF, HPBM, and HPBT) were assessed for LDLRAD3 surface expression using anti-Ldlrad3 polyclonal serum (left panels, red). Cells were inoculated with SINV-VEEV-GFP and assessed for infection via GFP expression by flow cytometry (right panels, orange). The population of infected cells are indicated for each cell line. Data are representative of two or three experiments.
Extended Data Figure 6.
Extended Data Figure 6.. Expression and characterization of recombinant Fc-Ldlrad3, VEEV structural proteins, and domain truncated forms of Ldlrad3 proteins.
a-b. Coomassie-stained SDS-PAGE under non-reducing (NR) and reducing (R) conditions of mouse Ldlrad3 domain variants (D1, D1-HRV, D2, and D1+D2) fused to mouse IgG2b Fc domain (a) and LDLRAD3-D1 fused to human IgG1 Fc domain (b). Data are representative of two experiments. c. Binding of human LDLRAD3-D1-Fc, CHIKV positive control (humanized CHK-152 [CHK-152]), or negative control (humanized E16 [E16]) to VEEV (top panel) or CHIKV (bottom panel) VLPs by ELISA. Mean ± SD of two experiments (n = 8). d. Silver-stained SDS-PAGE of Ldlrad3-D1-HRV-Fc ([–]HRV protease) and HRV 3C protease-digested Ldlrad3-D1 ([+]HRV protease) under non-reducing conditions. Data are representative of three experiments. e. Coomassie-stained SDS-PAGE of baculovirus generated VEEV p62-E1 under non-reducing (NR) and reducing (R) conditions. Data are representative of two experiments. f. Binding of Ldlrad3-D1 (2,000 nM starting concentration, two-fold dilutions) to CHIKV p62-E1 by surface plasmon resonance. Ldlrad3-D1 does not bind appreciably to CHIKV p62-E1. Cartoon diagram (inset) and sensograms of HRV-cleaved monovalent Ldlrad3-D1 (purple) binding to CHIKV p62-E1 (E3, yellow; E2, cyan; E1, grey). Data are representative of three experiments. g-h. ΔLdlrad3 ΔB4galt7 N2a cells were complemented with either full-length Ldlrad3 (black), Ldlrad3 domain truncations D1+D2 (cyan), D2+D3 (purple), or an Ldlrad3 isoform that lacks 32 N-terminal residues (orange). Cells were assessed for Ldlrad3 surface expression by N-terminal FLAG-tag staining (g) and SINV-VEEV-GFP TrD infection (h) by flow cytometry analysis. The population of infected cells are indicated for each cell line. Data are representative of three experiments. i. ΔB4galt7 ΔLdlrad3 N2a cells were complemented with either empty vector (red) or Ldlrad3 D1 domain truncation (blue), inoculated with SINV-VEEV-GFP, and infection was assessed by flow cytometry (left panel). A representative flow cytometry plot of Ldlrad3-D1-complemented ΔB4galt7 ΔLdlrad3 N2a cells infected with SINV-VEEV-GFP TrD infection is shown. Mean ± SD of three experiments (n = 9; one-way ANOVA with Dunnett’s post-test: **** P < 0.0001). Flow cytometry histogram of Ldlrad3 D1 surface expression as assessed by N-terminal FLAG-tag staining and flow cytometry analysis (middle panel). Data are representative of two experiments. SINV-VEEV-GFP TrD infection of ΔB4galt7 (control, black), ΔB4galt7 ΔLdlrad3 (red), and Ldlrad3 D1 complemented ΔB4galt7 ΔLdlrad3 (blue) cells was normalized for FLAG positive cells (right panel). Mean ± SD of three experiments (n = 9; one-way ANOVA with Dunnett’s post-test: **** P < 0.0001). For gel source data, see Supplementary Figure 1.
Extended Data Figure 7.
Extended Data Figure 7.. Weight change and clinical assessment of C57BL/6J and CD-1 mice treated with Ldlrad3-D1-Fc.
a-b. Four-week-old C57BL/6J mice were administered 750 μg of anti-Ifnar1 mAb via intraperitoneal (i.p.) route 24 h before virus inoculation. 250 μg of Ldlrad3-D1-Fc or isotype control mAb JEV-13 was given 6 h before (a) or 24 h after (b) i.p. inoculation with 105 FFU of SINV-VEEV TrD. Mice were monitored for weight change. Mean ± SD from two or three experiments (a: n = 15; b: n = 10; two-way ANOVA with Dunnett’s post-test: * P < 0.05; ** P < 0.01, **** P < 0.0001; n.s., not significant). a: 1 day post infection (dpi), P = 0.0271; b: 1 dpi, P = 0.9978; 2 dpi, P = 0.9940; 3 dpi, P = 0.0082. c. Six-week-old C57BL/6J mice were administered 250 μg of Ldlrad3-D1-Fc or isotype control mAb JEV-13 via i.p. route 6 h prior to subcutaneous inoculation with 102 FFU of VEEV ZPC738. Mice were monitored for weight change. Data are mean ± SD from two experiments (n = 10; two-way ANOVA with Dunnett’s post-test for weight change: * P < 0.05, *** P < 0.001, **** P < 0.0001; n.s., not significant). 1 dpi, P > 0.9999; 2 dpi, P = 0.05; 8 dpi, P = 0.0001. d-f. Six-week-old CD-1 mice were administered 200 μg of Ldlrad3-D1-Fc or isotype control mAb JEV-13 via i.p. route 6 h prior to subcutaneous (d) or intracranial (e) inoculation with 103 PFU of VEEV TrD. Mice were monitored for weight change (left panel) and clinical disease (right panels) was assessed over time (healthy, ruffled fur, hunched/behavioral, seizures/ataxia, moribund, or death). Mean ± SD from two experiments (two-way ANOVA with Dunnett’s post-test for weight change: * P < 0.05, **** P < 0.0001; n.s., not significant; d: JEV-13, n = 7; Ldlrad3-D1-Fc, n = 8; e: n = 10). d: 1 dpi, P = 0.8267; 2 dpi, P = 0.0531; 3 dpi, P = 0.032; e: 1 dpi, P > 0.9999; 2 dpi, P = 0.2961; 3 dpi, P = 0.0482. At 4.5, 5.5, 8, and 14 days post-infection, IVIS imaging was used to visual VEEV-TrD luciferase infection in CD-1 mice that received Ldlrad3-D1-Fc or isotype control mAb JEV-13 prophylactic treatment and were challenged via intracranial inoculation (f). Isotype control treated mice became moribund at 4.5 days post-infection. The total flux (photons s−1) in the head region of each animal was quantified. IVIS images shown are representative images from two experiments (n = 10).
Extended Data Figure 8.
Extended Data Figure 8.. RNA in situ hybridization and histopathological analysis of VEEV infection in Ldlrad3-D1-Fc or isotype control treated mice.
a-d. Six-week-old C57BL/6J mice were administered 250 μg of isotype control mAb JEV-13 (a-b) or Ldlrad3-D1-Fc (c-d) via intraperitoneal route 6 h prior to subcutaneous inoculation of 102 FFU of VEEV ZPC738. Six days post-infection, brain tissues were harvested, fixed, paraffin-embedded, and subjected to RNA in situ hybridization using VEEV ZPC738-specific probes (a and c) and hematoxylin and eosin staining (b and d). Scale bars, 2 mm. Representative high-power (10X) magnification insets of the olfactory bulb (1), cortex and midbrain (2), thalamus (3), cerebellum (4), and hippocampus (5) are shown for isotype control (a, top) or Ldlrad3-D1-Fc (c, bottom) treated mice. Scale bars, 100 μm. Hematoxylin and eosin staining of brain sections from isotype control (b) or Ldlrad3-D1-Fc (d) treated mice. Scale bars, 2 mm. Representative high-power (10X) magnification insets of the cerebral cortex (6), thalamus (7), cerebellum (8), and hippocampus (9) are shown for isotype control (b, top) or Ldlrad3-D1-Fc (d, bottom) treated mice. Scale bars, 100 μm. Representative images from one experiment (n = 5 per group) are shown.
Extended Data Figure 9.
Extended Data Figure 9.. Generation and clinical assessment of C57BL/6 mice with deletions in Ldlrad3 by CRISPR-Cas9 gene targeting.
a. Scheme of Ldlrad3 gene locus with two sgRNA targeting guides for a site in exon 2 of both isoforms. The full-length and truncated Δ32 N-terminus residue Ldlrad3 isoforms are colored red (top) and orange (bottom), respectively. b. Sequencing and alignment of Ldlrad3 sgRNA targeting region in exon 2 (11- and 14-nucleotide frameshift deletions) in gene-edited Ldlrad3 mice. The amino acid residues and the two sgRNA guides used for gene-editing (blue and orange arrows) are indicated above. c-d. Seven-week-old male and female mice with deletions in Ldlrad3 (Δ11 or Δ14 nucleotides; homozygous or compound heterozygous) or wild-type C57BL/6 mice were inoculated subcutaneously with 103 PFU of VEEV TrD (c, left panel) or 102 FFU of VEEV ZPC738 (d). Mice were monitored for weight change. Data are from two experiments (VEEV TrD: WT, n = 12; ΔLdlrad3, n = 10; VEEV ZPC738: WT, n = 9; ΔLdlrad3, n = 8; two-way ANOVA with Dunnett’s post-test: ** P < 0.01, **** P < 0.0001; n.s., not significant). c: 1 dpi, P > 0.999; 2 dpi, P = 0.2136; 3 dpi, P = 0.5489; 4 dpi, P = 0.0065; 8 dpi, P = 0.0014. d: 1 dpi, P = 0.8383; 2 dpi, P = 0.001. Clinical disease (right panels) was assessed over time (healthy, ruffled fur, hunched/behavioral, seizures/ataxia, moribund, or death) in mice inoculated with VEEV TrD (c, right panels).
Extended Data Figure 10.
Extended Data Figure 10.. Ldlrad3 mRNA expression in tissues from mice.
a. Generation of a TaqMan primer/probe set against the Ldlrad3 gene targeting exons 2 and 3. b-c. Profile of Ldlrad3 mRNA expression in different mice tissues (b) and the brains of wild-type and Ldlrad3-deficient mice (c). Data are the mean ± SD of one experiment (b: spinal cord, kidney, superior cervical lymph node, heart, brain, lung, colon, liver, muscle, jejunum, spleen, inguinal lymph node, ileum, pancreas, n = 5; testis, ovary, n = 3; c: n = 3). d. In situ hybridization (brown) of Ldlrad3 (olfactory bulb, cortex, thalamus, and hippocampus) from WT mice (left panels). Ldlrad3 RNA puncta are indicated by left-pointing red arrows. A ZIKV RNA in situ hybridization probe was used as a negative control (right panels). Slides were counterstained with Gill’s hematoxylin. Representative high-power (63X) magnification images from n = 5 per group are shown. Scale bar, 10 μm.
Figure 1.
Figure 1.. Ldlrad3 is required for efficient VEEV infection in cells.
a. Enriched genes based on top p-values (top panel) or robust rank aggregation scores (bottom panel) in the SINV-VEEV selected population. b. ΔB4galt7 (control, black), ΔB4galt7 ΔLdlrad3Ldlrad3, red), and Ldlrad3-complemented ΔB4galt7 ΔLdlrad3Ldlrad3 + Ldlrad3, blue) N2a cells were inoculated with SINV-VEEV-GFP (IAB strain TrD, IC strain INH9813, and ID strain ZPC738) or VEEV TC-83, and infection levels were assessed through GFP expression or E2 antigen staining. SINV-VEEV TrD (IAB), VEEV TC83, and SINV-VEEV (IC): n = 9; SINV-VEEV (ID): n = 8. Mean ± standard deviation (SD) of three experiments. c. Control (gray), ΔB4galt7 (black), ΔLdlrad3 (dark red), ΔB4galt7 ΔLdlrad3 (red), and Ldlrad3-complemented ΔB4galt7 ΔLdlrad3 (blue) BV2 cells were inoculated with SINV-VEEV-GFP (strain TrD), and infection levels were assessed by flow cytometry. WT and ΔLdlrad3, n = 18; ΔB4galt7 and ΔB4galt7 ΔLdlrad3, n = 12; ΔB4galt7 ΔLdlrad3 + Ldlrad3, n = 6. Mean ± SD of three to six experiments. d. Multi-step growth curves of ΔB4galt7 (control, black), ΔB4galt7 ΔLdlrad3Ldlrad3, red), and Ldlrad3-complemented ΔB4galt7 ΔLdlrad3Ldlrad3 + Ldlrad3, blue) N2a cells with SINV-VEEV viruses (IAB strain TrD, IC strain INH9813, and ID strain ZPC738). Mean ± SD of three experiments (n = 9). e. Control (black), ΔLdlrad3 (red), and Ldlrad3-complemented ΔLdlrad3 (blue) N2a cells retaining GAG biosynthesis (B4galt7+/+) were inoculated with SINV-VEEV-GFP (strain TrD), and infection was assessed by flow cytometry. Mean ± SD of three experiments (n = 9). f. ΔB4galt7 (control, black), ΔB4galt7 ΔLdlrad3 (red), and Ldlrad3-complemented ΔB4galt7 ΔLdlrad3 (blue) N2a cells were inoculated with VEEV IAB TrD-GFP (left panel) or EEEV FL93-939-GFP (right panel) and assessed for infection by flow cytometry. Mean ± SD of two (EEEV) or three (VEEV) experiments (EEEV: n = 6; VEEV: n = 9). g-j. ΔB4galt7 (control, black), ΔB4galt7 ΔLdlrad3 (red), and Ldlrad3-complemented ΔB4galt7 ΔLdlrad3 (blue) N2a cells were inoculated with SINV-EEEV or SINV-WEEV (g), SINV (strains AR86, TR339, Toto1101, or Girdwood) (h), MAYV (i), or VSV (j) and infection was assessed via GFP expression or viral antigen staining. (g) SINV-EEEV and SINV-WEEV, n = 9. (h) AR86 and Toto1101, n = 9; TR339 and Girdwood, n = 8. (i) MAYV, n = 9. (j) VSV, n = 9. Mean ± SD of three experiments. k. Multi-step growth curves of ΔB4galt7 (control, black), ΔB4galt7 ΔLdlrad3 (red), and Ldlrad3-complemented ΔB4galt7 ΔLdlrad3 (blue) N2a cells with WNV-Kunjin. Mean of two experiments performed in duplicate. l. ΔB4galt7 (control, black), ΔB4galt7 ΔLdlrad3 (red), and LDLRAD3-complemented ΔB4galt7 ΔLdlrad3 (blue) N2a cells were inoculated with SINV-VEEV-GFP (strain TrD) and infection was assessed by flow cytometry. Mean ± SD of three experiments (n = 9). m. Control (black), ΔLDLRAD3 (red), full-length Ldlrad3-complemented (blue), and truncated Ldlrad3 isoform-complemented ΔLDLRAD3 (orange) B4GALT7+/+ human SH-SY5Y cells were inoculated with SINV-VEEV-GFP (strain TrD), and infection was assessed by flow cytometry. Mean ± SD of three experiments (n = 9). n. Multi-step growth curves of control (black) and ΔLDLRAD3 (red) B4GALT7+/+ human SH-SY5Y cells. Mean ± SD of three experiments (n = 9: two-way ANOVA with Dunnett’s post-test: **** P < 0.0001). One-way (e, f, l, m) or two-way (b, c, n) ANOVA with Dunnett’s post-test: **** P < 0.0001; ns, not significant. d, two-way ANOVA with Dunnett’s post-test: +++ P < 0.001; **** or ++++ P < 0.0001; ns, not significant. “*” [black] indicates a comparison between ΔB4galt7 [control] and ΔB4galt7 ΔLdlrad3 N2a cells (SINV-VEEV (IC): 12 h, P = 0.8935; SINV-VEEV (ID): 12 h, P = 0.0553). “+” [blue] indicates a comparison between Ldlrad3-complemented ΔB4galt7 ΔLdlrad3 and ΔB4galt7 ΔLdlrad3 N2a cells (SINV-VEEV (IC): 12 h, P = 0.8541; 24 h, P = 0.0003; SINV-VEEV (ID): 12 h, P = 0.6690).
Figure 2.
Figure 2.. Ldlrad3 modulates VEEV attachment and internalization.
a-b. SINV-VEEV TrD was incubated with ΔB4galt7 (control, black), ΔB4galt7 ΔLdlrad3Ldlrad3, red), and Ldlrad3-complemented ΔB4galt7 ΔLdlrad3Ldlrad3 + Ldlrad3, blue) N2a cells at 4°C. (a) Bound virions were quantitated by measuring viral RNA levels via qRT-PCR, or (b) after removal of unbound virus, the temperature was increased to 37°C to allow internalization. Intracellular RNA (VEEV and Gapdh) levels were measured by qRT-PCR. Mean ± SD of three experiments (n = 9). c. Schematic (left panel) of wild-type Ldlrad3 (control), ΔLdlrad3, Ldlrad3-GPI, and Ldlrad3 lacking cytoplasmic domain (ΔCD) constructs that were introduced in ΔB4galt7 N2a cells. Complemented N2a cells were inoculated with SINV-VEEV-GFP, and infection was measured by flow cytometry (right panel). Mean ± SD of three experiments (n = 9). d. Complementation of two ΔB4galt7 ΔLdlrad3 clonal cell lines with wild-type Ldlrad3 or Ldlrad3-GPI and effects of PI-PLC treatment. Cells were incubated with 0, 0.1, or 1 U/ml PI-PLC and analyzed for Ldlrad3 surface expression (left panels) or inoculated with SINV-VEEV-GFP (right panels). Representative flow cytometry histograms of surface expression of Ldlrad3 or VEEV infection are shown. Isotype control mAb or uninfected cells are included as black, unfilled histogram plots. Mean ± SD of three experiments (n = 9). e. Blockade of SINV-VEEV-GFP (left panel) or SINV-EEEV-GFP (right panel) infection with serial dilutions of naïve or anti-Ldlrad3 polyclonal mouse serum (1:12,800; 1:3,200; 1:800; 1:200; and 1:50 dilutions) in ΔB4galt7 N2a cells. SINV-VEEV, n = 7; SINV-EEEV, n = 6. Mean ± SD of three experiments. f. Blockade of SINV-VEEV-GFP with naïve or anti-Ldlrad3 polyclonal mouse serum (1:1,000 dilution) in primary human dermal microvascular endothelial cells (CADMEC) and fibroblasts (HDF). Mean ± SD of three experiments (n = 9; Mann-Whitney test: **** P < 0.0001). a, b, c, d. One-way ANOVA with Dunnett’s post-test: ** P = 0.0019; **** P < 0.0001; n.s., not significant (P > 0.9999).
Figure 3.
Figure 3.. Direct binding of Ldlrad3 to VEEV.
a. Schematic of the ectodomain of Ldlrad3 (left panel) and Ldlrad3-D1-Fc (right panel). b. Binding of Ldlrad3-Fc domain variants, VEEV positive control (3B4C-4), CHIKV positive control (CHK-152), or negative control (H77.39) to VEEV or CHIKV VLPs by ELISA. VEEV: Ldlrad3-D1-Fc, n = 10; Ldlrad3-D1-HRV-Fc and Ldlrad3-D1+D2-Fc, n = 8; Ldlrad3-D2-Fc and 3B4C-4, n = 6; H77.39, n = 4. CHIKV: Ldlrad3-D1-Fc, Ldlrad3-D1-HRV-Fc, Ldlrad3-D2-Fc, Ldlrad3-D1+D2-Fc, CHK-152, and H77.39, n = 4. Mean ± SD of two to three experiments. c. Binding of LDLRAD3-D1 human IgG1 fusion protein (10 μg/ml) to VEEV or CHIKV VLPs by ELISA. Mean ± SD of two experiments (n = 8). d. (Left panel) Cartoon diagram (inset), sensograms, and binding parameters of HRV-cleaved monovalent Ldlrad3-D1 (purple) binding to VEEV p62-E1 (E3, yellow; E2, cyan; E1, grey). A 1:1 binding model (red traces) was used to fit experimental curves. Representative response curve for steady-state analysis (right panel) in which binding is plotted versus Ldlrad3-D1 concentration. Inset, linear Scatchard plot. Mean ± SEM of three experiments. e. ΔB4galt7 ΔLdlrad3 N2a cells were complemented with empty vector, full-length Ldlrad3, domains 1–2 (D1+D2), or domains 2–3 (D2+D3) of Ldlrad3, and inoculated with SINV-VEEV-GFP. Infection data at 7.5 h post-infection are the mean ± SD of three experiments (n = 9). f. Full-length Ldlrad3 or a shorter Ldlrad3 isoform with a N-terminal 32 amino acid deletion (Δ32 Ldlrad3) was introduced into ΔB4galt7 ΔLdlrad3 N2a cells and inoculated with SINV-VEEV-GFP. Infection data 7.5 h post-infection are the mean ± SD of three experiments (n = 8). g. Inhibition of SINV-VEEV-GFP and SINV-EEEV-GFP infection with Ldlrad3-D1-Fc or isotype control IgG (0, 0.1, 1, 10, and 100 μg/ml) in ΔLdlrad3 and ΔB4galt7 ΔLdlrad3 N2a cells. Mean ± SD of three experiments (n = 9). h. Blockade of SINV-VEEV-GFP with Ldlrad3-D1-Fc or isotype control IgG (1 μg/ml) in human dermal microvascular endothelial cells (CADMEC) and fibroblasts (HDF). Mean ± SD of three experiments (n = 9). i. Dose-dependent inhibition of SINV-VEEV-GFP with Ldlrad3-Fc domain variants (D1, D1-HRV, D2, D1+D2) or isotype control IgG (0, 0.1, 1, 10, and 100 μg/ml). Ldlrad3-D1-HRV-Fc and Isotype, n = 9; Ldlrad3-D1-Fc, Ldlrad3-D2-Fc, and Ldlrad3-D1+D2-Fc, n = 6. Mean ± SD of three experiments. j. Competition binding analysis of Ldlrad3-D1-Fc and anti-VEEV mAbs by ELISA. Ldlrad3-D1-Fc did not bind to VEEV VLPs incubated with either 3B4C-4 or 1A4A-1, which indicates epitope competition. Isotype and 3B4C-4, n = 8; 1A4A-1, n = 6. Mean ± SD of two or three experiments. e, one-way ANOVA with Dunnett’s post-test: **** P < 0.0001; f, h, Mann-Whitney test: ** P = 0.0002; **** P < 0.0001.
Figure 4.
Figure 4.. Ldlrad3 is required for VEEV pathogenesis in mice.
a-c. Four-week-old C57BL/6J mice were administered 750 μg of anti-Ifnar1 mAb via intraperitoneal (i.p.) route 24 h before virus inoculation. 250 μg of Ldlrad3-D1-Fc or isotype control mAb JEV-13 was injected 6 h before (a-b) or 24 h after (c) i.p. inoculation with SINV-VEEV TrD. a, c. Survival data are from two or three experiments (a: n = 15; c: n = 10). At 4 dpi, serum and tissues were assessed for viral RNA levels (b). Three experiments (n = 15). Bars indicate median values and dashed lines indicate the limit of detection (LOD). d-f. Six-week-old CD-1 (d) or C57BL/6J (e-f) mice were administered either 200 μg (d) or 250 μg (e-f) of Ldlrad3-D1-Fc or isotype control mAb JEV-13 via i.p. route 6 h prior to subcutaneous inoculation with VEEV TrD (d) or VEEV ZPC738 (e-f). Survival data are from two experiments (d: JEV-13, n = 7; Ldlrad3-D1-Fc, n = 8; e: n = 10). At 6 dpi, serum, cells, and tissues were assessed for viral RNA levels (f). Bars indicate median values and dashed lines indicate LOD. g. Six-week-old CD-1 mice were administered 200 μg of Ldlrad3-D1-Fc or isotype control mAb via i.p. route 6 h prior to intracranial inoculation with VEEV TrD. Survival data are from two experiments (n = 10). h. In situ hybridization of brain (left panels) and spinal cord (right panels) tissues for VEEV RNA (brown). C57BL/6J mice were administered 250 μg of isotype control mAb JEV-13 (top panels) or Ldlrad3-D1-Fc (bottom panels) via i.p. route 6 h prior to subcutaneous inoculation of VEEV ZPC738. Tissues were harvested at 6 dpi. Slides were counterstained with Gill’s hematoxylin. Scale bars, brain: 2 mm and spinal cord: 500 μm. Scale bars of high-power (10X) magnification insets, 200 μm. Representative images from one experiment (n = 5 per group). i-j. Seven-week-old mice with deletions in Ldlrad3 (see Extended Data Fig 9b) or wild-type C57BL/6J mice were inoculated subcutaneously with VEEV TrD (i) or VEEV ZPC738 (j). Survival data are from two experiments (i: WT, n = 12; ΔLdlrad3, n = 10; j: WT, n = 9; ΔLdlrad3, n = 8). a, c, d, e, g, i, j, log-rank test: **** P < 0.0001; b, f, Mann-Whitney test: **** P < 0.0001.

Comment in

References

    1. Sharma A & Knollmann-Ritschel B. Current Understanding of the Molecular Basis of Venezuelan Equine Encephalitis Virus Pathogenesis and Vaccine Development. Viruses 11(2019). - PMC - PubMed
    1. Weaver SC & Barrett AD Transmission cycles, host range, evolution and emergence of arboviral disease. Nat Rev Microbiol 2, 789–801 (2004). - PMC - PubMed
    1. Aguilar PV, et al. Endemic Venezuelan equine encephalitis in the Americas: hidden under the dengue umbrella. Future Virol 6, 721–740 (2011). - PMC - PubMed
    1. Zhang R, et al. Mxra8 is a receptor for multiple arthritogenic alphaviruses. Nature 557, 570–574 (2018). - PMC - PubMed
    1. Basore K, et al. Cryo-EM structure of Chikungunya virus in complex with the Mxra8 receptor. Cell 177, 1725–1737 (2019). - PMC - PubMed

Publication types

MeSH terms