. 2021 Sep;597(7875):274-278.
doi: 10.1038/s41586-020-2931-3. Epub 2020 Nov 18.

Defining HPV-specific B cell responses in patients with head and neck cancer

Affiliations

Defining HPV-specific B cell responses in patients with head and neck cancer

Andreas Wieland et al. Nature. 2021 Sep.

Abstract

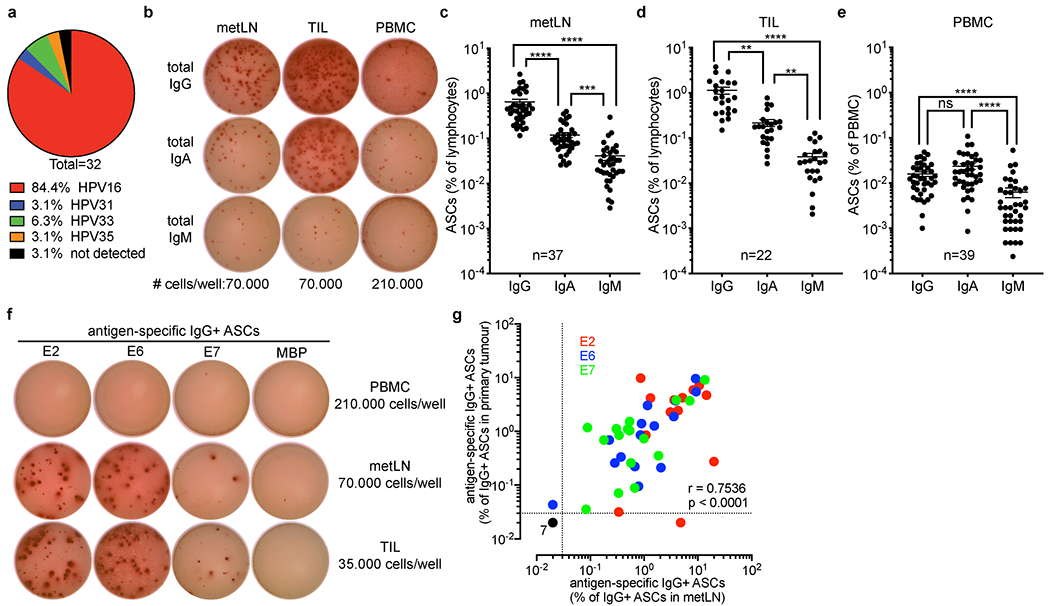
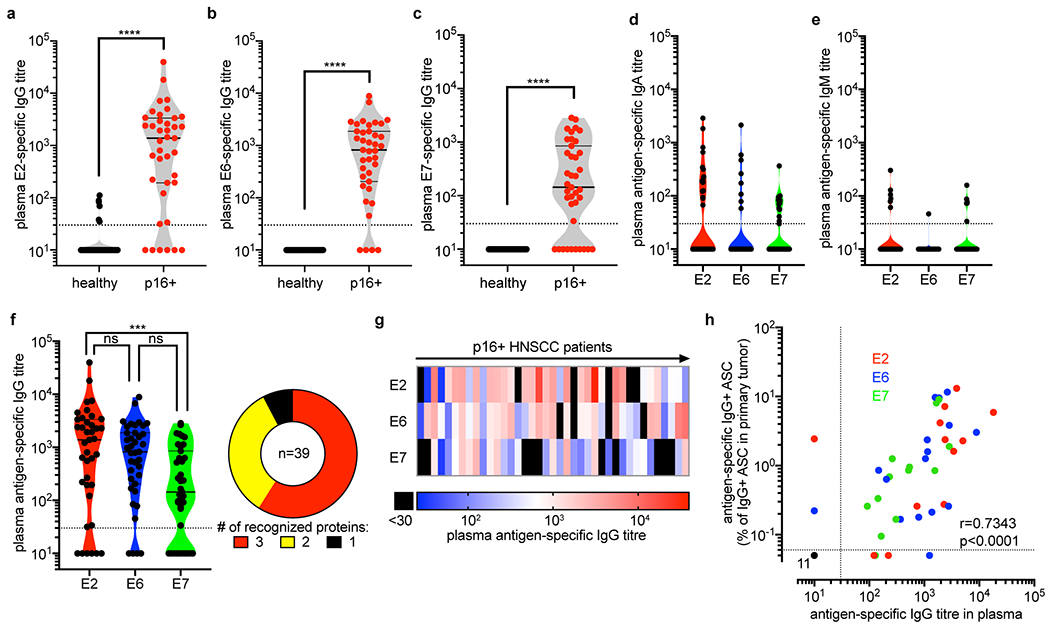
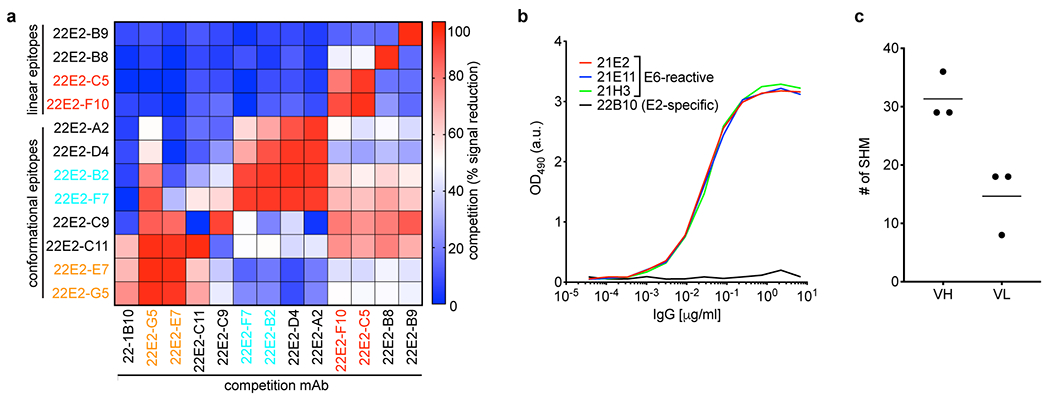
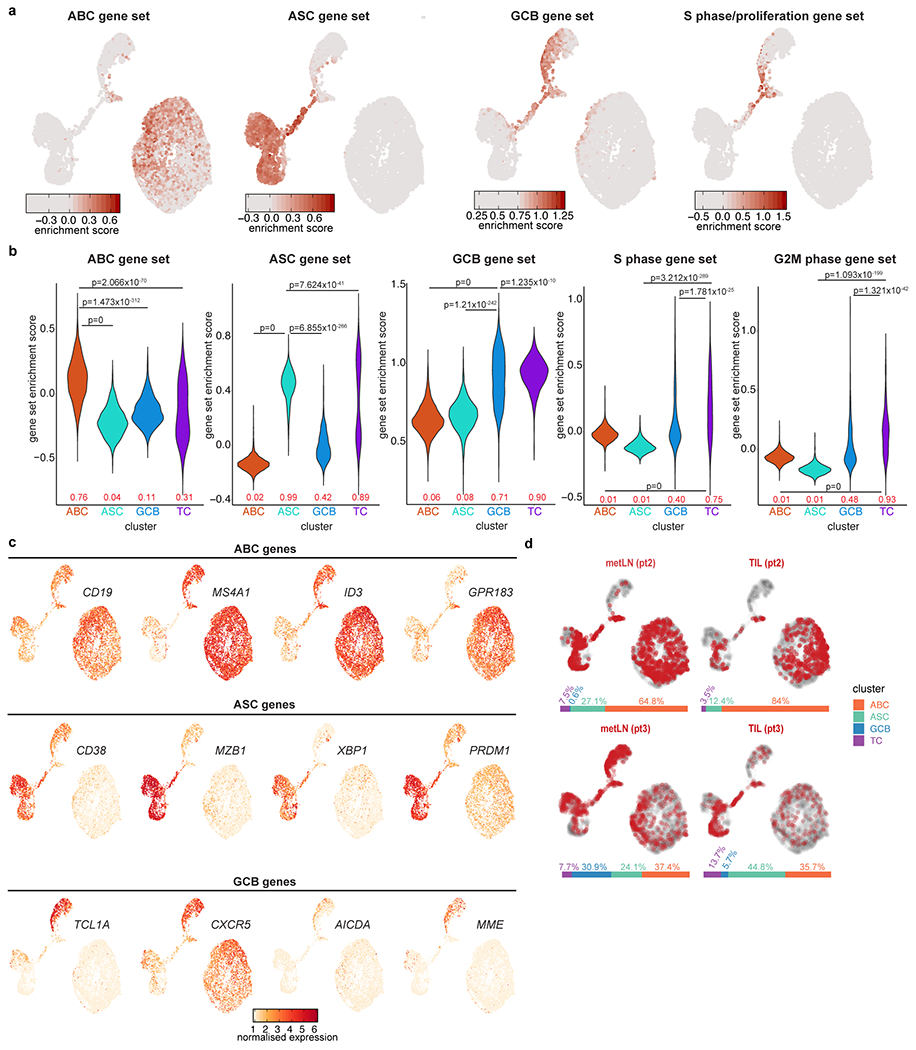
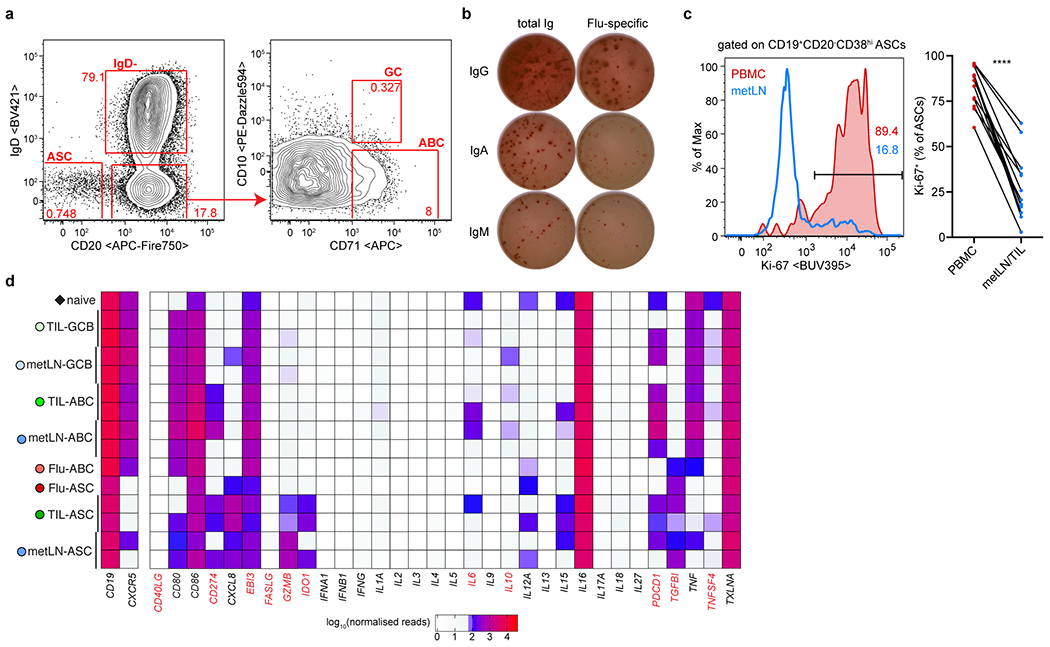
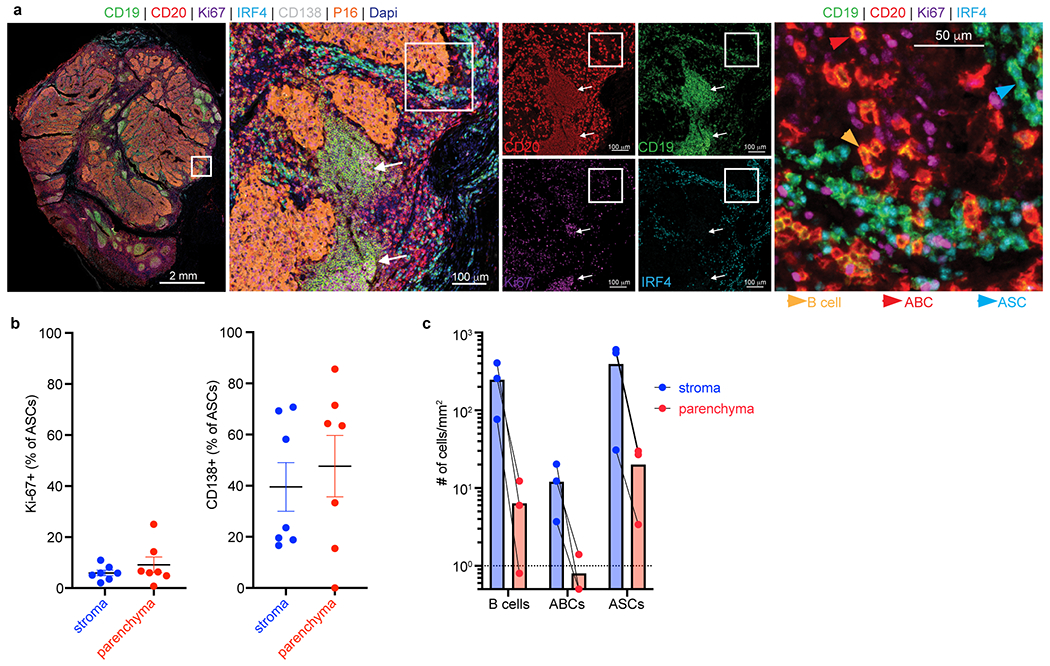
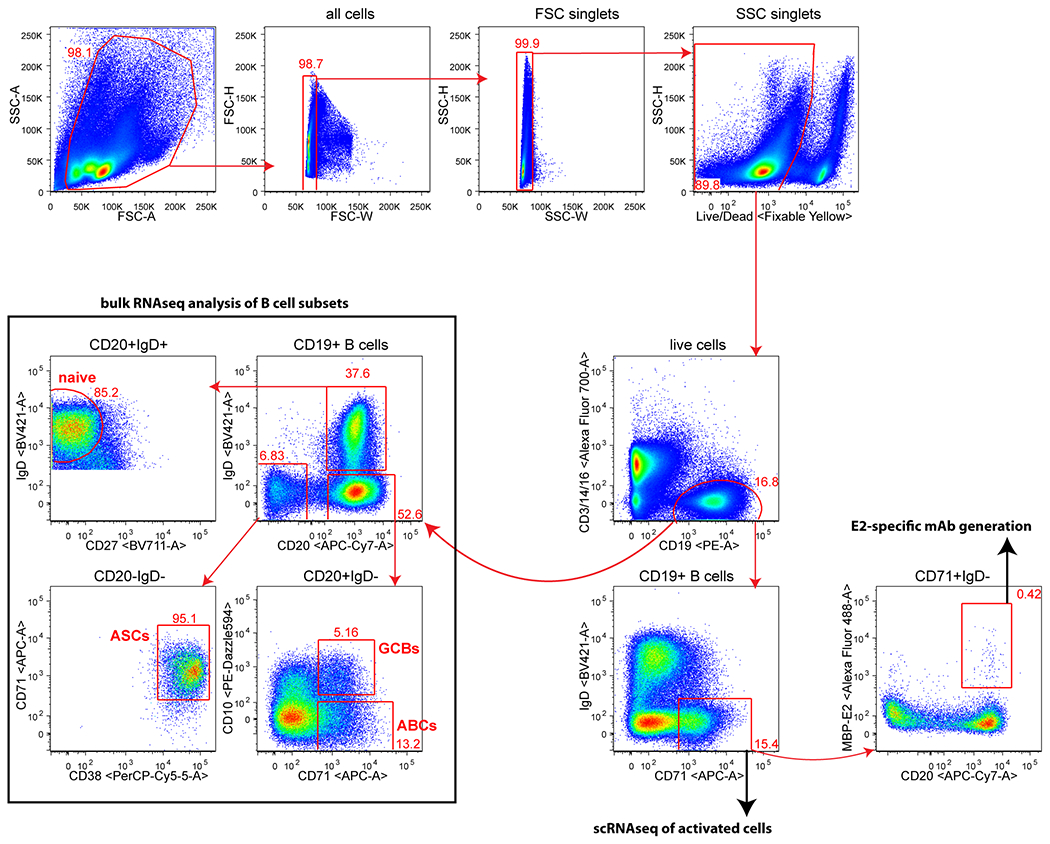
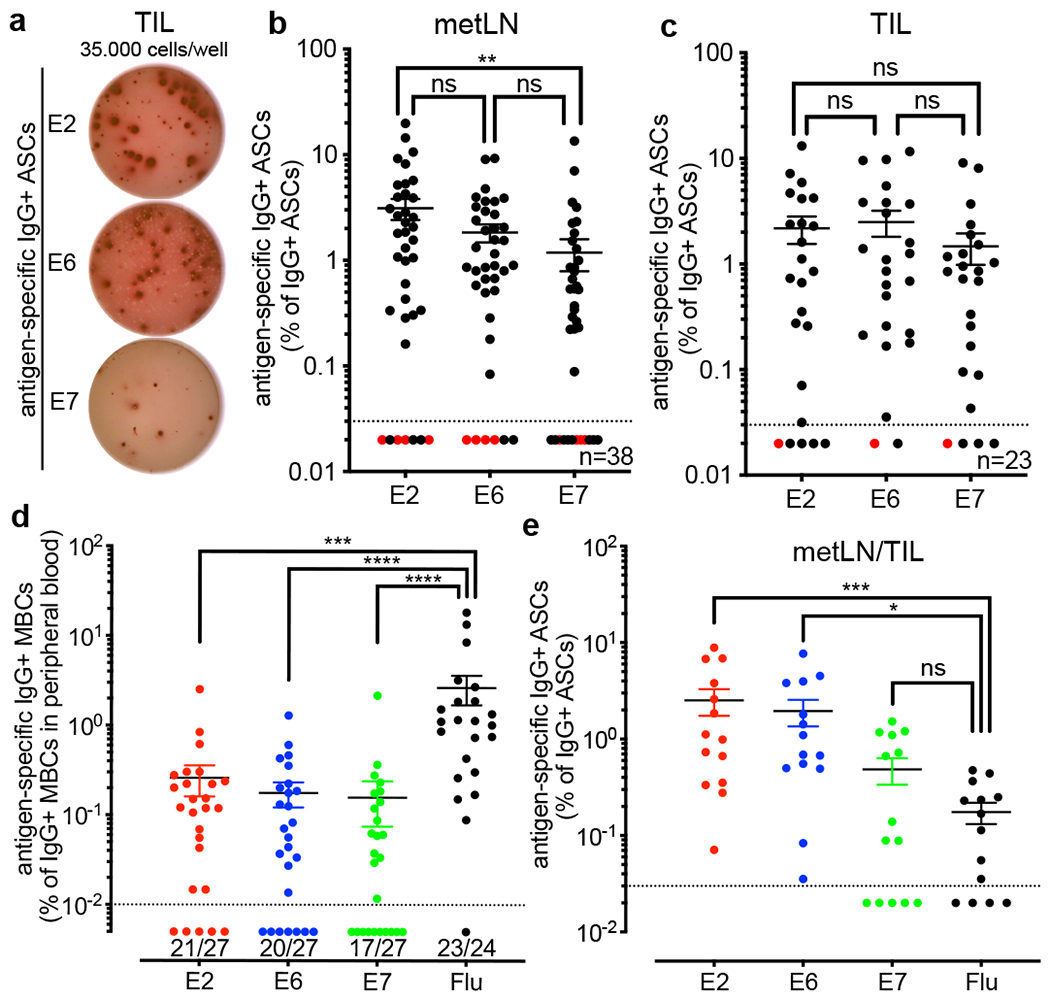
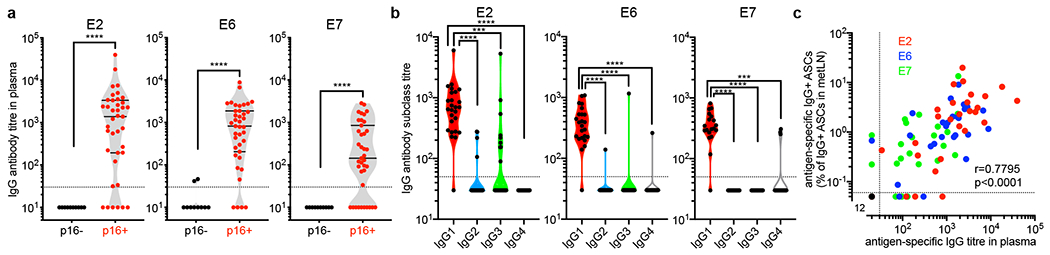
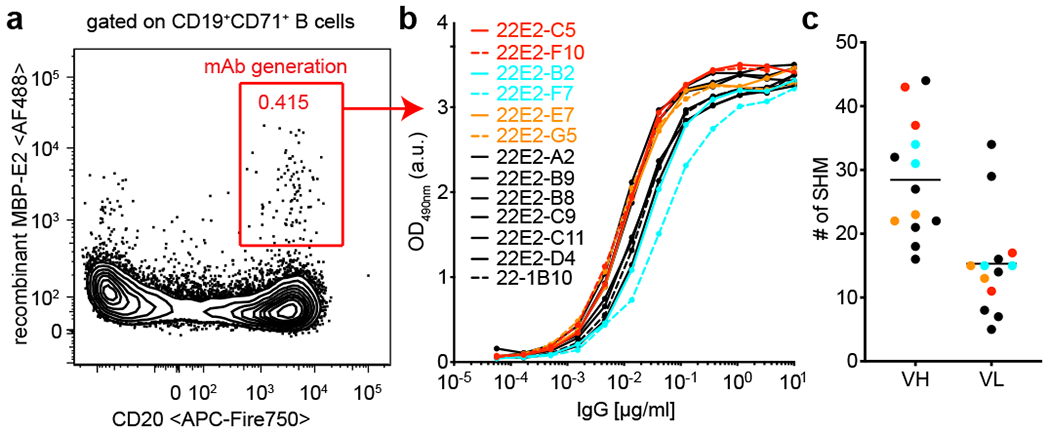
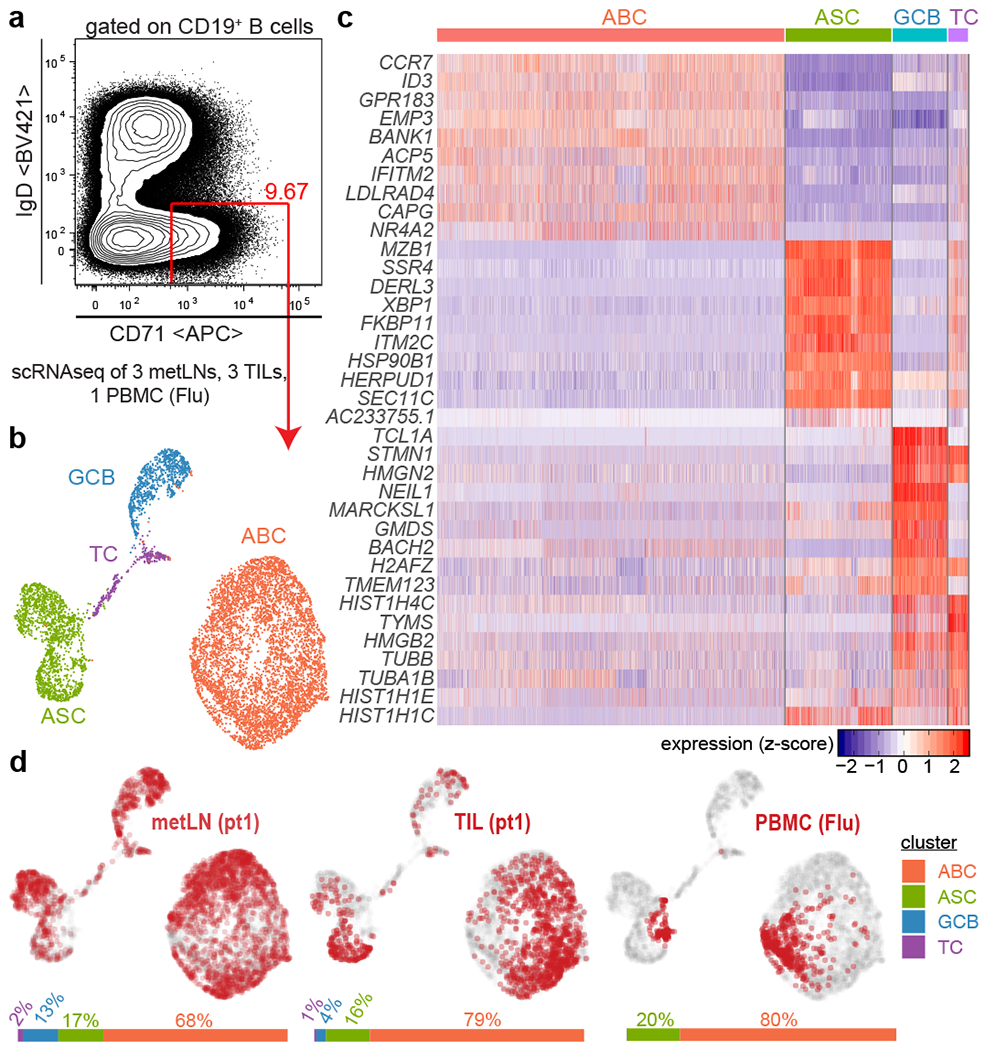
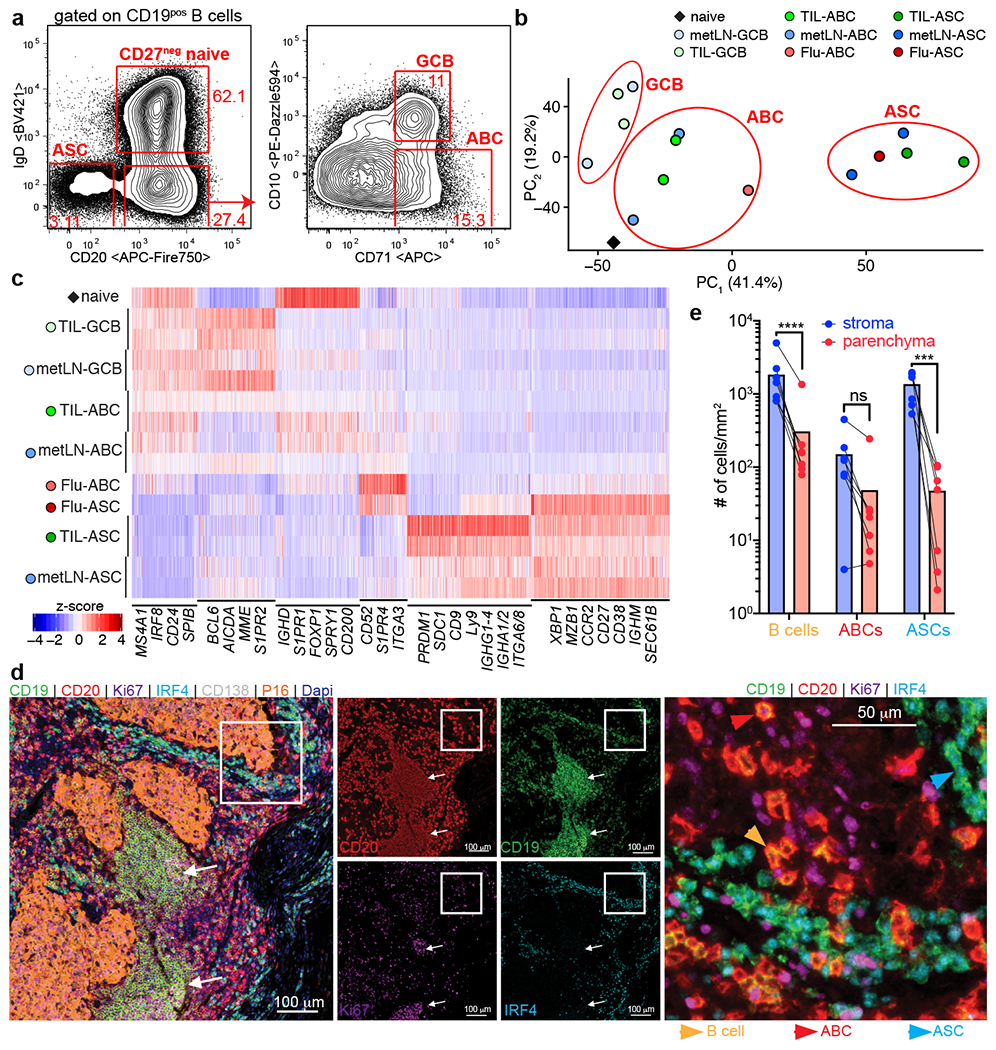
Tumours often contain B cells and plasma cells but the antigen specificity of these intratumoral B cells is not well understood1-8. Here we show that human papillomavirus (HPV)-specific B cell responses are detectable in samples from patients with HPV-positive head and neck cancers, with active production of HPV-specific IgG antibodies in situ. HPV-specific antibody secreting cells (ASCs) were present in the tumour microenvironment, with minimal bystander recruitment of influenza-specific cells, suggesting a localized and antigen-specific ASC response. HPV-specific ASC responses correlated with titres of plasma IgG and were directed against the HPV proteins E2, E6 and E7, with the most dominant response against E2. Using intratumoral B cells and plasma cells, we generated several HPV-specific human monoclonal antibodies, which exhibited a high degree of somatic hypermutation, consistent with chronic antigen exposure. Single-cell RNA sequencing analyses detected activated B cells, germinal centre B cells and ASCs within the tumour microenvironment. Compared with the tumour parenchyma, B cells and ASCs were preferentially localized in the tumour stroma, with well-formed clusters of activated B cells indicating ongoing germinal centre reactions. Overall, we show that antigen-specific activated and germinal centre B cells as well as plasma cells can be found in the tumour microenvironment. Our findings provide a better understanding of humoral immune responses in human cancer and suggest that tumour-infiltrating B cells could be harnessed for the development of therapeutic agents.


Conflict of interest statement

Competing interests A.W. and R.A. are inventors on a patent filed by Emory University relating to HPV-specific mAbs and HPV E2 as potential immunological target in HPV-positive cancers. All other authors declare no competing interests.

Figures

Extended Data Figure 1
Extended Data Figure 1. HPV-negative HNSCC patients exhibit reduced lymphocyte infiltration into the tumour and lack HPV-specific ASCs.
a, Sequencing-based HPV genotyping of p16+ HNSCC cases (n=32). b, Representative ELISPOT showing total antibody-secreting cells (ASCs) among lymphocytes from metastatic lymph node (metLN), primary tumour (TIL) and PBMC of a p16+ HNSCC patient. c-e, Summary graphs showing the frequency of ASCs producing IgG, IgA and IgM among lymphocytes from metLN (n=37) (c), TIL (n=22) (d) or PBMC (n=39) of p16+ HNSCC patients (e). Results with mean ± s.e.m. are shown. Friedman test with two-sided Dunn’s multiple comparisons test was performed for data in c-e. (c) ***p=0.0001, ****p<0.0001; (d) **p=0.0021, ****p<0.0001; (e) ****p<0.0001, ns=0.1720. f, Representative ELISPOT of E2/6/7-specific IgG-secreting ASCs in PBMC, metLN and TIL of a p16+ HNSCC patient. MBP (maltose-binding protein) indicates negative control. g, Correlation (Spearman) of antigen-specific IgG-secreting ASCs in metLN and TIL (n=18 patients) with r=0.7536 and p<0.0001.
Extended Data Figure 2
Extended Data Figure 2. HPV-negative HNSCC patients exhibit reduced lymphocyte infiltration into the tumour and lack HPV-specific ASCs.
a, Number of isolated lymphocytes per gram primary tumour in p16+ (n=35) and p16- (n=9) HNSCC patients. Two-tailed Mann-Whitney with ***p=0.0007. b, Frequency of ASCs producing IgG, IgA and IgM among lymphocytes from metLN of p16+ (n=37) and p16- (n=6 for IgG, n=5 for IgA and IgM) HNSCC patients. c, Frequency of E2/6/7-specific IgG-secreting ASCs among total IgG-secreting ASCs in metLN (n=6) and TIL (n=1) of p16- HNSCC patients. d, Frequency of E2/6/7- and Influenza (Flu)-specific IgG+ memory B cells (MBCs) among total IgG+ MBCs in the peripheral blood of p16+ (n=27) and p16- (n=9) HNSCC patients. Numbers indicate detected responses among tested samples. Results with mean ± s.e.m. are shown.
Extended Data Figure 3
Extended Data Figure 3. Serological analyses.
a-c, IgG titres against E2 (a), E6 (b), and E7 (c) in plasma of healthy individuals (n=50) and p16+ HNSCC patients (n=39). Results with median and quartiles are shown. Two-tailed Mann-Whitney with ****p<0.0001. d,e, E2/6/7-specific IgA (d) and IgM (e) titres in plasma of p16+ patients (n=39). f, E2/6/7-specific IgG titres in plasma of p16+ patients and graph demonstrating an IgG response against at least 2 HPV proteins in the vast majority of patients (n=39). Results with median and quartiles are shown. Friedman test with two-sided Dunn’s multiple comparisons test with ***p=0.0006, ns=0.1852. g, Heatmap showing E2/6/7-specific IgG antibody titres in p16+ HNSCC patients (n=39) with each column representing a patient. h, Correlation (Spearman) between E2/6/7-specific IgG+ ASCs in primary tumour and E2/6/7-specific IgG titres in plasma (n=18 patients) with r=0.7343 and p<0.0001.
Extended Data Figure 4
Extended Data Figure 4. Human monoclonal antibodies against HPV E antigens.
a, Clustered binding pattern of E2-specific mAbs performed by competition ELISA. Recognition of linear epitopes was determined by Western blot. b, ELISA of E6-specific mAbs (21E2, 21E11, 21H3) generated from single cell sorted ASCs from metLN of a HPV+ HNSCC patient. An E2-specific mAb (22B10) is shown as negative control. arbitrary units (a.u.). c, Number of somatic hypermutations (SHM) in the VH and VL chain of E6-specific mAbs (n=3) with indicated mean.
Extended Data Figure 5
Extended Data Figure 5. Activated cells of the B cell lineage from the tumour microenvironment are present in distinct clusters.
a, UMAP plots showing enrichment for activated B cell (ABC), antibody-secreting cell (ASC), germinal centre B cells (GCB) and proliferation gene sets. b, Violin plots showing gene set enrichment scores among the 4 clusters identified by scRNAseq. Two-sided Pearson’s Chi-squared test for binary variables with Yates continuity correction was performed (sample estimates in red). p values are indicated for select comparisons. c, UMAP plots showing expression of selected genes. d, UMAP plots showing distribution of cells of the indicated patient and tissue origin (in red) among the identified clusters. Bar graphs quantifying the composition of the respective sample in terms of frequency among the identified clusters: antibody-secreting cells (ASC), activated B cells (ABC), germinal centre B cells (GCB), and transitory cells (TC).
Extended Data Figure 6
Extended Data Figure 6. Gene expression of cytokines and other immunomodulators by B cells and plasma cells in the TME.
a, Flow plots showing the presence of ASCs and ABCs but absence of germinal centre (GC) B cells in the peripheral blood of a healthy volunteer 7 days post vaccination with Fluarix. b, ASC ELISPOT showing total IgG/A/M-secreting cells (upper panel) and influenza (Flu)-specific IgG/A/M-secreting cells (lower panel) in PBMCs 7 days post vaccination with Fluarix. c, Representative histogram of ASCs from peripheral blood (red) or metLN (blue) of HNSCC patients showing Ki-67 expression. Numbers indicate frequency of Ki-67+ cells among total ASCs. Summary graph showing paired frequencies of Ki-67-expressing ASCs in PBMCs and metLN/TIL (n=14). Paired two-tailed t-test with ****p<0.0001. d, Heatmap showing gene expression (normalised reads) of selected cytokines and immunomodulators as well as CD19 and CXCR5 as reference. Immunomodulators related to B cells and previously described as negative regulators in the TME are highlighted in red. An expression threshold was set to 50 normalised reads, with reads <50 displayed in white.
Extended Data Figure 7
Extended Data Figure 7. mIHC analysis of B cells and ASCs in the TME.
a, Representative mIHC section of HPV+ HNSCC tumour (n=7) with B cell infiltrates and associated germinal centres (white arrows) (see also main Fig.5e). 7-colour composite mIHC images of CD19, CD20, Ki-67, IRF4, CD138, P16, and DAPI (left panels), individual images of CD20, CD19, Ki-67, and IRF4 (middle panels), and high magnification (right panel) of a region of interest (white box). b, Frequency of Ki-67+ and CD138+ ASCs (CD19+CD20-IRF4+) in mIHC sections of 7 HPV+ HNSCC tumours. Results with mean ± s.e.m. are shown. c, Quantification of B cells (CD19+CD20+), ABCs (CD19+CD20+Ki-67+), and ASCs (CD19+CD20-IRF4+) in the stroma and tumour parenchyma of 3 HPV- HNSCC patients.
Extended Data Figure 8
Extended Data Figure 8. Gating strategy for isolation/analysis of B cell subsets.
Gating strategy for B cell subsets used for flow cytometric analyses, bulk RNAseq analyses, scRNAseq analyses, or the generation of E2-specific monoclonal antibodies (mAbs). B cell subsets used for bulk RNAseq analyses are highlighted in red: antibody-secreting cells (ASCs), activated B cells (ABCs), germinal centre B cells (GCBs).
Figure 1
Figure 1. HPV-specific antibody-secreting cells are present in the TME of HPV-positive HNSCC patients.
a, ELISPOT showing E2/6/7-specific IgG-secreting ASCs in tumour (TIL). b, c, Frequency of E2/6/7-specific IgG-secreting ASCs among total IgG-secreting ASCs in metastatic lymph node (metLN; n=38) (b) and TIL (n=23) (c). Patients without any responses in red. d, Frequency of E2/6/7- (n=27) and Influenza (Flu)-specific (n=24) IgG+ memory B cells (MBCs) among total IgG+ MBCs in blood. e, Frequency of E2/6/7- and Influenza (Flu)-specific IgG+ ASCs among total IgG+ ASCs in metLN/TIL (n=14). Results with mean ± s.e.m. Friedman test with two-sided Dunn’s multiple comparisons test with *p<0.05, **p<0.01, ***p<0.001, ****p<0.0001, ns not significant.
Figure 2
Figure 2. HPV-specific IgG antibody titres correlate with HPV-specific IgG-secreting cells in the TME.
a, E2/6/7-specific IgG plasma titres of p16- (n=10) and p16+ (n=39) HNSCC patients. Results with median and quartiles. Two-tailed Mann-Whitney with ****p<0.0001. b, IgG subclass titres against E2 (n=26), E6 (n=24), and E7 (n=19). Friedman test with two-sided Dunn’s multiple comparisons test with ***p<0.001, and ****p<0.0001. c, Correlation (Spearman) between E2/6/7-specific IgG+ ASCs in metLN and E2/6/7-specific IgG plasma titres (n=30 patients).
Figure 3
Figure 3. Generation of human monoclonal antibodies against HPV from HNSCC patients.
a, Flow plot showing E2-specific activated B cells (CD3/14/16CD19+CD20+IgDCD71+MBP-E2+) used for E2-specific mAb generation. b, ELISA of generated E2-specific mAbs (colours indicate clonally-related mAbs). arbitrary units (a.u.) c, Number of somatic hypermutations (SHM) in variable heavy (VH) and light (VL) chain of E2-specific mAbs (n=13) with indicated mean.
Figure 4
Figure 4. The tumour microenvironment contains activated B cells, germinal centre B cells and ASCs.
Activated B cell populations from metLN and TIL of 3 HPV+ HNSCC patients as well as PBMCs of an Influenza vaccinee were subjected to scRNA-seq. a, Flow plot of CD19+ B cells from metLN showing activated CD71high cells (red gate). b, UMAP plot showing 4 identified clusters with cells obtained from PBMC (Flu), metLNs, and TILs. c, Heatmap showing relative expression of the top differentially expressed genes of each cluster. d, UMAP plots showing distribution of cells of the indicated patient and tissue origin (in red) among the identified clusters.
Figure 5
Figure 5. Transcriptomic and spatial characterisation of B cells and plasma cells in the tumour microenvironment.
a, Flow plots of CD19+ B cells from metLN highlighting the gating strategy for naïve B cells, ASCs, ABCs and GCBs for subsequent RNA-seq. b, Principal component analysis. c, Heatmap showing relative expression of differentially expressed genes across groups. Selected genes with high expression in individual clusters are indicated. d, Representative multiplex immunohistochemistry of HPV+ HNSCC tumours (n=7) with B cell infiltrates and associated germinal centres (white arrows). e, Quantification of B cells, ABCs, and ASCs in stroma and p16+ tumour parenchyma of 7 HPV+ HNSCC patients. Two-way RM ANOVA with Sidak’s multiple comparison with ***p<0.001, ****p<0.0001, ns not significant.

Comment in

References

    1. Cabrita R et al. Tertiary lymphoid structures improve immunotherapy and survival in melanoma. Nature 577, 561–565, doi:10.1038/s41586-019-1914-8 (2020). - DOI - PubMed
    1. Helmink BA et al. B cells and tertiary lymphoid structures promote immunotherapy response. Nature 577, 549–555, doi:10.1038/s41586-019-1922-8 (2020). - DOI - PMC - PubMed
    1. Petitprez F et al. B cells are associated with survival and immunotherapy response in sarcoma. Nature 577, 556–560, doi:10.1038/s41586-019-1906-8 (2020). - DOI - PubMed
    1. Flynn NJ, Somasundaram R, Arnold KM & Sims-Mourtada J The Multifaceted Roles of B Cells in Solid Tumors: Emerging Treatment Opportunities. Target. Oncol 12, 139–152, doi:10.1007/s11523-017-0481-x (2017). - DOI - PubMed
    1. Yuen GJ, Demissie E & Pillai S B lymphocytes and cancer: a love-hate relationship. Trends Cancer 2, 747–757, doi:10.1016/j.trecan.2016.10.010 (2016). - DOI - PMC - PubMed

Additional references for methods section

    1. Kamphorst AO et al. Rescue of exhausted CD8 T cells by PD-1-targeted therapies is CD28-dependent. Science 355, 1423–1427, doi:10.1126/science.aaf0683 (2017). - DOI - PMC - PubMed
    1. de Leon DC et al. Human papillomavirus (HPV) in breast tumors: prevalence in a group of Mexican patients. BMC Cancer 9, 26, doi:10.1186/1471-2407-9-26 (2009). - DOI - PMC - PubMed
    1. Smith K et al. Rapid generation of fully human monoclonal antibodies specific to a vaccinating antigen. Nat. Protoc 4, 372–384, doi:10.1038/nprot.2009.3 (2009). - DOI - PMC - PubMed
    1. Satija R, Farrell JA, Gennert D, Schier AF & Regev A Spatial reconstruction of single-cell gene expression data. Nat. Biotechnol 33, 495–502, doi:10.1038/nbt.3192 (2015). - DOI - PMC - PubMed
    1. Stuart T et al. Comprehensive Integration of Single-Cell Data. Cell 177, 1888–1902 e1821, doi:10.1016/j.cell.2019.05.031 (2019). - DOI - PMC - PubMed

Publication types

MeSH terms