. 2020 Dec;588(7836):164-168.
doi: 10.1038/s41586-020-2925-1. Epub 2020 Nov 18.

Small-molecule-induced polymerization triggers degradation of BCL6

Affiliations

Small-molecule-induced polymerization triggers degradation of BCL6

Mikołaj Słabicki et al. Nature. 2020 Dec.

Abstract

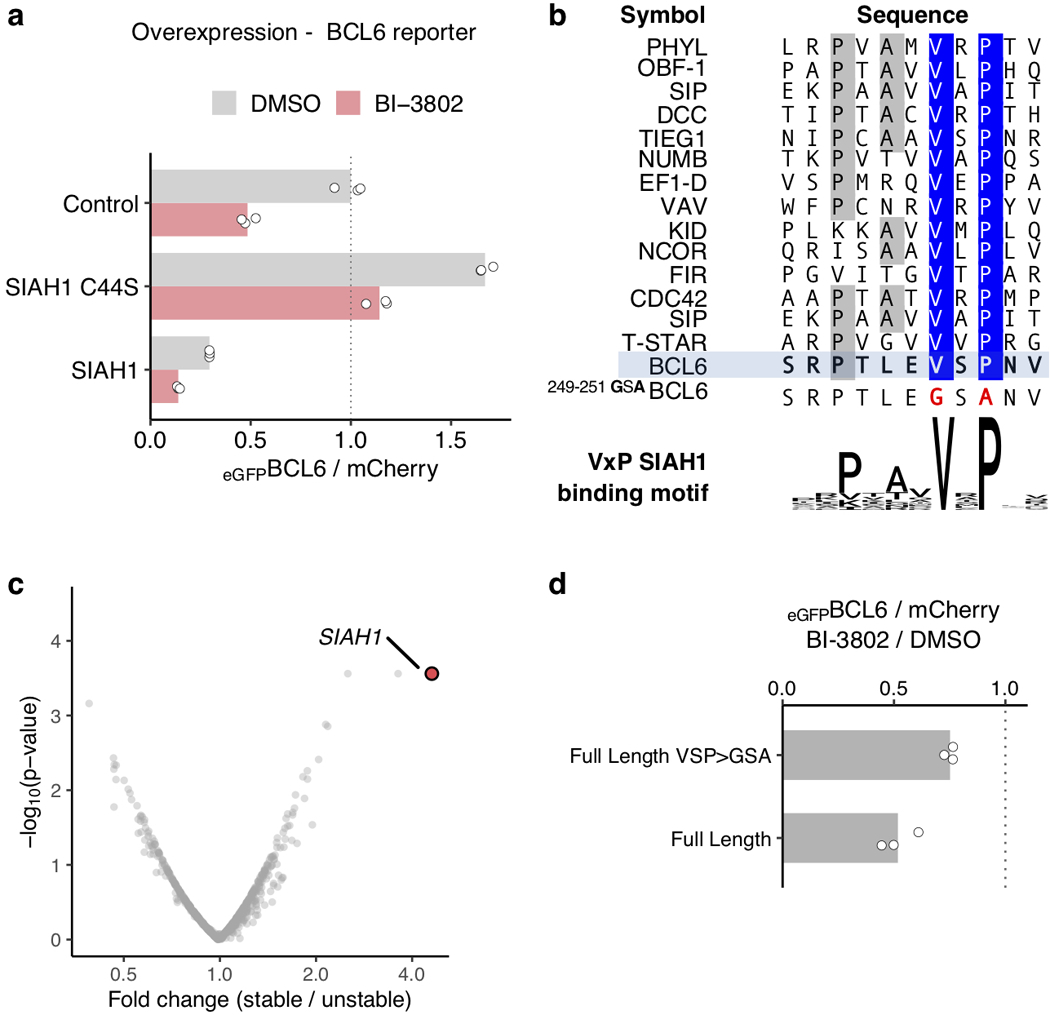
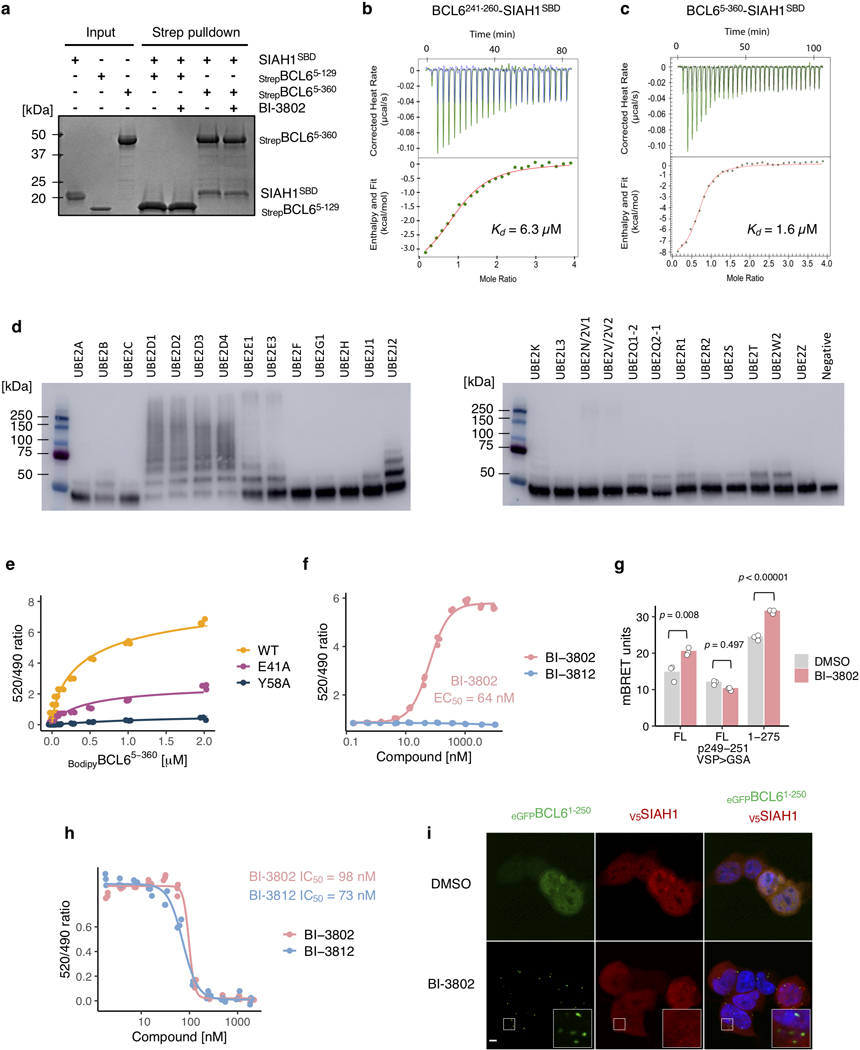
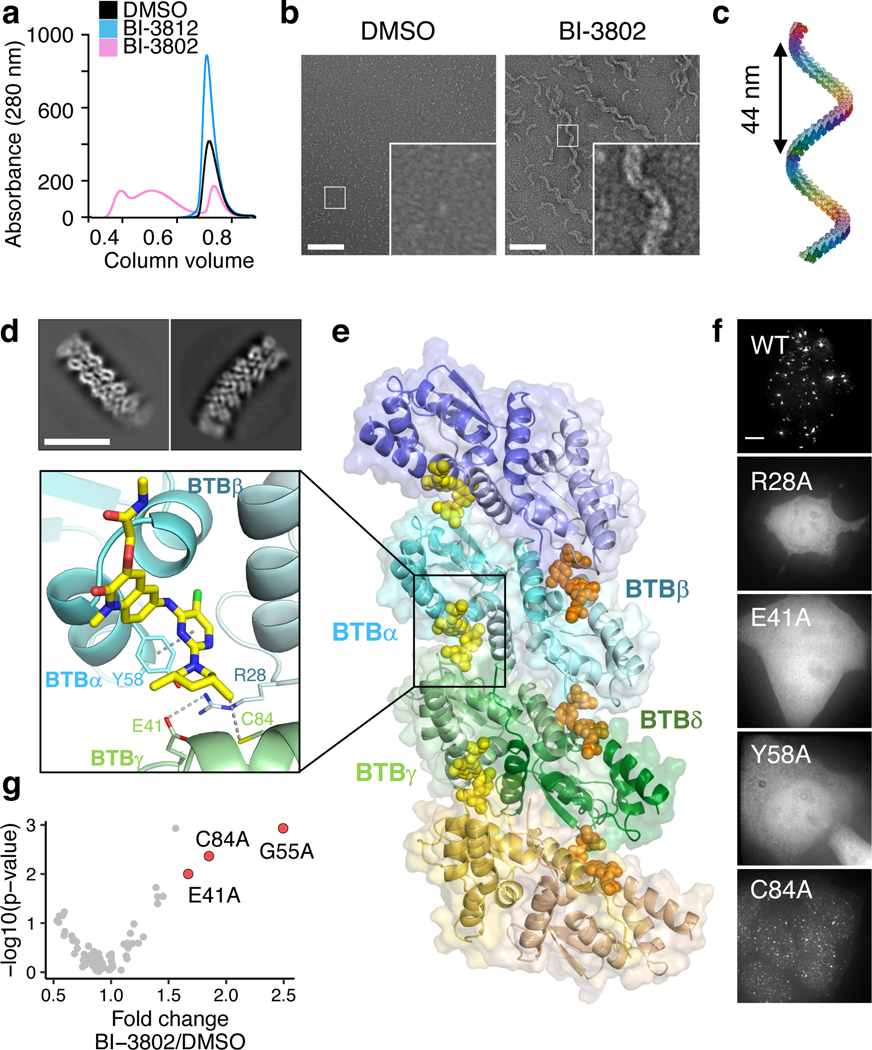
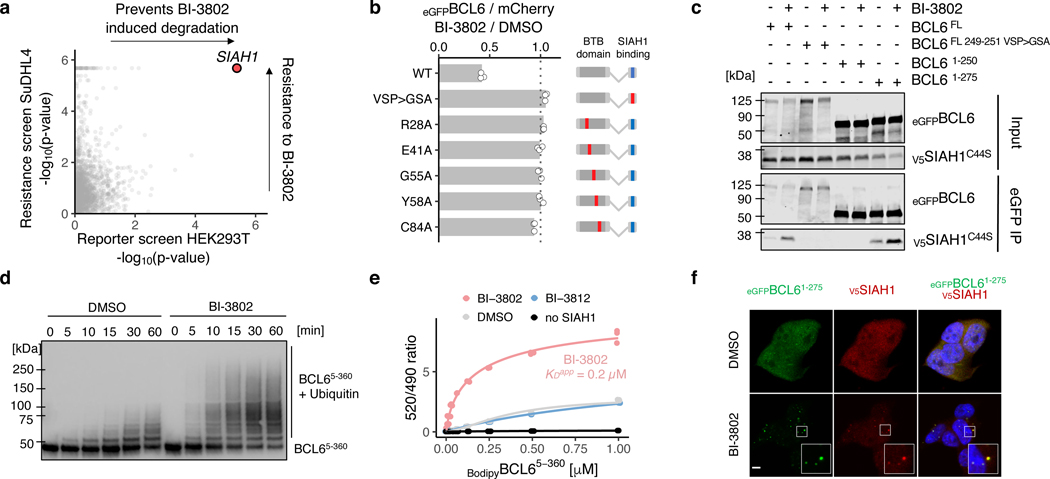
Effective and sustained inhibition of non-enzymatic oncogenic driver proteins is a major pharmacological challenge. The clinical success of thalidomide analogues demonstrates the therapeutic efficacy of drug-induced degradation of transcription factors and other cancer targets1-3, but a substantial subset of proteins are resistant to targeted degradation using existing approaches4,5. Here we report an alternative mechanism of targeted protein degradation, in which a small molecule induces the highly specific, reversible polymerization of a target protein, followed by its sequestration into cellular foci and subsequent degradation. BI-3802 is a small molecule that binds to the Broad-complex, Tramtrack and Bric-à-brac (BTB) domain of the oncogenic transcription factor B cell lymphoma 6 (BCL6) and leads to the proteasomal degradation of BCL66. We use cryo-electron microscopy to reveal how the solvent-exposed moiety of a BCL6-binding molecule contributes to a composite ligand-protein surface that engages BCL6 homodimers to form a supramolecular structure. Drug-induced formation of BCL6 filaments facilitates ubiquitination by the SIAH1 E3 ubiquitin ligase. Our findings demonstrate that a small molecule such as BI-3802 can induce polymerization coupled to highly specific protein degradation, which in the case of BCL6 leads to increased pharmacological activity compared to the effects induced by other BCL6 inhibitors. These findings open new avenues for the development of therapeutic agents and synthetic biology.


Figures

Extended Data Fig. 1. |
Extended Data Fig. 1. |. Characterization of BI-3802-induced BCL6 degradation.
a, Immunoblots of BCL6 levels in cytoplasmic, nuclear or chromatin bound fractions of SuDHL4Cas9 cells after 24 hours DMSO or 1 μM BI-3802 treatment (n = 2). b, mRNA levels quantified by qPCR in SuDHL4Cas9 cells after treatment with 1 μM BI-3802 or DMSO for 1 hour (bars represent mean and s.d., n = 3). c, Whole proteome quantification of SuDHL4Cas9 cells treated with 1 μM BI-3812 (n = 1) or DMSO (n = 3) for 4 hours (two-sided moderated t-test, n = 3). d, Immunoblots of BCL6 levels in SuDHL4Cas9 cells treated with 10 μM MG132 (26S proteasome inhibitor) for 1 hour, 1 μM BI-3802 for 45 minutes and 10 μM BI-3812 for 10 minutes. A subset of the polymerized BCL6 was insoluble and lost during the western blot sample preparation, however, treatment with an excess of BI-3812 shortly before protein harvest reverts polymerization, solubilized BCL6, and allowed for reliable quantification (n = 2). e, Immunoblots of BCL6 levels in SuDHL4Cas9 cells treated with DMSO, 10 μM MLN7243 (ubiquitin activating enzyme inhibitor), 10 μM MG132 (26S proteasome inhibitor), 10 μM Chloroquine (lysosomal inhibitor), or 5 μM MLN4924 (neddylation inhibitor) for 15 minutes, then, for indicated samples, 1 μM BI-3802 was added and 35 minutes later, 10 μM BI-3812 was added for the final 10 minutes, resulting in a total of 1 hour treatment with MLN7243, MG132, Chloroquine, and MLN4924, 45 minutes of BI-3802, and 10 minutes with BI-3812 (n = 2). f, Cytospin immunofluorescence images of SuDHL4Cas9 cells treated with DMSO (left) or 0.5 μM MLN7243 for 2 hours and 1 μM BI-3802 (right) for 1 hour. Scale bar is 5 μm (n = 2). g, Flow cytometry analysis of HEK293TCas9 cells expressing the eGFPBCL61−275 which were exposed simultaneously to the indicated concentrations of BI-3802 and BI-3812 for 24 hours. Lines represent standard four parameter log-logistic curve fit (n = 3).
Extended Data Fig. 2 |
Extended Data Fig. 2 |. Computational docking of BCL6 helical filaments models with distinct binding modes.
Visualization of top scoring BCL6-BTB domain filament model from three different binding modes: end-to-end (E2E), face-to-end (F2E) and face-to-face (F2F). Each BTB monomer used for building the tetramer model is labeled in a distinct color. BI-3802 is visualized as a sphere. The interface score is an estimate of the binding energy between the dimers. The helical pitch was calculated by extending the tetramer. Sub-angstrom variations in the F2F binding mode has a profound effect on helical pitch (>10 nm).
Extended Data Fig. 3. |
Extended Data Fig. 3. |. Structure determination of BCL6 filaments by cryo-EM.
a, Representative cryo-EM micrograph at −2 μm defocus. Micrograph was low-pass filtered. Scale bar is 100 nm. b, Local resolution map of the final reconstruction with a threshold of 0.0154 (Chimera) calculated using Relion 3.0. c, Data processing scheme for the BCL6 filaments. Iterative 2D classifications resulted in 274,999 particles. Multiple subsequent rounds of 3D classification, refinement, and polishing improved map resolution to a final overall resolution of 3.7 Å. Percentages refer to the particles in each class. Red density maps indicate the classes that were used for the next round of processing, while blue density maps are from 3D refinements. d, Fourier shell correlation (FSC) plots for unmasked and masked maps. Overall resolution is indicated at FSC = 0.143. e, Histogram and directional FSC plot for BCL6 cryo-EM map. f, g, Regions of the cryo-EM model for the BCL6 filament fit into the density map, demonstrating side chain density for multiple residues. Each density is shown at a threshold of 0.0178 (from Chimera).
Extended Data Fig. 4. |
Extended Data Fig. 4. |. Structural details of BI-3802-induced BCL6 filaments.
a, Density for BI-3802 in the 3.7 Å cryo-EM reconstruction. The crystal structure of BCL6 bound to BI-3802 (PDB: 5MW2) was docked into the cryo-EM map and refined using phenix.real_space_refine. The cryo-EM density is shown in grey at a threshold of 0.0178 (from Chimera). b, Density of BI-3802 and key interacting residues (R28, E41, Y58, C84) for BCL6 polymerization. Each density in mesh is shown at a threshold of 0.0178 (from Chimera). c, d, Comparison of the cryo-EM model of polymerized BCL6 (white) with the BCL6 crystallographic lattice (yellow, PDB: 5MW2) for c, dimer-dimer, and d, filament. e, Superimposed structures of BI-3802 (yellow) and BI-3812 (orange) bound to the BCL6 filament. BI-3812 was docked to the crystal structure of BCL6-BTB (PDB: 5MW2), which was then aligned to the BI-3802-mediated BCL6 filament model. The solvent exposed moiety of the inhibitor is clashing with the adjacent BCL6 dimer (grey). f, Preassembled 0.1 μM FITCBCoR peptide and 0.1 μM BiotinBCL65−129 variants were exposed to increasing concentration of BI-3802, and the signal measured by TR-FRET. Interaction of BCL6 with the BCOR co-repressor peptide was used to quantitively determine drug binding. Lines represent standard four parameter log-logistic curve fit (n = 3).
Extended Data Fig. 5. |
Extended Data Fig. 5. |. Analysis of BCL6-BTB variants in vivo.
a, Schematic of alanine mutagenesis resistance screen of the BCL6-BTB domain in SuDHL4Cas9 cells. b, SuDHL4Cas9, RajiCas9 (both BCL6-dependent) and DELCas9 (BCL6-independent) cells were infected with the indicated BCL6 variants and treated with 1 μM BI-3802 or DMSO over 21 days. Lines represent measurement from each replicate (n = 2). c, Schematic of alanine mutagenesis reporter screen of the BCL6-BTB domain in HEK293TCas9 cells. d, Alanine mutagenesis screen of the BCL6-BTB domain for impaired BI-3802 induced degradation at 1 μM BI-3802 in HEK293TCas9 cells. Mutations that confer resistance are labeled. Four different codons were collapsed to each unique amino acid position ( > 3-fold enrichment, p-value <10−4; n = 2; 4 codons/position; two-sided empirical rank-sum test-statistics). e, Correlation of BCL6 mRNA expression (TPM) and BCL6 dependency (CERES score) in a set of 559 cancer cell lines from the Dependency Map Project. Cell lines chosen for experiments are labeled. f, BI-3802 in the polymerization interface. Residues identified in the alanine scan are highlighted, with the following color code: orange – G55, Y58 (residues involved in drug binding), magenta – E41, C84 (residues involved in polymerization). Hydrogen atoms in G55 are depicted as spheres.
Extended Data Fig. 6. |
Extended Data Fig. 6. |. Genome-wide CRISPR-Cas9 screens to identify the molecular machinery involved in BI-3802-induced degradation of BCL6.
a, Schematic of the BCL6 stability reporter-based sorting screen. b, c, Genome-wide CRISPR-Cas9 knockout screen for eGFPBCL6 stability in HEK293TCas9 cells after 16 hours of treatment with 1 μM BI-3802 or DMSO. Results for SIAH1 and FBXO11 (a previously reported E3 ligase involved in BCL6 endogenous degradation) are labeled. Guides were collapsed to gene level (n = 3; 4 guides/gene; two-sided empirical rank-sum test-statistics). d, Normalized read counts in each sorted gate for 4 sgRNAs targeting SIAH1 and 4000 non-targeting controls (NTC). Symbols indicate the mean normalized read numbers for each sgRNA. (n = 3). e, Flow cytometry analysis of HEK293TCas9 cells expressing the full length eGFPBCL6 reporter and individual sgRNAs after 4 hours treatment with DMSO or 1 μM BI-3802. Bars represent mean (n = 3). f, Schematic of the genome-wide CRISPR-Cas9 resistance screen. g, Genome-wide CRISPR-Cas9 knockout screen for resistance to BI-3802. Guides were collapsed to gene level (n = 3; 4 guides/gene; two-sided empirical rank-sum test-statistics). h, Flow cytometry analysis of SuDHL4Cas9 cells expressing sgRNAs and blue florescent protein (marker) exposed to DMSO or 1 μM BI-3802. Lines represent measurement from each replicate (n = 3).
Extended Data Fig. 7. |
Extended Data Fig. 7. |. SIAH1 induces degradation of BCL6 via VxP motif.
a, Flow cytometry analysis of HEK293TCas9 cells expressing full length eGFPBCL6 stability reporter and vectors expressing no-insert control, SIAH1 or SIAH1C44S, exposed to DMSO or BI-3802 for 2 hours. Bars represent the mean (n = 3). b, Alignment of the BCL6 SIAH1 recognition site with previously published peptide sequences recognized by SIAH1 with inferred consensus SIAH1 binding site. c, CRISPR-Cas9 knockout screen with the Bison library for eGFPBCL6AA1−129+241−260 stability in HEK293TCas9 cells after 16 hours of treatment with 1 μM BI-3802 or DMSO. Guides were collapsed to gene level (n = 1; 4 guides/gene; two-sided empirical rank-sum test-statistics). d, Flow cytometry analysis of HEK293TCas9 cells expressing eGFPBCL6FL or eGFPBCL6FL VSP>GSA treated with DMSO or 1 μM BI-3802 for 7 hours (bars represent mean, n = 3).
Extended Data Fig. 8. |
Extended Data Fig. 8. |. Characterization of SIAH1-mediated degradation of polymerized BCL6.
a, SDS-page gel analysis of the in vitro pull-down between recombinant SIAH1SBD and recombinant StrepBCL6 in the presence of BI-3802 or DMSO. Strep, strep•Tag II (n = 2). b, Titration of BCL6241−260 peptide binding to SIAH1SBD using isothermal calorimetry (n = 1). c, Titration of SIAH1SBD binding to BCL65−360 using isothermal calorimetry (n = 1). d, Recombinant StrepBCL65−360 was combined with full length SIAH1 and a panel of E2 enzymes (Boston Biochem) and screened for ubiquitination activity in vitro. Samples were analyzed by western blot and visualized by strep•Tag II antibody-HRP conjugate (n = 1). e, BodipyBCL65−360 variants (WT, E41A, Y58A) were titrated to 0.2 μM BiotinSIAH1SBD in presence of 2 μM BI-3802, and the signal was measured by TR-FRET. Dots represent mean. Lines represent standard four parameter log-logistic curve fit (n = 3). f, Preassembled 0.2 μM BodipyBCL65−360 and 0.2 μM BiotinSIAH1SBD were exposed to increasing concentration of BI-3802 or BI-3812, and the signal was measured by TR-FRET. Dots represent mean. Lines represent standard four parameter log-logistic curve fit (n = 3). g, HEK293T cells transiently transfected with Nano-LuciferaseSIAH1C44S and HaloTagBCL6 constructs were treated with DMSO, 1 μM BI-3802 or 1 μM BI-3812 for 2 hours and the mBRET signal was measured. Bars represent mean (n = 3). One-sided t-test. h, Preassembled 0.1 μM FITCBCoR peptide and 0.1 μM BiotinBCL65−129 were exposed to increasing concentration of BI-3802 or BI-3812, and the signal measured by TR-FRET. Lines represent standard four parameter log-logistic curve fit (n = 3). i, HEK293TCas9 cells expressing the eGFPBCL61−250 stability reporter and V5SIAH1 were treated with 0.5 μM MLN7243 for 2 hours and 1 μM BI-3802 for 1 hour. Cells were imaged by indirect immunofluorescence as indicated. Scale bar is 5 μm (n = 2).
Fig. 1 |
Fig. 1 |. BI-3802 treatment induces reversible BCL6 foci formation in vivo.
a, Chemical structures of BI-3802 (BCL6 degrader) and BI-3812 (BCL6 inhibitor) with solvent exposed moieties in red and blue respectively. b, Whole-proteome quantification of SuDHL4Cas9 cells treated with 1 μM BI-3802 (n = 1) or DMSO (n = 3) for 4 hours (two-sided moderated t-test, n = 3). c, Schematic of the BCL6 stability reporter. d, Flow cytometry analysis of HEK293TCas9 cells expressing the full length eGFPBCL6FL reporter after treatment with DMSO, 0.5 μM MLN7243, 5 μM MLN4924 or 10 μM MG132 for 3 hours in total. After 2 hours, DMSO, 1 μM BI-3812 or 1 μM BI-3802 were added for 1 hour (bars represent mean, n = 3). e, Flow cytometry analysis of HEK293TCas9 cells expressing the indicated BCL6 reporter treated with DMSO or 1 μM BI-3802 for 7 hours (bars represent mean, n = 3). f, g, Localization of eGFPBCL61−275 or eGFPBCL61−250 expressed in HEK293TCas9 cells treated with DMSO, 1 μM BI-3802 or 10 μM BI-3812 (n = 2). Scale bars are 5 μm.
Fig. 2. |
Fig. 2. |. BI-3802 induces helical filament of BCL6 in vitro.
a, Size-exclusion chromatogram of purified BCL65−360 in DMSO, 2 μM BI-3812 or 2 μM BI-3802. b, Negative stain electron microscopy micrographs of BCL65−360 protein in DMSO or 20 μM BI-3802. Scale bars are 100 nm (n > 10 images). c, A BCL6-BTB filament constructed by extending the F2F_2 model (Extended Data Fig. 2) by RosettaDock. d, Reference-free 2D class averages for a BCL6-BTB filament. Scale bar is 10 nm. e, Cryo-EM model of the BCL6-BTB filament with BI-3802. Each BCL6 dimer is labeled in a distinct color. Close-up of the interface highlighting critical residues for polymerization. f, Localization of eGFPBCL6 alanine mutants after treatment with 0.5 μM MLN7243 (3 hours) and 1 μM BI-3802 (1 hour) (n = 2). Scale bars are 5 μm. g, Alanine mutagenesis screen of BCL6-BTB domain for resistance to 1 μM BI-3802 in SuDHL4Cas9 cells. Mutations that confer resistance are labeled. Four different codons were collapsed to each unique amino acid position (> 1.6-fold enrichment, p-value <10−2; n = 2; 4 codons/position; two-sided empirical rank-sum test-statistics).
Fig. 3. |
Fig. 3. |. BCL6 polymerization enhances SIAH1 interaction and ubiquitination.
a, Correlation of p-values for two genome-wide CRISPR-Cas9 knockout screens: x-axis - reporter screen for eGFPBCL6 stability in HEK293TCas9 cells upon BI-3802 treatment, and y-axis - BI-3802 resistance screen in SuDHL4Cas9 cells. Guides were collapsed to gene level (n = 3; 4 guides/gene; two-sided empirical rank-sum test-statistics). b, Flow cytometry analysis of HEK293TCas9 cells expressing the indicated BCL6-BTB domain fusion construct treated with DMSO or 1 μM BI-3802 for 7 hours (bars represent mean, n = 3). c, Immunoblots of eGFP immunoprecipitation in the presence of 2μM BI-3802 or DMSO from HEK293TCas9 cells transduced with indicated eGFPBCL6 constructs and V5SIAH144C>S (n = 2). d, Immunoblots of StrepBCL65−360 in vitro ubiquitination by SIAH1FL in the presence of DMSO or 1 μM BI-3802 (n = 2). e, BodipyBCL65−360 was titrated to 0.2 μM BiotinSIAH1SBD in DMSO, 2 μM BI-3812, or 2 μM BI-3802, and the signal was measured by TR-FRET. Lines represent standard four parameter log-logistic curve fit (n = 3). f, HEK293TCas9 cells expressing the eGFPBCL61−275 reporter and V5SIAH1 were treated with 0.5 μM MLN7243 for 2 hours, and 1 μM BI-3802 for 1 hour. Cells were imaged by indirect immunofluorescence as indicated (n = 2). Scale bar is 5 μm.

Comment in

References

Main References

    1. Kronke J. et al. Lenalidomide causes selective degradation of IKZF1 and IKZF3 in multiple myeloma cells. Science 343, 301–305, doi:10.1126/science.1244851 (2014). - DOI - PMC - PubMed
    1. Lu G. et al. The myeloma drug lenalidomide promotes the cereblon-dependent destruction of Ikaros proteins. Science 343, 305–309, doi:10.1126/science.1244917 (2014). - DOI - PMC - PubMed
    1. Kronke J. et al. Lenalidomide induces ubiquitination and degradation of CK1alpha in del(5q) MDS. Nature 523, 183–188, doi:10.1038/nature14610 (2015). - DOI - PMC - PubMed
    1. Huang HT et al. A Chemoproteomic Approach to Query the Degradable Kinome Using a Multi-kinase Degrader. Cell Chem Biol 25, 88–99 e86, doi:10.1016/j.chembiol.2017.10.005 (2018). - DOI - PMC - PubMed
    1. McCoull W. et al. Development of a Novel B-Cell Lymphoma 6 (BCL6) PROTAC To Provide Insight into Small Molecule Targeting of BCL6. ACS Chem Biol 13, 3131–3141, doi:10.1021/acschembio.8b00698 (2018). - DOI - PubMed

Supplementary References

    1. Meyers RM et al. Computational correction of copy number effect improves specificity of CRISPR-Cas9 essentiality screens in cancer cells. Nat Genet 49, 1779–1784, doi:10.1038/ng.3984 (2017). - DOI - PMC - PubMed
    1. Donovan KA et al. Thalidomide promotes degradation of SALL4, a transcription factor implicated in Duane Radial Ray syndrome. Elife 7, doi:10.7554/eLife.38430 (2018). - DOI - PMC - PubMed
    1. Abdulrahman W. et al. A set of baculovirus transfer vectors for screening of affinity tags and parallel expression strategies. Anal Biochem 385, 383–385, doi:10.1016/j.ab.2008.10.044 (2009). - DOI - PubMed
    1. Faust TB et al. Structural complementarity facilitates E7820-mediated degradation of RBM39 by DCAF15. Nat Chem Biol 16, 7–14, doi:10.1038/s41589-019-0378-3 (2020). - DOI - PMC - PubMed
    1. Marze NA, Roy Burman SS, Sheffler W. & Gray JJ Efficient flexible backbone protein-protein docking for challenging targets. Bioinformatics 34, 3461–3469, doi:10.1093/bioinformatics/bty355 (2018). - DOI - PMC - PubMed

Publication types

MeSH terms