. 2020 Nov;587(7835):619-625.
doi: 10.1038/s41586-020-2922-4. Epub 2020 Nov 18.

A molecular cell atlas of the human lung from single-cell RNA sequencing

Affiliations

A molecular cell atlas of the human lung from single-cell RNA sequencing

Kyle J Travaglini et al. Nature. 2020 Nov.

Abstract

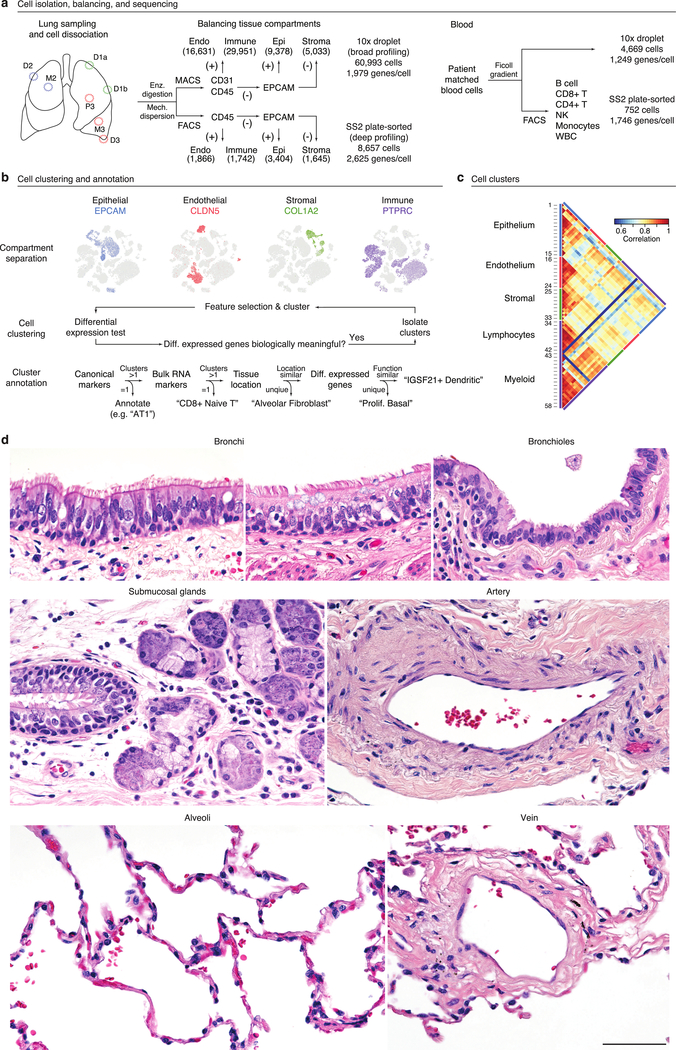
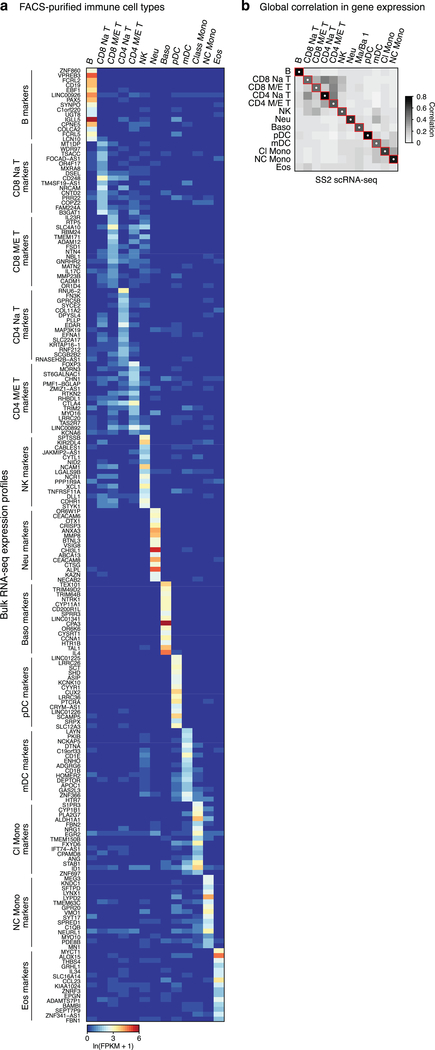
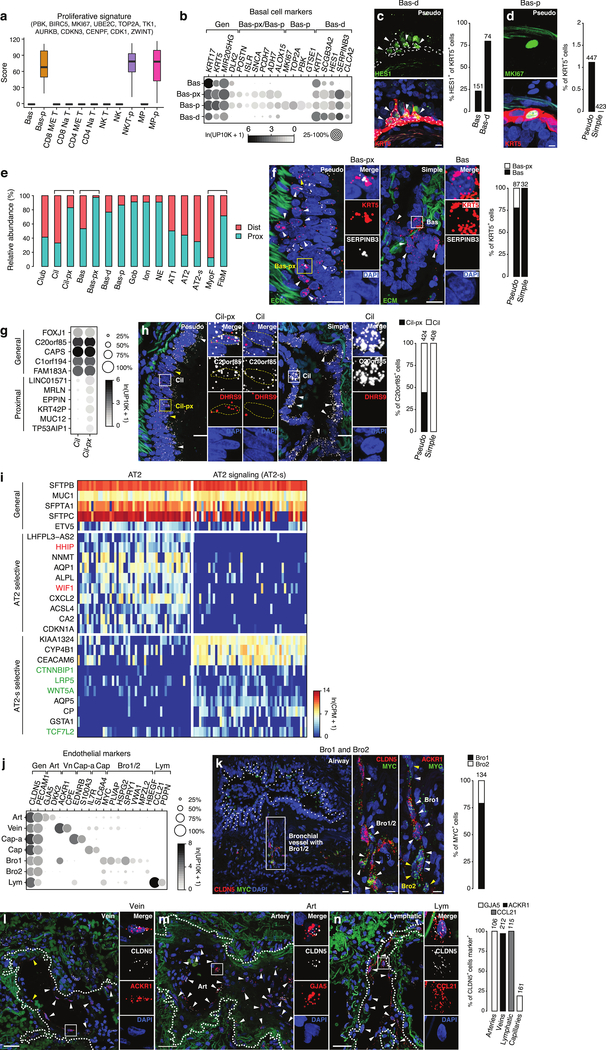
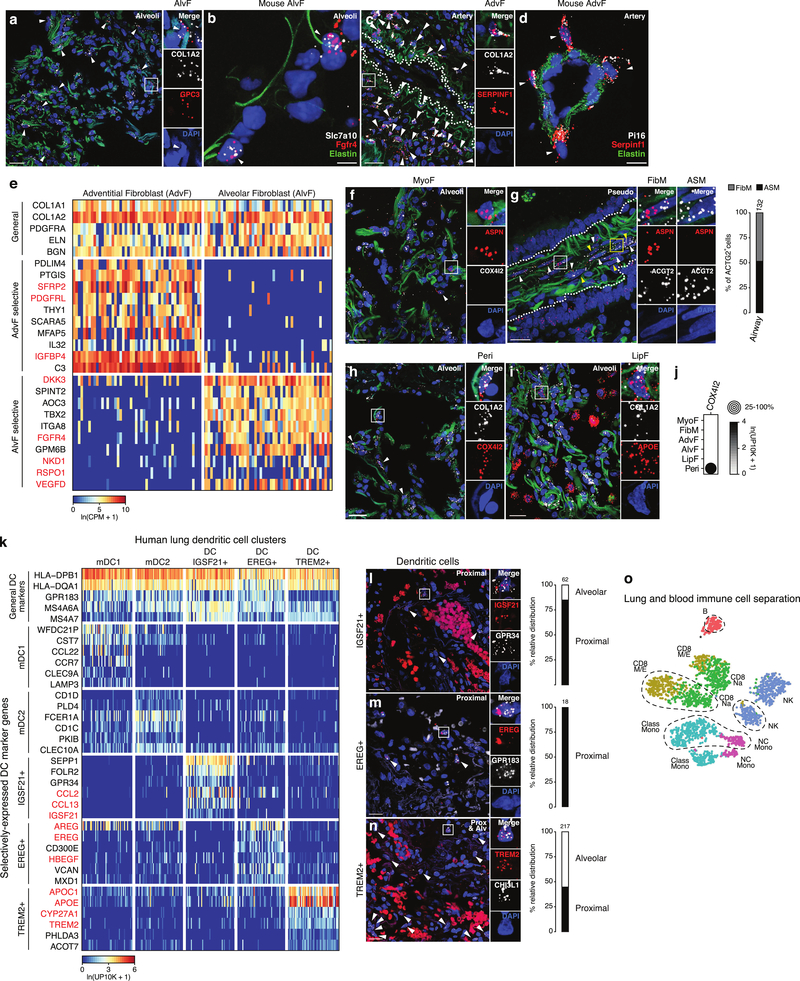
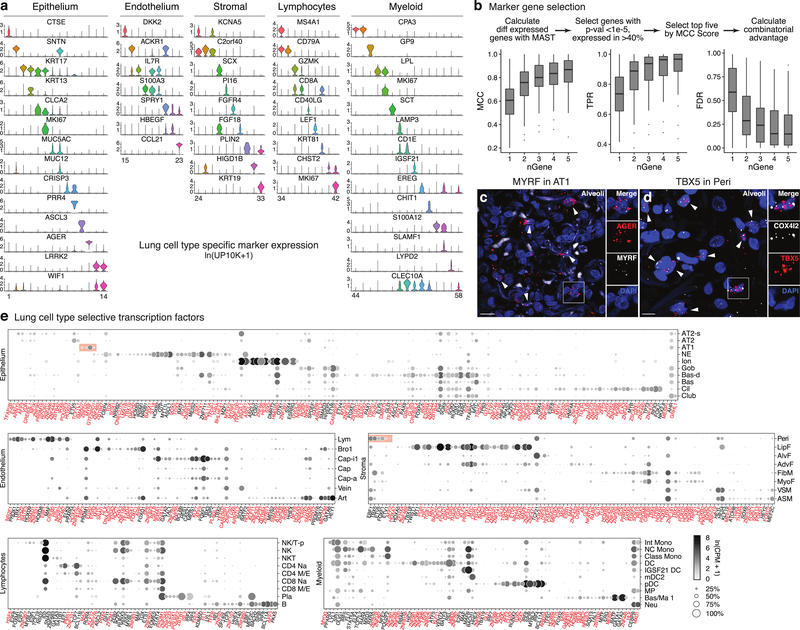
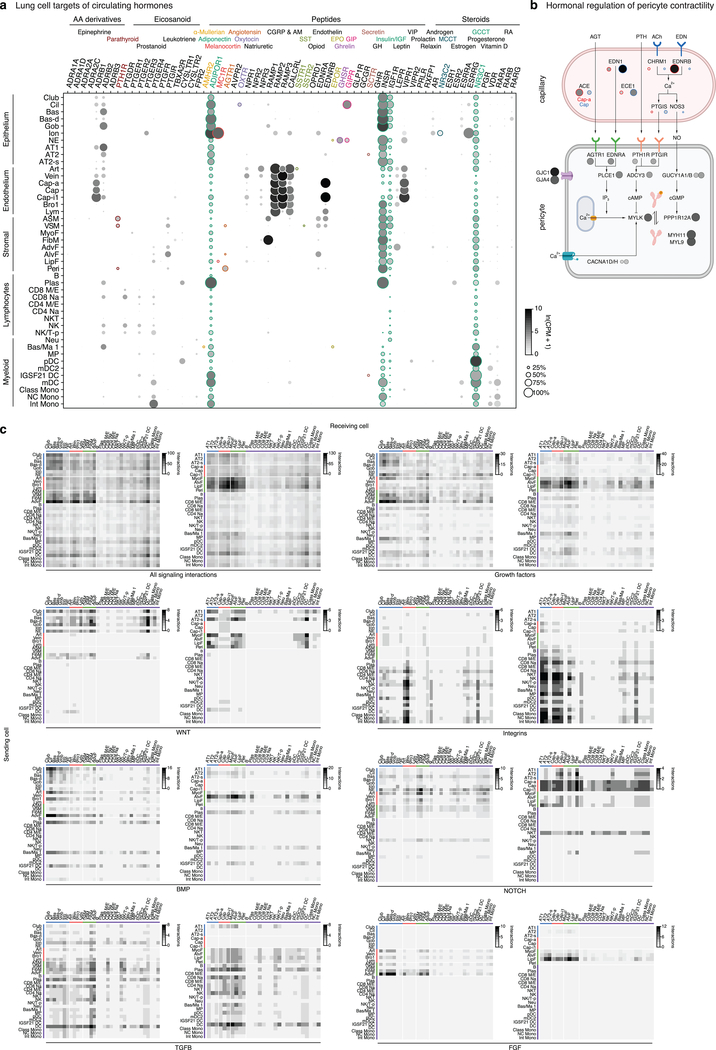
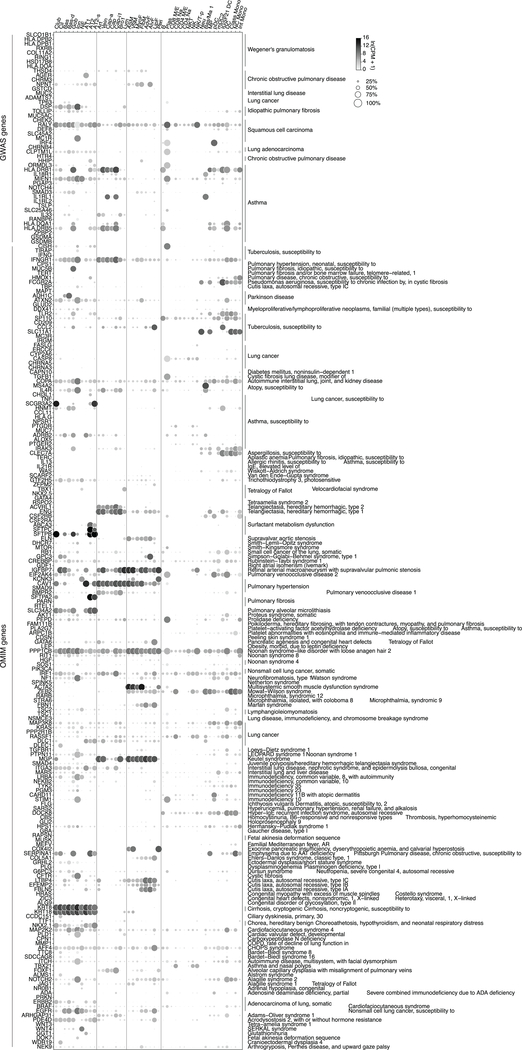
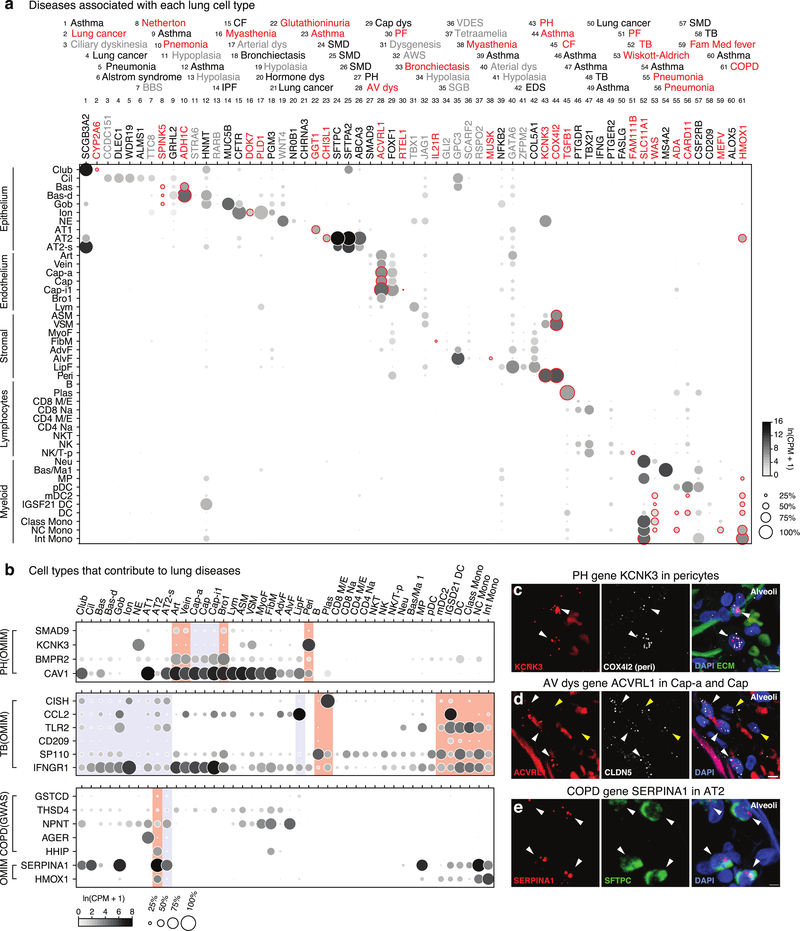
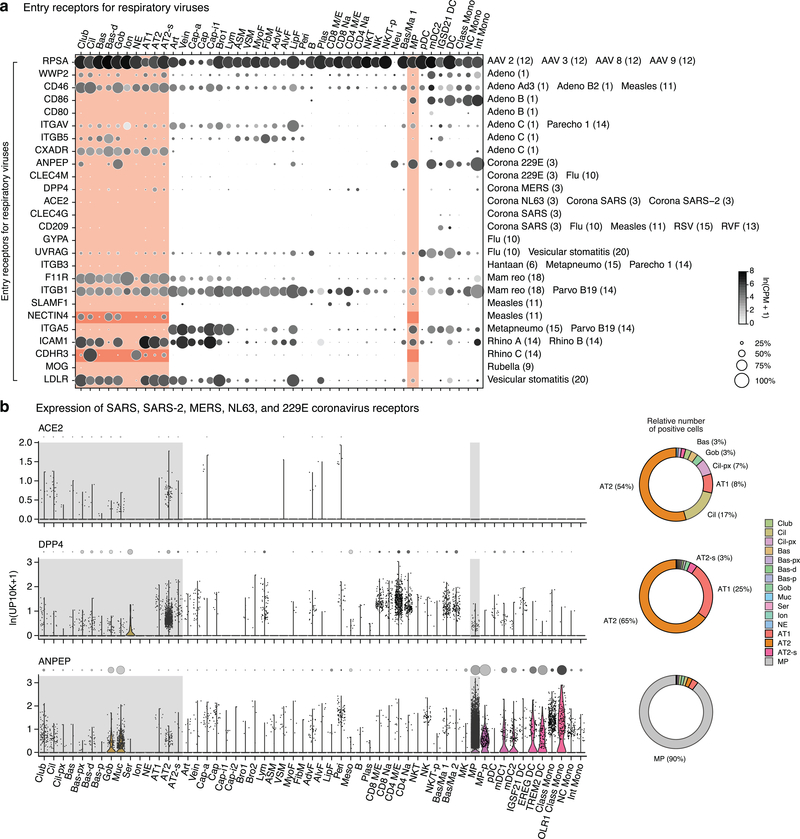
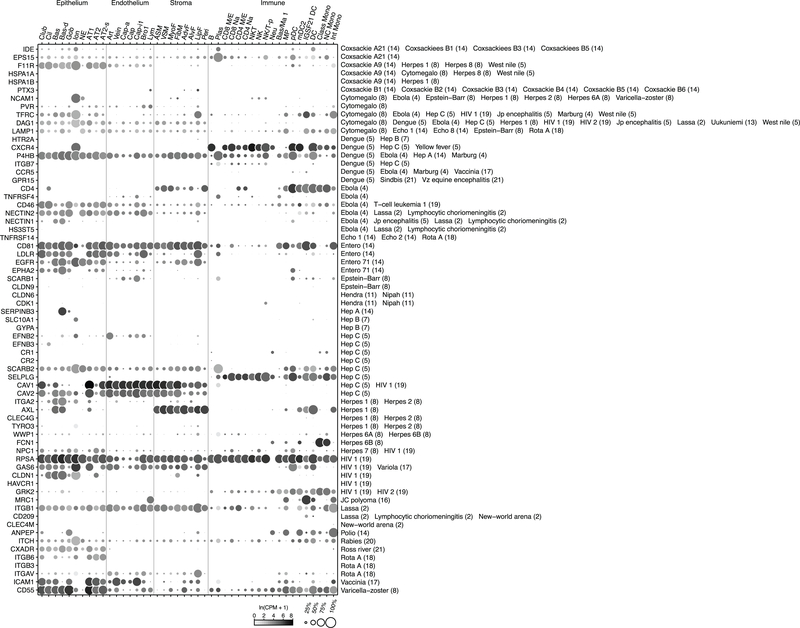
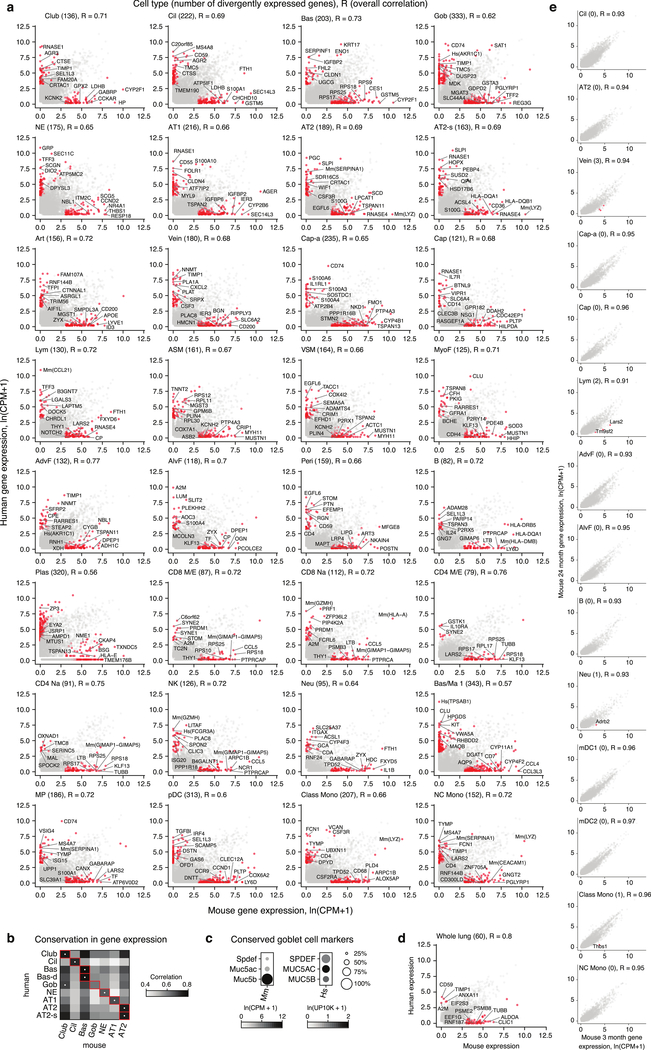
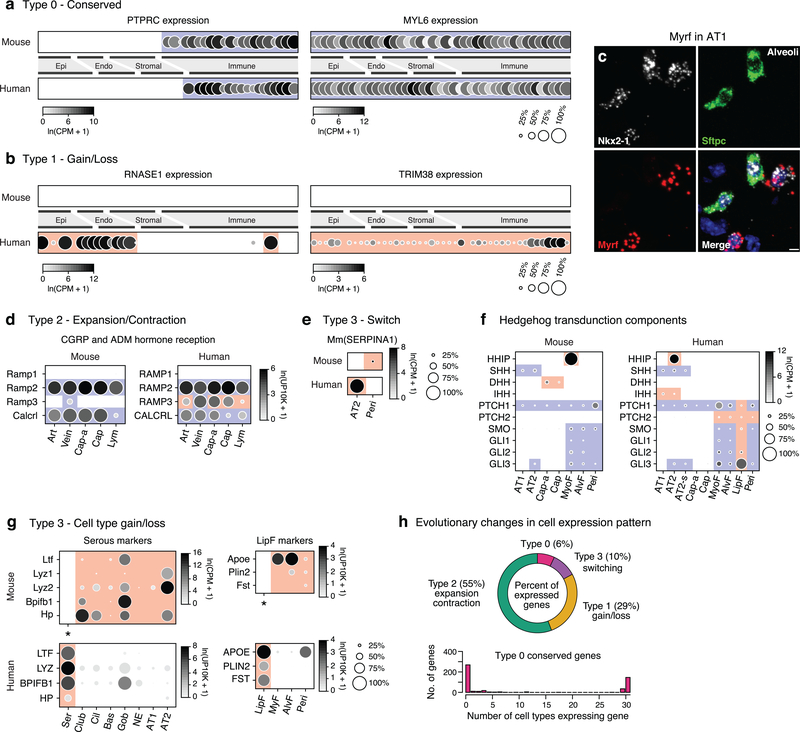
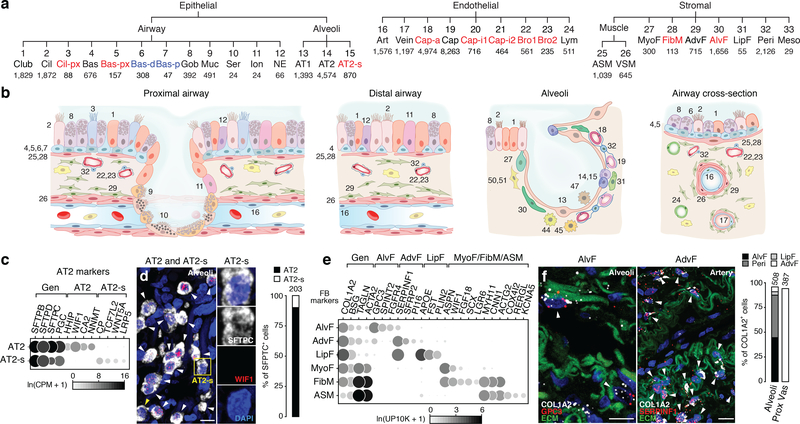
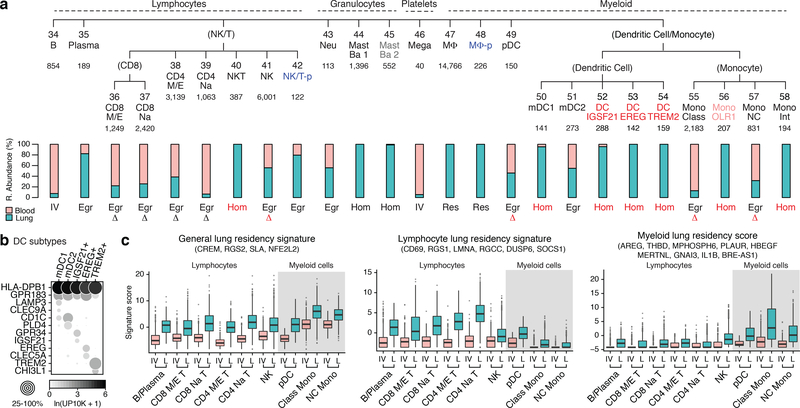
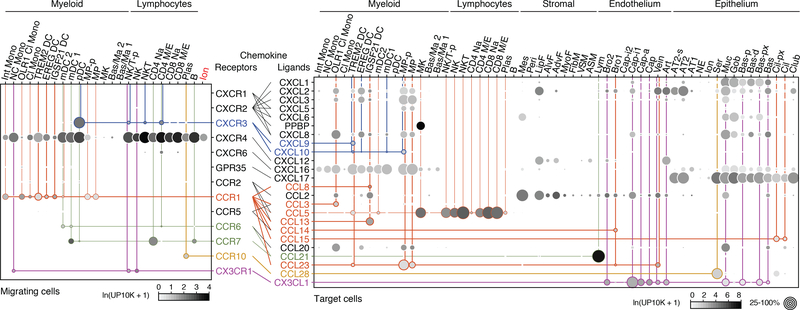
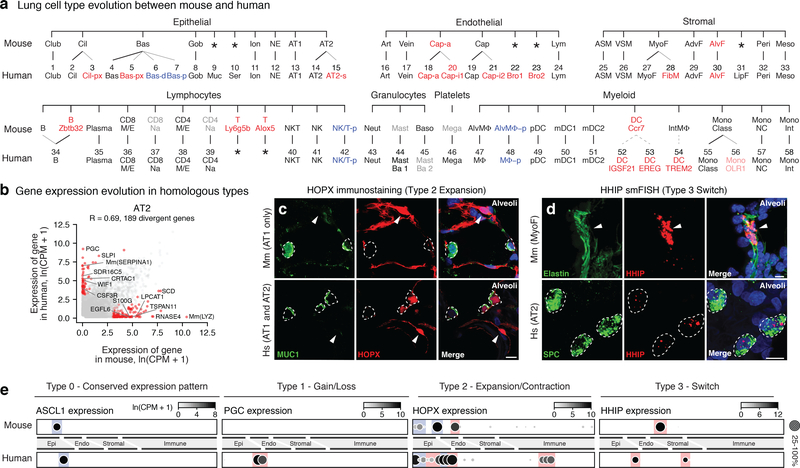
Although single-cell RNA sequencing studies have begun to provide compendia of cell expression profiles1-9, it has been difficult to systematically identify and localize all molecular cell types in individual organs to create a full molecular cell atlas. Here, using droplet- and plate-based single-cell RNA sequencing of approximately 75,000 human cells across all lung tissue compartments and circulating blood, combined with a multi-pronged cell annotation approach, we create an extensive cell atlas of the human lung. We define the gene expression profiles and anatomical locations of 58 cell populations in the human lung, including 41 out of 45 previously known cell types and 14 previously unknown ones. This comprehensive molecular atlas identifies the biochemical functions of lung cells and the transcription factors and markers for making and monitoring them; defines the cell targets of circulating hormones and predicts local signalling interactions and immune cell homing; and identifies cell types that are directly affected by lung disease genes and respiratory viruses. By comparing human and mouse data, we identified 17 molecular cell types that have been gained or lost during lung evolution and others with substantially altered expression profiles, revealing extensive plasticity of cell types and cell-type-specific gene expression during organ evolution including expression switches between cell types. This atlas provides the molecular foundation for investigating how lung cell identities, functions and interactions are achieved in development and tissue engineering and altered in disease and evolution.


Conflict of interest statement

Competing Interests

The authors declare no competing interests.

Figures

Extended Data Figure 1.
Extended Data Figure 1.. Strategy for single cell RNA sequencing and annotation of human lung and blood cells.
a, Workflow for capture and mRNA sequencing of single cells from the healthy unaffected regions indicated (D, distal; M, medial; P, proximal lung tissue; see panel d) of fresh, surgically resected lungs with focal tumors from three subjects (1, 2, 3) and their matched peripheral blood. Cell representation was balanced among the major tissue compartments (Endo, endothelial; Immune; Epi, epithelial; Stroma) by magnetic and fluorescence activated cell sorting (MACS and FACS) using antibodies for the indicated surface markers (CD31, CD45, EPCAM; +, marker-positive; -, marker-negative). Cell capture and single cell RNA sequencing (scRNAseq) was done using 10x droplet technology or SmartSeq2 (SS2) analysis of plate-sorted cells. Number of profiled cells from each compartment are shown in parentheses. For blood, immune cells were isolated on a high density Ficoll gradient, and unsorted cells profiled by 10x and sorted cells (using canonical markers for the indicated immune populations) by SS2. Total cell number (all 3 subjects) and median number of expressed genes per cell are indicated for each method. b, Cell clustering and annotation pipeline. Cell expression profiles were computationally clustered by nearest-neighbor relationships and clusters were then separated into tissue compartments based on expression of compartment-specific markers (EPCAM (blue), CLDN5 (red), COL1A2 (green), and PTPRC (purple)), as shown for tSNE plot of lung and blood cell expression profiles obtained by 10x from Patient 3. Cells from each tissue compartment were then iteratively re-clustered until differentially-expressed genes driving clustering were no longer biologically meaningful. Cell cluster annotation was based on expression of canonical marker genes from the literature, markers found through RNA sequencing of purified cell populations (Bulk RNA markers), ascertained tissue location, and inferred molecular function from differentially-expressed genes. c, Heatmap of pairwise Pearson correlations of the average expression profile of each cluster in the combined 10x dataset plus SS2 analysis of neutrophils. n, given in Supplementary Table 2. Tissue compartment and identification number of each of the 58 clusters are indicated. For more details on statistics and reproducibility, please see Methods. d, Representative micrographs of donor lungs from formalin-fixed, paraffin-embedded (FFPE) sections stained with haematoxylin and eosin showing bronchi, bronchioles, submucosal glands, arteries, veins, and alveoli near regions used for single cell RNA sequencing. Staining repeated on at least 5 sections (encompassing different anatomical regions) from each subject used for scRNAseq. Bar, 100 μm.
Extended Data Figure 2.
Extended Data Figure 2.. Selectively-expressed RNA markers of human immune cell types from bulk mRNA sequencing of FACS-purified immune cells.
a, Heatmap of RNA expression of the most selectively-expressed genes from bulk mRNA sequencing of the indicated FACS-sorted immune populations (see Supplementary Table 3). This dataset provided RNA markers for human immune cell populations that have been classically defined by their cell surface markers. b, Heatmap of pairwise Pearson correlation scores between the average expression profiles of the immune cell types indicated that were obtained from bulk mRNA sequencing (BulkSeq, panel a) to the average scRNAseq profiles of human blood immune cells in the SS2 dataset annotated by canonical markers and enriched RNA markers from the bulk RNA-seq analysis. The highest correlation in overall gene expression (white dot) of each annotated immune cell cluster in the SS2 dataset (columns) was to the bulk RNA-seq of the same FACS-purified immune population (rows), supporting the scRNAseq immune cluster annotations (red squares). Cell numbers are given in Supplementary Table 2. For more details on statistics and reproducibility, please see Methods.
Extended Data Figure 3.
Extended Data Figure 3.. Expression differences and localization of lung cell states and canonical epithelial and endothelial subtypes.
a, Proliferative signature score (based on expression of indicated genes in cells from 10x dataset, cell numbers given in Supplementary Table 2) of each cluster of basal cells, T and NK cells, and macrophages. Three clusters had high scores: basal-proliferative (Bas-p), NK/T-proliferative (NK/T-p), and macrophage-proliferative (MP-p). b, Dot plot of mean level of expression (dot intensity, gray scale) of indicated basal cell markers and percent of cells in population with detected expression (dot size) for 10x dataset. Note partial overlap of markers among different basal populations. c, Immunostaining of adult human pseudostratified airway for differentiation marker HES1 (green) in basal cells (marked by KRT5, red) with DAPI (nuclear) counter stain (blue). Bars, 10 μm. Note apical processes extending from HES1+ basal cells (arrowheads) indicating migration away from basal lamina as they differentiate. Other HES1+ cells have turned off basal marker KRT5. Dashed outlines, basal cell nuclei. Quantification shows fraction of basal cells (Bas, cuboidal KRT5+ cells on basement membrane) and Bas-d cells (KRT5+ cells with apical processes) that were HES1+. n, KRT5+ cells scored in sections of 2 human lungs with staining repeated on 4 subjects. d, Immunostaining of adult human pseudostratified airway for proliferation marker MKI67 (green) in basal cells (marked by KRT5, red) with DAPI counter stain (blue). Bars, 5 μm. Quantification shows abundance of proliferating (MKI67-expressing) basal cells (Bas-p) in pseudostratified (pseudo) and simple epithelial airways; n, KRT5+ cells scored in sections of 2 human lungs with staining repeated on 4 subjects. e, Relative abundance of epithelial and stromal cell types in scRNAseq analysis of human lung samples obtained from proximal (blue; 10x cells from P3) and distal (red; 10x cells from D1a, D1b, D2, D3) lung sites. In addition to the expected proximal enrichment of some airway cell types (goblet, gob; ionocytes, ion, neuroendocrine, NE) and distal enrichment of alveolar cell types (AT1, AT2, AT2-s, myofibroblasts), note three bracketed pairs of related cell types (ciliated (cil) and ciliated-proximal (cil-px); basal (bas) and basal-proximal (bas-px); myofibroblasts (MyoF) and fibromyocyte (FibM)) with one of them proximally-enriched. Relative enrichment values are provisional because they can be influenced by efficiency of harvesting during cell dissociation and isolation. Cell number for proximal cells are 357; 275; 73; 175; 153; 191; 39; 145; 57; 24; 20; 10; 328; 1,505; 235; 25; and 70 and for distal cells are 537; 806; 15; 197; 4; 58; 6; 14; 336; 0; 2; 1; 467; 2,095; 434; 198; and 28. f, RNAscope single molecule fluorescence in situ hybridization (smFISH) and quantification for general basal marker KRT5 (red) and Bas-px marker SERPINB3 (white) with DAPI counter stain (blue) and extracellular matrix autofluorescence (ECM, green) on proximal, pseudostratified bronchi and distal, simple bronchioles. Bars, 20 μm (inset, 10 μm). Note Bas-px cell (KRT5 SERPINB3 double positive, yellow arrowhead and box) enrichment at base of pseudostratified airways. SERPINB3 was not detected in simple airways, indicating Bas (but not Bas-px) cells are present there. Staining repeated on 2 subjects. g, Dot plot of expression in ciliated (Cil) and proximal ciliated (Cil-px) cells of canonical (general) ciliated cell markers and specific Cil-px (proximal) markers (in 10x dataset). h, smFISH and quantification of human pseudostratified epithelial (left panel) and simple epithelial (right panel) airways for general ciliated marker C20orf85 (white) and proximal (Cil-px) marker DHRS9 (red) with DAPI counterstain (blue) and ECM autofluorescence (green). Note Cil-px cell restriction to pseudostratified airways. Bars, 10 μm. Staining repeated on 2 subjects. i, Heatmap of expression of representative general AT2, AT2 selective, and AT2-s selective marker genes in AT2 and AT2-s human lung cells (SS2 data). AT2 selective markers include negative regulators of Hedgehog and Wnt signaling pathways (e.g., HHIP, WIF1, highlighted red) and AT2-s selective markers include Wnt ligands, receptors, and transcription factors (e.g., WNT5A, LRP5, TFC7L2 highlighted green). Values shown are ln(CPM+1) for 50 randomly-selected cells in each cluster (SS2 data). j, Dot plot of expression of endothelial markers (10x dataset). k, Micrograph (low magnification, left) of bronchial vessel (boxed region) showing vessel location near airway (dotted outline). smFISH for general endothelial marker CLDN5 (red, center panel), bronchial vessel-specific markers MYC (green) and Bro1-specific marker ACKR1 (red, right panel) on serial sections of bronchial vessel cells (arrowheads), co-stained for DAPI (blue). Bar, 10 μm. Quantification shows relative abundance of Bro1 and Bro2 cells. Staining repeated on 2 subjects. l-n, smFISH and quantification of vessel types indicated (dotted outlines) showing vein marker ACKR1 (red, panel l), artery marker GJA5 (red, m), lymphatic marker CCL21 (red, n), and general endothelial marker CLDN5 with DAPI counter stain (blue) and ECM autofluorescence (green). Bars, 50 μm (l), 30 μm (m), and 40 μm (n). Staining repeated on 2 subjects. For more details on statistics and reproducibility, please see Methods.
Extended Data Figure 4.
Extended Data Figure 4.. Markers and lung localization of stromal and dendritic subtypes.
(a-d) smFISH for RNA of indicated marker genes of alveolar fibroblasts (AlvF, a, b) and adventitial fibroblasts (AdvF, c, d) in adult human (a, c) and mouse (b, e) alveolar (a, b) and pulmonary artery (c, d) sections. ECM autofluorescence (green, panels a, c) to show blood vessels; Elastin (green, panels b, d); DAPI counterstain (blue, all panels). Staining repeated on 2 human subjects or 3 mice. a, smFISH probes: general fibroblast marker COL1A2 (white) and AlvF-selective marker GPC3 (red). Arrowheads, AlvF cells. Inset, close-up of boxed region showing merged (top) and split channels of an AlvF. Bars, 20 μm (inset 60 μm). b, smFISH probes: AlvF-selective markers Slc7a10 (white) and Frfr4 (red). Elastin (green) shows alveolar entrance ring. Arrowheads, AlvF cells. Bar, 5 μm. c, smFISH probes: general fibroblast marker COL1A2 (white) and AdvF-selective marker SERPINF1 (red). AdvF (some indicated with arrowheads) localize around blood vessels (ECM, green). Inset, close-up of boxed region showing merged (top) and split channels of an AdvF. Dashed line, artery boundary. Bars, 30 μm (inset 90 μm). d, smFISH probes: AdvF-selective markers Pi16 (white) and Serpinf1 (red). AdvF (arrowheads) surround artery (marked by Elastin, green). Bar, 10 μm. e, Heatmap of expression of representative general, adventitial-selective, and alveolar-selective fibroblast markers in 50 randomly-selected cells from AdvF (left) and AlvF (right) clusters (SS2 dataset). Note specialization (highlighted red) in growth factors (AdvF: PDGFRL, IGFBP4; AlvF: FGFR4, VEGFD) and morphogen (AdvF: SFRP2; AlvF: NKD1, DKK3) signaling/regulation. f, g, smFISH and quantification of cell abundance in human alveolar (Alveoli, f) and pseudostratified epithelial airway (Pseudo, g) sections probed for myofibroblast (MyoF) and fibromyocyte marker ASPN (red), and for fibromyocyte (FibM) and airway smooth muscle (ASM) markers COX4I2 (white, f) and ACTG2 (white, g). ECM autofluorescence, green; DAPI counter stain, blue. Inset (f), boxed region showing close-up of merged (top) and split channels of ASPN+ COX4I2 myofibroblast. Myofibroblasts and fibromyocytes (see below) likely make up remaining cells in Figure 1f quantification. Inset (g), boxed regions showing close-up of merged (top) and split channels of FibM (white box) and ASM (yellow box) cells. FibM (white arrowheads) and ASM (yellow arrowheads) are intermingled in wall of pseudostratified airway (dotted outline). Staining repeated on 2 subjects. h, i, smFISH of human alveolar sections probed for general stromal marker COL1A2 (white), pericyte (Peri) marker COX4I2 (red, panel h), lipofibroblast (LipF) marker APOE (red, panel i). ECM autofluorescence, green; DAPI counter stain, blue. Inset (h), boxed region showing close-up of pericyte. Inset (i), boxed region showing close-up of COL1A2 APOE double-positive LipF. LipF cells are intermingled among other stromal cells (single-positive COL1A2) and macrophages (single-positive APOE). Quantification in Fig. 1f. Bars, 20 μm. Staining repeated on 2 subjects. j, Dot plot of COX4I2 expression in alveolar stromal cell types (10x dataset). k, Heatmap of expression of dendritic cell marker genes in 50 randomly-selected cells from indicated dendritic cell clusters (human blood and lung 10x datasets). Cells in all clusters express general dendritic markers including antigen presenting genes but each cluster also has its own selective markers. Red-highlighted markers distinguishing the newly-identified dendritic cell clusters (IGSF21+, EREG+, TREM2+) suggest different roles in asthma (IGSF21+), growth factor regulation (EREG+), and lipid handling (TREM2+). l-n, smFISH of adult human lung proximal and alveolar (Alv) sections as indicated probed for IGSF21+ DC markers IGSF21 (red) and GPR34 (white) (panel l), EREG+ DC marker EREG (red) and general DC marker GPR183 (white) (panel m), and TREM2+ DC markers TREM2 (red) and CHI3L1 (white) (panel n). DAPI counter stain, blue. (Non-punctate signal in red channel (panels l, n) is erythrocyte autofluorescence. Insets, boxed regions showing merged and split channels of close-up of single dendritic cell of indicated type. Bars, 20 μm. Arrowheads, double-positive cells. Quantification shows distribution of each dendritic type; note IGSF21+ and EREG+ dendritic cells show strong proximal enrichment. Staining repeated on 2 subjects. o, tSNE of expression profile clusters of monocytes and B, T, and NK cells (10x dataset, subject 1, 2,622 cells). Note separate cell clusters of each immune cell type isolated from lung (no outline) and blood (dashed outline). Asterisk, small number of B cells isolated from the lung that cluster next to blood B cells. For more details on statistics and reproducibility, please see Methods.
Extended Data Figure 5.
Extended Data Figure 5.. Markers and transcription factors that distinguish human lung cell types.
a, Violin plots of expression levels (ln(UP10K + 1)) of the most sensitive and specific markers (gene symbols) for each human lung cell type in its tissue compartment (10x dataset). Cell numbers given in Supplementary Table 2. b, Scheme for selecting the most sensitive and specific marker genes for each cell type using Matthews Correlation Coefficient (MCC). Box-and-whisker plots below show MCCs, True Positive Rates (TPR), and False Discovery Rates (FDR) for each cell type (n=58) using indicated number (nGene) of the most sensitive and specific markers (10x dataset). Note all measures saturate at approximately 2–4 genes, hence simultaneous in situ probing of a human lung for the ~100–200 optimal markers would assign identity to nearly every cell. c, Alveolar section of human lung probed by smFISH for AT1 marker AGER and transcription factor MYRF. MYRF is selectively expressed in AT1 cells (arrowheads; 97% of MYRF+ cells were AGER+, n=250 scored cells). Inset, boxed region showing merged and split channels of AT1 cell. Bar, 10 μm. Staining repeated on 2 subjects. d, Alveolar section of human lung probed by smFISH for pericyte marker COX4I2 and transcription factor TBX5. TBX5 is enriched in pericytes (arrowheads, 92% of TBX5+ cells were COX4I2+, n=250). Inset, boxed region showing merged and split channels of pericyte. Bar, 5 μm. Staining repeated on 2 subjects. e, Dot plot of expression of enriched transcription factors in each lung cell type (SS2 dataset). Red text, genes not previously associated with the cell type. Red shading, transcription factors including MYRF that are highly enriched in AT1 cells, and TBX5 and others highly enriched in pericytes. For more details on statistics and reproducibility, please see Methods.
Extended Data Figure 6.
Extended Data Figure 6.. Lung cell targets of circulating hormones and local signals.
a, Dot plot of hormone receptor gene expression in lung cells (SS2 dataset). Type and name of cognate hormones for each receptor are shown at top. Teal, broadly-expressed receptors in lung; other colors, selectively-expressed receptors (<3 lung cell types). Small colored dots next to cell type names show selectively targeted cell types. AA, amino acid; CGRP, Calcitonin gene-related peptide; AM, adrenomedullin; SST, somatostatin; EPO, erythropoietin; GIP, gastric inhibitory peptide; GH, growth hormone; IGF, insulin-like growth factor; MCCT, mineralocorticoid; GCCT, glucocorticoid; RA, retinoic acid. b, Schematic of inferred pericyte cell contractility pathway and its regulation by circulating hormones (AGT, PTH) and capillary-expressed signals (EDN, NO). Dots show expression of indicated pathway genes: values at left (outlined red) in each pair of dots in capillary diagram (top) show expression in Cap-a cells (aerocytes) and at right (outlined blue) show expression in general Cap cells (SS2 dataset). Note most signal genes are preferentially expressed in Cap relative to Cap-a cells. c, Heatmaps showing number of interactions predicted by CellPhoneDB software between human lung cell types located in proximal lung regions (left panel in each pair) and distal regions (right panel) based on expression patterns of ligand genes (“Sending cell”) and their cognate receptor genes (“Receiving cell”) (SS2 dataset). The pair of heatmaps at upper left show values for all predicted signaling interactions (“All interactions”), and other pairs show values for the indicated types of signals (growth factors, cytokines, integrins, WNT, Notch, Bmp, FGF, and TFGB). Predicted interactions between cell types range from 0 (lymphocyte signaling to neutrophils) to 136 (AdvF signaling to Cap-i1). Note expected relationships, such as immune cells expressing integrins to interact with endothelial cells and having higher levels of cytokine signaling relative to their global signaling, and unexpected relationships, such as fibroblasts expressing majority of growth factors and lack of Notch signaling originating from immune cells. For more details on statistics and reproducibility, please see Methods.
Extended Data Figure 7.
Extended Data Figure 7.. Lung cell expression patterns of genes implicated in lung disease.
Dot plots of expression (in SS2 dataset) of 233 lung disease genes curated from Genomewide Association Studies (GWAS, genome-wide association genes ≥10−20 significance) and Online Mendelian Inheritance in Man (OMIM). For more details on statistics and reproducibility, please see Methods.
Extended Data Figure 8.
Extended Data Figure 8.. Mapping cellular origins of lung disease by cell-selective expression of disease genes.
a, Dot plots of expression of lung disease genes (numbered, associated disease shown above) enriched in specific lung cell types (SS2 datasets). Red, novel cell type association of gene/disease; gray, diseases with developmental phenotype. BBS, Bardet-Biedl syndrome; Dys, dysplasia; IPF, idiopathic pulmonary fibrosis; SMD, surfactant metabolism dysfunction; PH, pulmonary hypertension; SM, smooth muscle; SGB, Simpson-Golabi-Behmel; TB, tuberculosis; AWS, Alagille-Watson syndrome; VDES, Van den Ende-Gupta syndrome; EDS, Ehlers-Danlos syndrome; CF, Cystic fibrosis; Fam Med, Familial Mediterranean; COPD, Chronic Obstructive Pulmonary disease. b, Dot plot of expression (SS2 dataset) of all genes implicated in PH, TB, and COPD/emphysema (OMIM, Mendelian disease genes from OMIM database; GWAS, genome-wide association genes ≥10−20 significance). Note canonical AT2 cells (red shading) express all and AT2-s cells (blue shading) express most. c, smFISH of alveolar section of adult human lung probed for PH disease gene KCNK3 (red) and pericyte marker COX4I2 (white) with DAPI counterstain (blue) and ECM autoflourescence (green). Note pericyte-specific expression (arrowheads, 91% of COX4I2+ pericytes were KCNK3+, n=77). Bar, 5 μm. Cell numbers for each type given in Supplementary Table 2. d, smFISH of alveolar section of adult human lung probed for atrioventricular (AV) dysplasia gene ACVRL1 (red), endothelial marker CLDN5 (white) with DAPI counterstain. Note ACVRL1 CLDN5 double-positive capillaries (white arrowheads, 70% of CLDN5+ capillaries were ACVRL1+, n=102) and some CLDN5 single positive capillaries (yellow arrowheads). Bar, 5 μm e, smFISH of alveolar section of adult human lung probed for COPD/emphysema gene SERPINA1 and AT2 marker SFTPC, and DAPI. Note AT2-specific expression (arrowheads; 93% of AT2 cells were SERPINA1+, n=176). Bar, 5 μm. For more details on statistics and reproducibility, please see Methods.
Extended Data Figure 9.
Extended Data Figure 9.. Lung cell expression patterns of respiratory virus receptors.
a, Dot plot showing expression in human lung cell types of entry receptors (indicated at left) for respiratory viruses (indicated at right, numbers indicate viral families) (SS2 dataset). Red shading, cell types inhaled viruses could directly access (epithelial cells and macrophages); darker red shading shows expression values for measles receptor NECTIN4 and rhinovirus C receptor CDHR3. b, Violin plots (left) and dot plots (immediately above violin plots) showing expression of coronavirus receptors ACE2, DPP4, and ANPEP in lung cell types (10x dataset, cell numbers given in Supplementary Table 2). Grey shading, cell types inhaled viruses can directly access. Donut plots (right) showing relative number of receptor-expressing cells of cell types viruses can directly access (shaded grey in panel a), normalized by their abundance values from Supplementary Table 1 (and refined by the relative abundance values in Figures 2 and S4). Note prevalence of AT2 alveolar cells for ACE2, receptor for SARS-CoV and SARS-CoV-2, and for DPP4, receptor for MERS-CoV, in contrast to prevalence of macrophages for ANPEP, receptor for common cold causing coronavirus 229E. For more details on statistics and reproducibility, please see Methods.
Extended Data Figure 10.
Extended Data Figure 10.. Lung cell expression patterns of non-respiratory virus receptors.
a, Dot plot of expression of entry receptors for non-respiratory viruses in human lung cell types (compare with Extended Data Figure Fig. 10a showing expression of receptors for respiratory viruses). For more details on statistics and reproducibility, please see Methods.
Extended Data Figure 11.
Extended Data Figure 11.. Comparison of mouse and human gene expression profiles in homologous lung cell types and across age.
a, Scatter plots showing median expression levels (ln(CPM+1)) in indicated cell types of each expressed human gene and mouse ortholog (mouse and human SS2 datasets, human and mouse cell numbers given in Supplementary Tables 2 and 6, respectively). Note tens to hundreds of genes that show a 20-fold or greater expression difference (and p-value < 0.05, MAST) between species (red dots, gene names indicated for some and total number given above). Bas/Ma 1 cells have the most differentially-expressed genes (343), and CD4+ M/E T cells have the least (79). Pearson correlation scores (R values) between the average mouse and human gene expression profiles for each cell type are indicated. “Mm()” and “Hs()”, genes where duplications between mouse and human were collapsed to HomologyID. b, Heatmap showing global transcriptome Pearson correlation between indicated human and mouse epithelial cells (SS2 dataset, human and mouse cell numbers given in Supplementary Tables 2 and 6, respectively). Red outline, homologous cell types based on classical markers described in Supplementary Table 6. White dot, human to mouse correlation. c, Dot plot of expression of canonical goblet cell markers MUC5B and MUC5AC and transcription factor SPDEF in mouse (left) and human (right) goblet cells. d, Scatter plot showing average expression levels (dots) across all cells (“pseudo-bulk” lung expression) of each expressed human gene and mouse ortholog (mouse and human SS2 datasets). Scale, ln(CPM+1). Pearson correlation (R values) between the average mouse and human gene expression profiles are indicated. e, Scatter plots comparing median expression levels (ln(CPM+1)) in indicated mouse lung cell types of each expressed gene at age 3 months (x-axis) and 24 months (y-axis) in SS2 datasets from Tabula Muris Senis56 (cell numbers given in Supplementary Table 6). Pearson correlation scores between average gene expression profile for each cell type at each age are indicated (R values), along with number of genes (red dots) showing 20-fold or greater expression difference (and p-value < 0.05, MAST) between ages. Names of some genes are given next to the corresponding red dot. For more details on statistics and reproducibility, please see Methods.
Extended Data Figure 12.
Extended Data Figure 12.. Patterns of conserved and divergent gene expression across human and mouse lung cell types.
a, Dot plots of PTPRC and MYL6 expression in mouse and human lung cell types (SS2 datasets) showing two examples of conserved (Type 0) expression pattern. Blue shading, homologous cell types with conserved expression. b, Dot plots showing gain of expression (Type 1 change) in multiple human cell types of RNASE1 (left panel) and all human cell types of TRIM38 (right panel). Red shading, cell types with divergent (gained) expression. c, Alveolar section of adult mouse lung probed by smFISH for general alveolar epithelial marker Nkx2–1, AT2 marker Sftpc, and transcription factor Myrf. Note Myrf is selectively expressed in mouse AT1 cells (Nkx2–1+ Sftpc- cells), as it is in humans (Fig. ED6c). Bar, 5 μm. Staining repeated on 3 mice. d, Dot plots of expression of CGRP and ADM hormone receptor genes showing expansion of expression (Type 2 change) in human endothelial cells (10x datasets). e, Dot plots of expression of emphysema-associated gene SERPINA1 showing switched expression (Type 3 change) from mouse pericytes (top) to human AT2 cells (bottom) (SS2 datasets). f, Dot plots comparing expression and conservation of HHIP with those of other Hedgehog pathway genes including ligands (SHH, DHH, IHH), receptors (PTCH1, PTCH2, SMO,), and transducers (GLI1, GLI2, GLI3) (SS2 datasets). g, Dot plots of expression of serous cell markers LTF, LYZ, BPIFBP1, and HP showing switched expression (Type 3 change) from mouse airway epithelial cells to human serous cells, which mice lack (*). Dot plots of expression of lipid handling genes APOE, PLIN2, and FST show switched expression (Type 3 change) from mouse alveolar stromal cells to human lipofibroblasts (LipF), which mice lack (*). “Mm()” or “Hs()”, genes where duplications between mouse and human were collapsed to HomologyIDs (10x and SS2 datasets). h, Pie chart of fraction of expressed genes in lung showing each of the four types of evolutionary changes in cellular expression patterns from mouse to human. Histogram below shows number of lung cell types that the 602 genes with perfectly conserved cellular expression patterns (Type 0) are expressed in; note that almost all are expressed in either a single cell type (67%) or nearly all cell types (33%). For more details on statistics and reproducibility, please see Methods.
Figure 1.
Figure 1.. Identities and locations of lung epithelial, endothelial, and stromal cell types.
a, Human lung molecular cell types identified after iterative clustering (each level of hierarchy is an iteration) of scRNAseq profiles of cells in indicated tissue compartments. Black, canonical types; blue, proliferating or differentiating subpopulations; red, novel populations. Number of cells shown below cluster name. b, Diagrams showing localization and morphology of each type (cell type numbering/names in (a) and Figure 2a). c, Dot plot of AT2 marker expression (10x dataset). UP10K, UMIs per 10,000. d, smFISH and quantification (n=203 cells scored, staining repeated in 2 subjects different from those profiled) for common AT2/AT2-s marker SFTPC (white) and specific AT2 marker WIF1 (red puncta, arrowheads). Bar, 10μm. AT2-s cells (SFTPCpos WIF1neg; box, enlarged at right, yellow arrowhead) is intermingled among AT2 cells (SFTPCpos WIF1pos, white arrowheads). e, Dot plot of stromal markers (10x dataset). f, smFISH and quantification for general fibroblast marker COL1A2 (white), alveolar fibroblast (AlvF) marker GPC3 (red, left) and adventitial fibroblast (AdvF) marker SERPINF1 (red, right). Blue, DAPI; Green, ECM (extracellular matrix, autofluorescence). Adventitial fibroblasts (arrowheads, right) localize around vessels (ECM). Graph, stromal cell type quantification in alveolar and proximal vascular regions (n=number of cells scored in each region, staining repeated in 2 subjects different from those profiled); pericyte, lipofibroblast markers in Figure ED4h,i). Bars, 10μm. For more details on statistics and reproducibility, please see Methods.
Figure 2.
Figure 2.. Identity and residency of lung immune cells.
a, Human lung immune molecular types clustered and annotated as in Figure 1a. Clusters 45 (grey) and 56 (light red) were found only in one subject. Bar graphs show relative abundance of each immune type in lung (blue) and blood (red) samples. Lung “resident” (Res) or “homing” (Hom) immune types, >90% enrichment in lung samples; “intravascular” (IV), >90% enrichment in blood; “egressed” (Egr), all other types (assignments are provisional because cell harvesting influences enrichment values). Red lettering, cells not previously known to home to (be enriched in) lung or change expression (delta symbol) following egression from blood. b, Dot plot showing expression (10x dataset) in dendritic cell clusters 50–54 of, from top row to bottom: two canonical dendritic markers, four myeloid dendritic (mDC1, mDC2) markers, and six markers for three novel dendritic populations (IGSF21+, EREG+, and TREM2+). c, Box-and-whisker plots of general, lymphocyte-specific, and myeloid-specific lung residency (egression) signature scores (of cells in panel a) based on expression of indicated genes in 10x profiles of indicated immune types isolated from blood (IV) or lung (L). Many previously known lymphocyte residency genes (e.g. S1PR1, RUNX3, RBPJ, HOBIT) were lowly expressed and only uncovered in SS2 profiles. Gray shading, myeloid cells. n, cells in each box-and-whisker from left to right are 725; 187; 419; 771; 631; 1,411; 594; 2,419; 644; 288; 519; 4,250; 21; 116; 1,064; 1,013; 200; and 604. For more details on statistics and reproducibility, please see Methods.
Figure 3.
Figure 3.. Chemokine signaling predicts immune cell homing in lung.
Dot plots showing expression of chemokine receptors (left) and ligands (right) in human lung cells (10x dataset); only cell types and chemokines with detected expression are shown. Colored lines connect ligand sources (target cells) with migrating immune cell types and ionocytes (Ion, red) expressing cognate receptor; thicker lines indicate previously unknown interactions. For more details on statistics and reproducibility, please see Methods.
Figure 4.
Figure 4.. Evolutionary divergence of lung cell types and expression patterns.
a, Mouse (top) lung molecular cell types (profiled and identified as for human, see Methods) aligned with homologous human types (bottom, Figs. 2a, 3a) by expression of classical markers in Supplementary Table 6. Thin lines, evolutionary expansions; dashed lines, potential expansions of functionally-related types. Red text, newly identified populations (light red, identified in only one subject); blue, cell states more abundant in human; gray, extant mouse cell types not captured in our data or found in only one patient in human; *, missing cell types. b, Scatter plot comparing average expression levels (dots) in AT2 cells of each expressed human gene and mouse ortholog (SS2 datasets; n, 3,404 human and 318 mouse AT2 cells). R, Pearson correlation coefficient. Red dots, divergent genes (selected ones indicated) expressed 20-fold higher in either species, p<0.05 (‘MAST’ differential gene expression test). Scale, ln(CPM+1). c, Alveolar sections from mouse (top, Mm) and human (bottom, Hs) immunostained for HOPX (red) and AT2 marker MUC1 (green), and DAPI (blue). HOPX is expressed selectively in AT1 cells (arrowheads) in mouse but in human expression has expanded to AT2 and AT2-s cells (dashed circles). Bars, 10μm. Staining repreated on 3 subjects and mice. d, Alveolar sections from mouse (top) and human (bottom) probed by smFISH for Hhip and HHIP (red) and hydrazide staining for myofibroblast marker elastin (green) in mouse and smFISH for AT2 marker SFTPC (green) in human. Note HHIP expression switch from myofibroblast (mouse, arrowhead) to AT2 cells (human, dashed circles). Bars, 10μm. Staining repreated on 3 human subjects and mice. e, Dot plots of expression (SS2 datasets) of homologous genes indicated in mouse and human lung cell types (ordered as in panel a) exemplifying the four observed scenarios (Type 0,1,2,3) for evolution of cellular expression pattern. Colors highlight cell types with conserved (blue) and diverged (red) expression. For more details on statistics and reproducibility, please see Methods.

Comment in

  • A map of lung cell types.
    Stower H. Stower H. Nat Med. 2021 Jan;27(1):21. doi: 10.1038/s41591-020-01217-1. Nat Med. 2021. PMID: 33442012 No abstract available.

References

    1. Enge M et al. Single-cell analysis of human pancreas reveals transcriptional signatures of aging and somatic mutation patterns. Cell 171, 321–330.e14 (2017). - PMC - PubMed
    1. Tabula Muris Consortium. Single-cell transcriptomics of 20 mouse organs creates a Tabula Muris. Nature 562, 367–372 (2018). - PMC - PubMed
    1. Han X et al. Mapping the mouse cell atlas by microwell-seq. Cell 173, 1307 (2018). - PubMed
    1. Zeisel A et al. Molecular architecture of the mouse nervous system. Cell 174, 999–1014.e22 (2018). - PMC - PubMed
    1. Saunders A et al. Molecular diversity and specializations among the cells of the adult mouse brain. Cell 174, 1015–1030.e16 (2018). - PMC - PubMed

Publication types

MeSH terms

LinkOut - more resources