. 2020 Dec;588(7839):699-704.
doi: 10.1038/s41586-020-2937-x. Epub 2020 Nov 18.

MFSD12 mediates the import of cysteine into melanosomes and lysosomes

Affiliations

MFSD12 mediates the import of cysteine into melanosomes and lysosomes

Charles H Adelmann et al. Nature. 2020 Dec.

Abstract

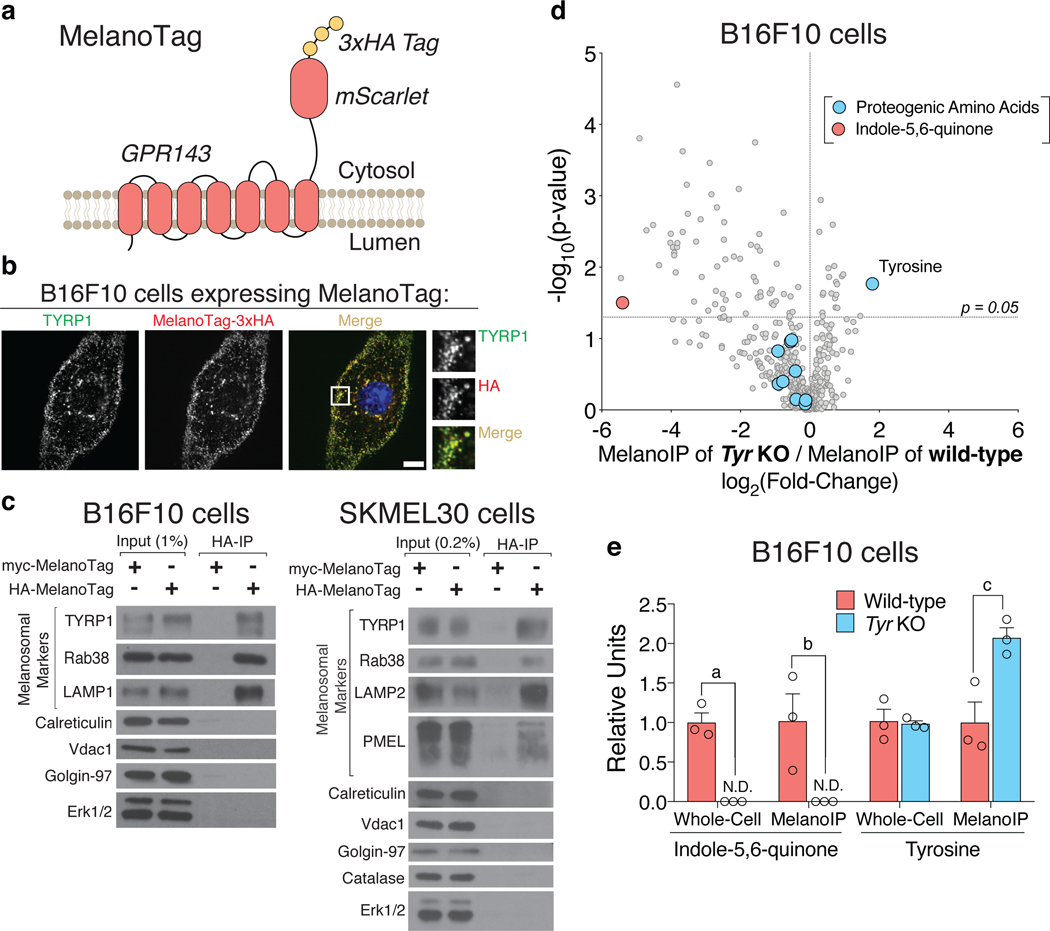
Dozens of genes contribute to the wide variation in human pigmentation. Many of these genes encode proteins that localize to the melanosome-the organelle, related to the lysosome, that synthesizes pigment-but have unclear functions1,2. Here we describe MelanoIP, a method for rapidly isolating melanosomes and profiling their labile metabolite contents. We use this method to study MFSD12, a transmembrane protein of unknown molecular function that, when suppressed, causes darker pigmentation in mice and humans3,4. We find that MFSD12 is required to maintain normal levels of cystine-the oxidized dimer of cysteine-in melanosomes, and to produce cysteinyldopas, the precursors of pheomelanin synthesis made in melanosomes via cysteine oxidation5,6. Tracing and biochemical analyses show that MFSD12 is necessary for the import of cysteine into melanosomes and, in non-pigmented cells, lysosomes. Indeed, loss of MFSD12 reduced the accumulation of cystine in lysosomes of fibroblasts from patients with cystinosis, a lysosomal-storage disease caused by inactivation of the lysosomal cystine exporter cystinosin7-9. Thus, MFSD12 is an essential component of the cysteine importer for melanosomes and lysosomes.


Conflict of interest statement

COMPETING INTEREST

The authors declare the following competing interests: C.H.A, A.K.T., and D.M.S are listed on a patent application based on the work described here.

Figures

Extended Data Fig. 1.
Extended Data Fig. 1.. MelanoIP analysis detects changes in Tyr dependent melanosomal metabolites
a, Schematic of melanin synthesis. The common pathway elements for eumelanin and pheomelanin synthesis have a gray backdrop. The brown and red backdrops highlight unique portions of eumelanin and pheomelanin synthesis, respectively. Enzymes proposed to catalyze each step are shown in green. Synthetic intermediates annotated and validated in biological samples in this study are in blue. b, Follow-up analysis with standard validated m/z and internal normalization of ‘proteogenic amino acids’ highlighted in untargeted metabolite profiling of wild-type and Tyr knock-out melanosomes (Fig. 1d). Amino acids are presented in order of increasing retention time (n = 3 independently prepared extracts, aP = 3.9×10⁻², bP = 2.0×10⁻³, cP = 6.5×10⁻³, dP = 3.8×10⁻², eP = 1.9×10⁻²). Error bars are mean ± s.e.m, P-values by two-sided Student’s t-test.
Extended Data Fig. 2.
Extended Data Fig. 2.. In vitro synthesis and biological detection of cysteinyldopas
a, Cysteinyldopas were synthesized according to an adapted protocol from Ito and Prota, 1977. Two species, distinguished by retention time, were generated at the expected m/z for cysteinyldopas. It has been shown that 5’-cysteinyldopa is produced in greater abundance than 2’-cysteinyldopa in this reaction. Taking MS1 peak intensity to approximate abundance, we putatively annotate the ‘Minor Isomer’ as 2’ substituted, and the ‘Major Isomer’ as 5’ substituted. b, Mirror plot of ddMS2 data comparing 2’- and 5’-cysteinyldopa in synthetic cysteinyldopas. c and d, Mirror plots of ddMS2 peaks displaying similarities in ddMS2 spectra of 2’- and 5’-cysteinyldopa species in biological samples (B16F10 extracts) and synthetic standards.
Extended Data Fig. 3.
Extended Data Fig. 3.. MFSD12 maintains lysosomal cystine in non-pigmented cells
a, FANTOM5 CAGE profiling data accessed via Human Protein Atlas ,. Six representative pigmentation genes, including MFSD12, are shown. b, Metabolite profiling of LysoIP samples from HEK-293T cells comparing lysosomes from wild-type and MFSD12 knock-out cells. ‘Accumulates upon inhibition of:’ has been previously reported (n = 4 independently prepared metabolite extracts, aP = 7.0×10⁻⁴, bP = 3.0×10⁻³, cP = 4.1×10⁻², dP = 4.2×10⁻², eP = 1.7×10⁻⁴). c, Lentiviral shRNA knock-down of MFSD12 quantified via qPCR and normalized to ACTB levels (n = 3 assays on independently prepared cDNA libraries, aP = 1.97×10⁻³, bP = 3.0×10⁻³). Error bars are mean ± s.e.m, P-values by two-sided Student’s t-test.
Extended Data Fig. 4.
Extended Data Fig. 4.. MFSD12 mediated cysteine transport is cysteine specific
a, Test of lysosomal counter-transport. Lysosomes were purified by differential centrifugation and incubated with water or 1 mM cysteine methyl ester before washing, resuspension, and incubated for 5 minutes with 20 μM cysteine and trace amounts of [35S]-cysteine (n = 3 independently performed assays per condition, aP =2.5×10⁻³, bP = 3.3×10⁻², NS = not significant). b, Lysosomal import of [14C]-cystine. Lysosomes were purified by differential centrifugation and incubated for 10 min with 1 μM [14C]-cystine, either untreated (Unreduced) or pre-treated with 10 mM DTT (Reduced, n = 6 independently performed assays per condition, aP = 2.1×10⁻⁷, bP = 1.3×10⁻⁶, cP = 3.8×10⁻⁸, NS = not significant). c, Competition for [35S]-cysteine transport. Lysosomes were purified by differential centrifugation and incubated for 10 minutes with 20 μM cysteine and trace amounts of [35S]-cysteine with 500 μM competitor where indicated (n = 3 independently performed assays per condition, P values compare competition condition versus water control condition (red), aP = 2.7×10⁻⁴, bP =2.5×10⁻⁴, cP = 3.2×10⁻⁴, NS = not significant). Error bars are mean ± s.e.m, P-values by two-sided Student’s t-test.
Fig. 1.
Fig. 1.. MelanoIP enables the rapid isolation of pure melanosomes
a, Schematic diagrams of the MelanoTag (GPR143-mScarlet-3xHA) and the MelanoIP workflow. b, Immunofluorescence analyses of B16F10 cells expressing the MelanoTag using antibodies to TYRP1 and the HA epitope tag. Cells were treated for two days with 10 μM forskolin before immunofluorescent labeling. TYRP1 and MelanoTag positive puncta are concentrated on the cell periphery, consistent with staining patterns observed previously for both markers . Micrographs are representative of the majority staining pattern and experiments were replicated in more than three independent experiments. Scale bar, 10 μm. c, Immunoblot analyses of whole-cell lysates, control immunoprecipitates (from cells expressing a myc-MelanoTag), and purified melanosomes (from cells expressing the HA-MelanoTag) prepared from murine B16F10 and human SKMEL30 cells. Melanosomal marker selection was guided by the ability of selected antibodies to react with either murine or human target proteins. Immunoblots are representative of more than three independent replicates. d, Untargeted polar metabolite profiling of melanosomes isolated from wild-type and Tyr knock-out cells. The red datapoint highlights a eumelanin synthesis intermediate with m/z and in silico MS/MS data consistent with indole-5,6-quinone ,, and the blue datapoints highlight all the detected proteogenic amino acids, including tyrosine, which is labelled (n = 3 independently prepared metabolite extracts). e, Metabolite profiling analysis of an annotated indole-5,6-quinone species and tyrosine in whole-cell lysates and purified melanosomes from wild-type and Tyr knock-out B16F10 cells. (n = 3 independently prepared metabolite extracts, aP = 1.2×10⁻³, bP = 4.2×10⁻², cP = 2.1×10⁻², N.D. = not detected). Error bars are mean ± s.e.m, P-values by two-sided Student’s t-test.
Fig. 2.
Fig. 2.. MFSD12 is necessary to maintain melanosomal cystine levels and produce cysteinyldopas
a, Untargeted polar metabolite profiling of melanosomes isolated from Mfsd12 knock-out and wild-type B16F10 cells. The red datapoint highlights cystine (n = 3 independently prepared extracts, P values by two-sided Student’s t-test). b, Follow-up metabolite analysis of cystine in B16F10 whole-cell lysates and purified melanosomes (n = 3 independently prepared metabolite extracts, aP = 4.8×10⁻⁵; bP = 1.0× 10⁻⁵). c, Metabolite profiling of cysteinyldopas in B16F10 whole-cell lysates. The ‘Minor Isomer’ and ‘Major Isomer’ are distinguished by retention time, and we annotate them to represent 2’-cysteinyldopa and 5’-cysteinyldopa, respectively (n = 3 independently prepared metabolite extracts, aP = 2.2×10⁻⁴, bP = 5.4×10⁻⁴, cP = 4.3×10⁻⁴, dP = 7.7×10⁻⁴, N.D. = not detected). d, Cystine levels in SKMEL30 whole-cell lysates and purified melanosomes (n = 3 independently prepared metabolite extracts, aP = 4.4×10⁻⁴). e, Levels of cysteinyldopas in SKMEL30 cells (n = 4 independently prepared metabolite extracts, aP =3.4×10⁻⁸, bP = 4.3×10⁻⁷). f, SKMEL30 cells lacking MFSD12 are darker than their wild-type counterparts. Photographs are of pellets containing 3 million SKMEL30 cells at the bottom of 1.5 mL centrifuge tubes. g, Schematic of proposed function for MFSD12 in melanosomes, whereby it controls the influx of cysteine into melanosomes, enabling the production of cystine, cysteinyldopas, and pheomelanin. Error bars are mean ± s.e.m, P-values by two-sided Student’s t-test.
Fig. 3.
Fig. 3.. MFSD12 is necessary to maintain lysosomal cystine and cysteine levels
a, Expression of pigmentation genes across tissues. FANTOM5 expression profiling data from Human Protein Atlas displayed as scaled tags per million ,. Full labels of tissues and additional pigmentation genes are displayed in Extended Fig. 3a. b, Untargeted polar metabolite profiling of lysosomes isolated from MFSD12 knock-out and wild-type HEK-293T cells (n = 6 independently prepared metabolite extracts per condition) c, Follow-up metabolite analysis of cystine and cysteine in whole-cell extracts and purified lysosomes. Samples were split and run via standard methods for cystine and derivatized with Ellman’s reagent to enable cysteine detection (n = 3 independently prepared metabolite extracts per condition, aP = 4.5×10⁻², bP = 3.6×10⁻², cP = 2.5×10⁻⁶, dP = 1.3×10⁻², eP = 1.3×10⁻³, fP = 2.9×10⁻⁴). d, Cystine measurements in whole-cell extracts and purified lysosomes. To generate MFSD12&CTNS combined knock-out cells, MFSD12 was deleted from the CTNS knock-out cells (n = 3 independently prepared metabolite extracts per condition, aP = 1.4×10⁻², bP = 3.0×10⁻², cP = 1.9×10⁻³, dP = 1.9×10⁻³, eP = 2.1×10⁻³). e, Cystine measurements in whole-cell extracts and purified lysosomes from patient-derived fibroblasts. Matched unaffected parental (GM00906) and cystinotic patient (GM00379) fibroblast cell lines were obtained from the Coriell institute. Cells were grown to confluence to arrest division before cystine was measured (n= 4 – 6 independently prepared metabolite extracts per condition, aP = 1.5×10⁻⁷, bP = 5.0×10⁻⁶, cP = 1.1×10⁻³, dP = 1.5×10⁻⁷, eP = 1.7×10⁻⁴, fP = 4.2×10⁻⁵). f, Schematic of proposed role of MFSD12 in lysosomes in which it is upstream of CTNS in the lysosomal cystine/cysteine cycle. Error bars are mean ± s.e.m, P-values by two-sided Student’s t-test.
Fig. 4.
Fig. 4.. MFSD12 is necessary and likely sufficient for the import of cysteine into melanosomes and lysosomes
a and b, Measurements of [14C] in melanosomes and lysosomes from cells exposed to [14C]-cystine. MelanoTag-expressing B16F10 cells or LysoTag-expressing HEK-293T cells were incubated with 1.2μM [14C]-cystine for 1 hour, upon which organelles were isolated via the MelanoIP or LysoIP methods. For the lysosomal assays (b), whole-cell and immunoprecipitated samples were normalized using hexosaminidase assay (n = 3 independently prepared purifications per condition, aP =1.7×10⁻², bP = 1.2×10⁻³). c, Cysteine uptake assay into isolated lysosomes prepared by differential centrifugation. To track import, 20μM unlabeled cysteine was added with trace amounts of [35S]-cysteine (n = 3 independently performed assays per condition, aP = 3.5×10⁻⁴). d, Cysteine and tyrosine uptake assays into isolated lysosomes. Lysosome preparation and cysteine import was performed as in c. [3H]-tyrosine was added at a concentration of 500nM. ‘Competitor’ refers to an unlabeled analog of the radiolabeled compound used for each assay (n = 3 independently performed assays per condition, aP = 1.7×10⁻³, bP = 2.4×10⁻³, cP = 2.7×10⁻³, dP =1.9×10⁻³, NS = not significant). e, Immunofluorescence of HEK-293T cells expressing wild-type MFSD12 or MFSD12LL253−254AA mutant (MFSD12PM). MFSD12–3xHA was visualized with an anti-HA epitope tag antibody. Wheat-germ agglutinin (WGA) was used to mark the plasma membrane. Micrographs shown are representative of the majority staining pattern from three independent experiments. Scale bar, 10μm. f, Cysteine uptake in whole-cells expressing MFSD12PM. Cells expressing the indicated proteins were incubated in a buffer containing inhibitors of native cysteine transport before the addition of cysteine. Under the non-competed conditions, 10μM unlabeled cysteine was added with a trace amount of [35S]-cysteine (n = 3 independently performed assays per condition, aP = 2.0×10⁻², NS = not significant). Error bars are mean ± s.e.m, P-values by two-sided Student’s t-test.

References

    1. Basrur V. et al. Proteomic Analysis of Early Melanosomes: Identification of Novel Melanosomal Proteins. J. Proteome Res. 2, 69–79 (2003). - PubMed
    1. Sturm RA Molecular genetics of human pigmentation diversity. Human Molecular Genetics 18, R9–R17 (2009). - PubMed
    1. Adhikari K. et al. A GWAS in Latin Americans highlights the convergent evolution of lighter skin pigmentation in Eurasia. Nat Commun 10, (2019). - PMC - PubMed
    1. Crawford NG et al. Loci associated with skin pigmentation identified in African populations. Science 358, (2017). - PMC - PubMed
    1. D’Alba L. & Shawkey MD Melanosomes: Biogenesis, Properties, and Evolution of an Ancient Organelle. Physiological Reviews 99, 1–19 (2019). - PubMed

METHODS REFERENCES

    1. Djoumbou-Feunang Y. et al. CFM-ID 3.0: Significantly Improved ESI-MS/MS Prediction and Compound Identification. Metabolites 9, 72 (2019). - PMC - PubMed
    1. Wishart DS et al. HMDB: the Human Metabolome Database. Nucleic Acids Res. 35, D521–526 (2007). - PMC - PubMed
    1. Guan X, Hoffman B, Dwivedi C. & Matthees DP A simultaneous liquid chromatography/mass spectrometric assay of glutathione, cysteine, homocysteine and their disulfides in biological samples. Journal of Pharmaceutical and Biomedical Analysis 31, 251–261 (2003). - PubMed
    1. Martin GB et al. Development of a mass spectrometry method for the determination of a melanoma biomarker, 5-S-cysteinyldopa, in human plasma using solid phase extraction for sample clean-up. Journal of Chromatography A 1156, 141–148 (2007). - PubMed
    1. Ito S. & Prota GMA A facile one-step synthesis of cysteinyldopas using mushroom tyrosinase. Experientia 33, 1118–1119 (1977). - PubMed

Publication types