

Imaging effects of hyperosmolality on individual tricellular junctions
- PMID: 33209250
- PMCID: PMC7643560
- DOI: 10.1039/c9sc05114g
Imaging effects of hyperosmolality on individual tricellular junctions
Abstract
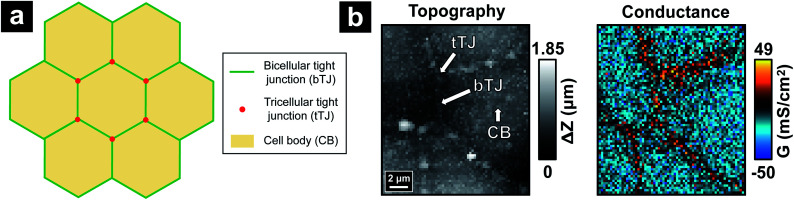
The use of hyperosmolar agents (osmotherapy) has been a major treatment for intracranial hypertension, which occurs frequently in brain diseases or trauma. However, side-effects of osmotherapy on the brain, especially on the blood-brain barrier (BBB) are still not fully understood. Hyperosmolar conditions, termed hyperosmolality here, are known to transiently disrupt the tight junctions (TJs) at the endothelium of the BBB resulting in loss of BBB function. Present techniques for evaluation of BBB transport typically reveal aggregated responses from the entirety of BBB transport components, with little or no opportunity to evaluate heterogeneity present in the system. In this study, we utilized potentiometric-scanning ion conductance microscopy (P-SICM) to acquire nanometer-scale conductance maps of Madin-Darby Canine Kidney strain II (MDCKII) cells under hyperosmolality, from which two types of TJs, bicellular tight junctions (bTJs) and tricellular tight junctions (tTJs), can be visualized and differentiated. We discovered that hyperosmolality leads to increased conductance at tTJs without significant alteration in conductance at bTJs. To quantify this effect, an automated computer vision algorithm was designed to extract and calculate conductance components at both tTJs and bTJs. Additionally, lowering Ca2+ concentration in the bath facilitates tTJ disruption under hyperosmolality. Strengthening tTJ structure by overexpressing immunoglobulin-like domain-containing receptor 1 (ILDR1) protein abrogates the effect of hyperosmolality. We posit that osmotic stress physically disrupts tTJ structure, as evidenced by super-resolution microscopy. Findings from this study not only provide a high-resolution view of TJ structure and function, but also can inform current osmotherapy and drug delivery strategies for brain diseases.
This journal is © The Royal Society of Chemistry 2020.
Figures


References
-
- Ropper A. H. Arch. Neurol. 1984;41:26–29. - PubMed
-
- Chen C.-H., Toung T. J. K., Sapirstein A., Bhardwaj A. J. Cereb. Blood Flow Metab. 2005;26:951–958. - PubMed
-
- Binder D. K., Horton J. C., Lawton M. T., McDermott M. W. Neurosurgery. 2004;54:538–552. - PubMed
-
- Bhardwaj A., Ulatowski J. A. Curr. Opin. Crit. Care. 2004;10:126–131. - PubMed
Grants and funding
LinkOut - more resources
Full Text Sources
Miscellaneous