

DEEPScreen: high performance drug-target interaction prediction with convolutional neural networks using 2-D structural compound representations
- PMID: 33209251
- PMCID: PMC7643205
- DOI: 10.1039/c9sc03414e
DEEPScreen: high performance drug-target interaction prediction with convolutional neural networks using 2-D structural compound representations
Abstract
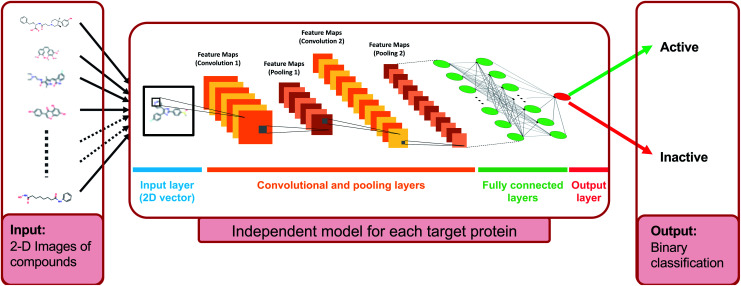
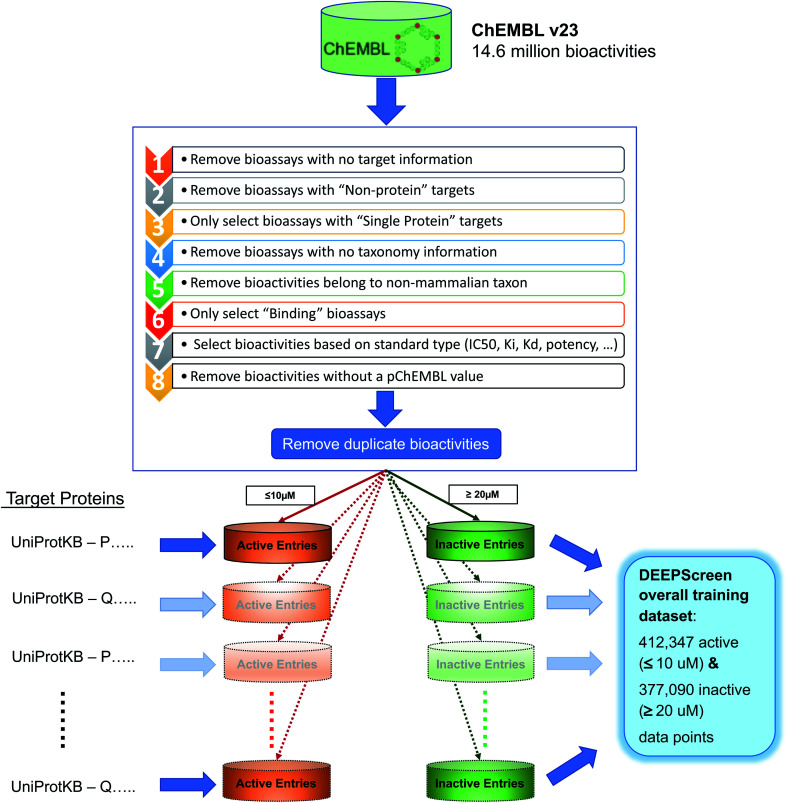
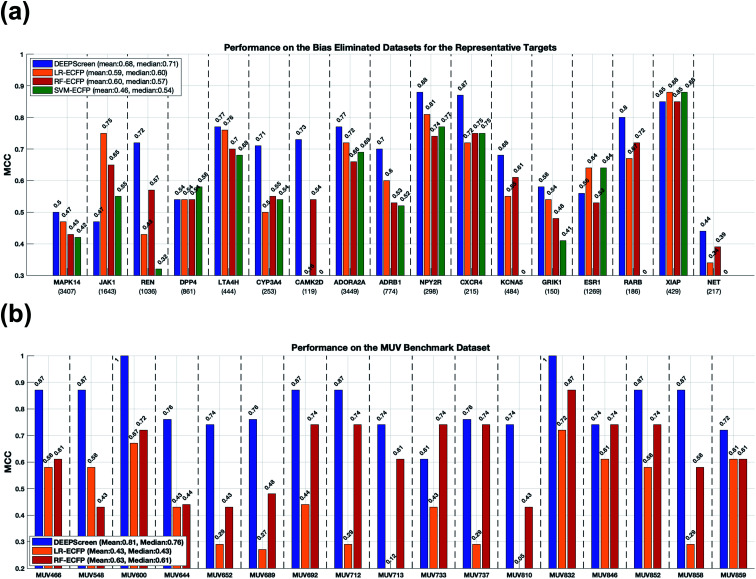
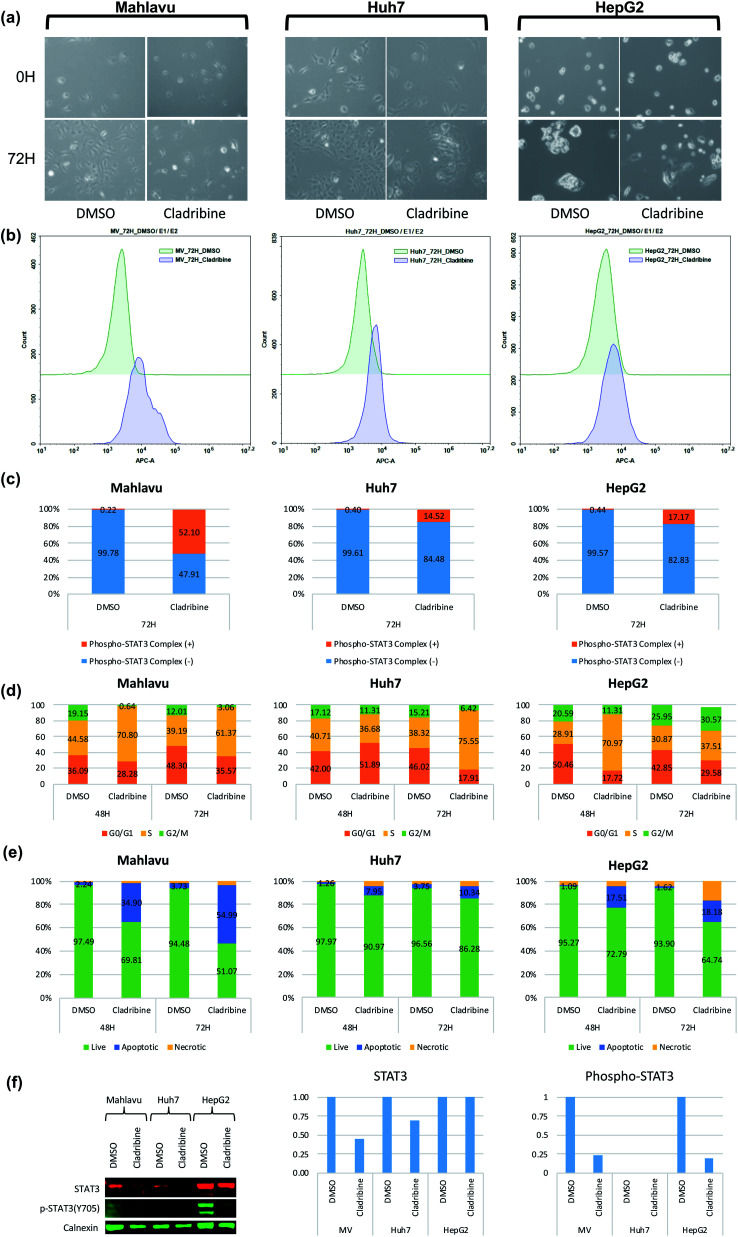
The identification of physical interactions between drug candidate compounds and target biomolecules is an important process in drug discovery. Since conventional screening procedures are expensive and time consuming, computational approaches are employed to provide aid by automatically predicting novel drug-target interactions (DTIs). In this study, we propose a large-scale DTI prediction system, DEEPScreen, for early stage drug discovery, using deep convolutional neural networks. One of the main advantages of DEEPScreen is employing readily available 2-D structural representations of compounds at the input level instead of conventional descriptors that display limited performance. DEEPScreen learns complex features inherently from the 2-D representations, thus producing highly accurate predictions. The DEEPScreen system was trained for 704 target proteins (using curated bioactivity data) and finalized with rigorous hyper-parameter optimization tests. We compared the performance of DEEPScreen against the state-of-the-art on multiple benchmark datasets to indicate the effectiveness of the proposed approach and verified selected novel predictions through molecular docking analysis and literature-based validation. Finally, JAK proteins that were predicted by DEEPScreen as new targets of a well-known drug cladribine were experimentally demonstrated in vitro on cancer cells through STAT3 phosphorylation, which is the downstream effector protein. The DEEPScreen system can be exploited in the fields of drug discovery and repurposing for in silico screening of the chemogenomic space, to provide novel DTIs which can be experimentally pursued. The source code, trained "ready-to-use" prediction models, all datasets and the results of this study are available at ; https://github.com/cansyl/DEEPscreen.
This journal is © The Royal Society of Chemistry 2020.
Figures


Similar articles
-
MDeePred: novel multi-channel protein featurization for deep learning-based binding affinity prediction in drug discovery.Bioinformatics. 2021 May 5;37(5):693-704. doi: 10.1093/bioinformatics/btaa858. Bioinformatics. 2021. PMID: 33067636
-
How to approach machine learning-based prediction of drug/compound-target interactions.J Cheminform. 2023 Feb 6;15(1):16. doi: 10.1186/s13321-023-00689-w. J Cheminform. 2023. PMID: 36747300 Free PMC article.
-
Protein domain-based prediction of drug/compound-target interactions and experimental validation on LIM kinases.PLoS Comput Biol. 2021 Nov 29;17(11):e1009171. doi: 10.1371/journal.pcbi.1009171. eCollection 2021 Nov. PLoS Comput Biol. 2021. PMID: 34843456 Free PMC article.
-
Open-source chemogenomic data-driven algorithms for predicting drug-target interactions.Brief Bioinform. 2019 Jul 19;20(4):1465-1474. doi: 10.1093/bib/bby010. Brief Bioinform. 2019. PMID: 29420684 Free PMC article. Review.
-
Data Centric Molecular Analysis and Evaluation of Hepatocellular Carcinoma Therapeutics Using Machine Intelligence-Based Tools.J Gastrointest Cancer. 2021 Dec;52(4):1266-1276. doi: 10.1007/s12029-021-00768-x. Epub 2021 Dec 15. J Gastrointest Cancer. 2021. PMID: 34910274 Review.
Cited by
-
Generative artificial intelligence in drug discovery: basic framework, recent advances, challenges, and opportunities.Front Pharmacol. 2024 Feb 7;15:1331062. doi: 10.3389/fphar.2024.1331062. eCollection 2024. Front Pharmacol. 2024. PMID: 38384298 Free PMC article. Review.
-
Discovery of novel dual adenosine A1/A2A receptor antagonists using deep learning, pharmacophore modeling and molecular docking.PLoS Comput Biol. 2021 Mar 19;17(3):e1008821. doi: 10.1371/journal.pcbi.1008821. eCollection 2021 Mar. PLoS Comput Biol. 2021. PMID: 33739970 Free PMC article.
-
The changing scenario of drug discovery using AI to deep learning: Recent advancement, success stories, collaborations, and challenges.Mol Ther Nucleic Acids. 2024 Aug 8;35(3):102295. doi: 10.1016/j.omtn.2024.102295. eCollection 2024 Sep 10. Mol Ther Nucleic Acids. 2024. PMID: 39257717 Free PMC article. Review.
-
A review of deep learning methods for ligand based drug virtual screening.Fundam Res. 2024 Mar 11;4(4):715-737. doi: 10.1016/j.fmre.2024.02.011. eCollection 2024 Jul. Fundam Res. 2024. PMID: 39156568 Free PMC article. Review.
-
Graph regularized non-negative matrix factorization with prior knowledge consistency constraint for drug-target interactions prediction.BMC Bioinformatics. 2022 Dec 29;23(1):564. doi: 10.1186/s12859-022-05119-6. BMC Bioinformatics. 2022. PMID: 36581822 Free PMC article.
References
LinkOut - more resources
Full Text Sources
Miscellaneous