. 2020 Aug 26;4(11):e10397.
doi: 10.1002/jbm4.10397. eCollection 2020 Nov.

Obesity Represses CYP2R1, the Vitamin D 25-Hydroxylase, in the Liver and Extrahepatic Tissues

Affiliations

Obesity Represses CYP2R1, the Vitamin D 25-Hydroxylase, in the Liver and Extrahepatic Tissues

Mahmoud-Sobhy Elkhwanky et al. JBMR Plus. .

Abstract

Low plasma level of 25-hydroxyvitamin D (25-OH-D), namely vitamin D deficiency, is associated with obesity and weight loss improves 25-OH-D status. However, the mechanism behind obesity-induced vitamin D deficiency remains unclear. Here, we report that obesity suppresses the expression of cytochrome P450 (CYP) 2R1, the main vitamin D 25-hydroxylase, in both mice and humans. In humans, weight loss induced by gastric bypass surgery increased the expression of CYP2R1 in the s.c. adipose tissue suggesting recovery after the obesity-induced suppression. At the same time, CYP27B1, the vitamin D 1α-hydroxylase, was repressed by the weight loss. In a mouse (C57BL/6N) model of diet-induced obesity, the plasma 25-OH-D was decreased. In accordance, the CYP2R1 expression was strongly repressed in the liver. Moreover, obesity repressed the expression of CYP2R1 in several extrahepatic tissues, the kidney, brown adipose tissue, and testis, but not in the white adipose tissue. Obesity had a similar effect in both male and female mice. In mice, obesity repressed expression of the vitamin D receptor in brown adipose tissue. Obesity also upregulated the expression of the vitamin D receptor and CYP24A1 in the s.c. adipose tissue of a subset of mice; however, no effect was observed in the human s.c. adipose tissue. In summary, we show that obesity affects CYP2R1 expression both in the mouse and human tissues. We suggest that in mouse the CYP2R1 repression in the liver plays an important role in obesity-induced vitamin D deficiency. Currently, it is unclear whether the CYP2R1 downregulation in extrahepatic tissues could contribute to the obesity-induced low plasma 25-OH-D, however, this phenomenon may affect at least the local 25-OH-D concentrations. © 2020 The Authors. JBMR Plus published by Wiley Periodicals LLC on behalf of American Society for Bone and Mineral Research.

Keywords: 25‐HYDROXYVITAMIN D; CYP24A1; CYP27B1; CYP2R1; HIGH‐FAT DIET; OBESITY; VITAMIN D; VITAMIN D RECEPTOR.


Figures

Fig 1
Fig 1
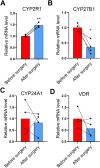
Effect of obesity surgery‐induced weight loss on vitamin D metabolism‐related mRNAs in human s.c. white adipose tissue. (A) CYP2R1, (B) CYP27B1, (C) CYP24A1, and (D) vitamin D receptor (VDR; n = 4). The data were analyzed with paired t test. Please note that the expression level of CYP27B1 was very low and close to the detection level.
Fig 2
Fig 2
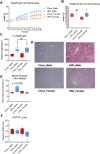
Effect of high‐fat diet (HFD) on male and female mice. (AC) Weight gain in the male and female mice. (D) The oil red O staining of liver sections.10× magnification. (E) Nonfasted blood glucose. (F) PEPCK mRNA expression in the liver. Male, chow‐fed = 4, HFD = 7; female, chow‐fed = 5, HFD = 7. The box‐and‐whisker plots indicate the minimum, the 25th percentile, the median, the 75th percentile, and the maximum. In addition, the mean is indicated with +. All data were analyzed with a two‐tailed t test.
Fig 3
Fig 3
Obesity in mice reduces the plasma 25‐hydroxyvitamin D and represses the CYP2R1 in the liver. (A) Plasma levels of 25‐OH‐D. (B) Liver CYP2R1 mRNA expression in the males, females, and both genders combined. (C) Liver CYP2R1 protein expression. (D) Liver vitamin D binding protein mRNA. Male, chow‐fed = 4, HFD = 7; female, chow‐fed = 5, HFD = 7. The box‐and‐whisker plots indicate the minimum, the 25th percentile, the median, the 75th percentile, and the maximum. In addition, the mean is indicated with +. In the dot blot, the mean is indicated. All data were analyzed with a two‐tailed t test. HFD = high fat diet; VDBP = vitamin D binding protein.
Fig 4
Fig 4
Absolute quantification of the CYP2R1 mRNA in liver and extrahepatic tissues of male and female mice. The bars indicate mean ± SD. Individual biological samples are indicated with +. The data were analyzed with a two‐tailed t test. BAT = Brown adipose tissue; WATsc = s.c. white adipose tissue; WATvc = visceral white adipose tissue.
Fig 5
Fig 5
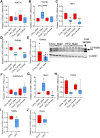
High‐fat‐diet– (HFD‐) induced obesity modulates the expression of CYP2R1 in extrahepatic tissues. Obesity had no significant effect on the CYP2R1 expression in (A) visceral white adipose tissue (WATvc) or (B) s.c. white adipose tissue (WATsc) in male and female mice. (C) Obesity repressed the CYP2R1 significantly in the brown adipose tissue (BAT). (D) Obesity significantly repressed the CYP2R1 mRNA in kidneys of male and female mice. (E) CYP2R1 protein was detected only in the male kidneys and it was decreased by obesity. (F) Obesity had no effect on the CYP2R1 expression in duodenum. (G) Obesity had an opposite effect on the CYP2R1 expression in the male and female ileum. (H) Obesity significantly repressed the CYP2R1 in the colon of the male mice. (I) Obesity repressed CYP2R1 in the testis, but (J) had no effect in the ovary. Male, chow‐fed = 4, HFD = 7; female, chow‐fed = 5, HFD = 7. The box‐and‐whisker plots indicate the minimum, the 25th percentile, the median, the 75th percentile, and the maximum. In addition, the mean is indicated with +. All data were analyzed with a two‐tailed t test.
Fig 6
Fig 6
Fasting and activation of glucocorticoid receptor (GR) represses CYP2R1 in the kidney. (A) 12‐Hour fasting significantly repressed the CYP2R1 in kidney compared with chow‐fed controls (n = 10/group). (B) Dexamethasone (DEXA) treatment in mice significantly repressed the CYP2R1 in kidney, and cotreatment with the GR antagonist mifepristone (MIF) abolished the effect of DEXA (vehicle and DEXA, n = 7/group, MIF = 7, DEXA + MIF = 6). (C) GR antagonist MIF did not abolish the effect of fasting on the CYP2R1 in kidney (n = 8/group). (D) PGC‐1α knockout did not abolish the effect of fasting on the CYP2R1 in mouse kidney (PGC‐1α+/+ fed/fast n = 7/group, PGC‐1α−/− fed/fast n = 6/group). The box‐and‐whisker plots indicate the minimum, the 25th percentile, the median, the 75th percentile, and the maximum. In addition, the mean is indicated with +. (A) Analyzed with two‐tailed t test. (C,D) Analyzed with one‐way ANOVA (Tukey's post hoc test, 95% CI). *significance compared to vehicle controls and significance compared as indicated in the figure.
Fig 7
Fig 7
High‐fat‐diet– (HFD‐) induced obesity modulates the vitamin D receptor (VDR) expression in male and female mice tissues. (A) Obesity caused highly variable response in the s.c. white adipose tissue (WATsc) of male and female mice.(B) Obesity had no effect on the VDR expression in visceral white adipose tissue (WATvc) of male mice; however, it modestly induced VDR in the WATvc of female mice. (C) Obesity repressed VDR in the brown adipose tissue (BAT) in male and female mice. Obesity significantly repressed VDR expression in (D) duodenum of male mice only, whereas obesity had no effect on the VDR expression in (E) ileum and (F) colon. Obesity repressed the VDR in (G) testis and (H) ovary. (I) Obesity had no effect on the VDR expression in the kidneys. Male, chow‐fed = 4, HFD = 7; female, chow‐fed = 5, HFD = 7. The box‐and‐whisker plots indicate the minimum, the 25th percentile, the median, the 75th percentile, and the maximum. In addition, the mean is indicated with +. All data were analyzed with a two‐tailed t test, except (A) (males only) was analyzed with a Mann–Whitney test.
Fig 8
Fig 8
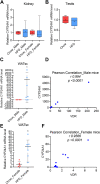
Effect of high‐fat‐diet– (HFD‐) induced obesity on CYP24A1 in the extrahepatic tissues. Obesity had no effect on the CYP24A1 expression in (A) kidney and (B) testis. (C) HFD caused highly variable response in the s.c. white adipose tissue (WATsc) of male mice. (D) Pearson correlation of CYP24A1 and VDR mRNA expression in the male mice. The analysis included both the chow‐ and HFD‐fed mice. (E) HFD caused variable response in the s.c. white adipose tissue (WATsc) of female mice. (F) Pearson correlation of CYP24A1 and vitamin D receptor mRNA expression in the female mice. The analysis included both the chow‐ and HFD‐fed mice. Male, chow‐fed = 4, HFD = 7; female, chow‐fed = 5, HFD = 7. The box‐and‐whisker plots indicate the minimum, the 25th percentile, the median, the 75th percentile, and the maximum. In addition, the mean is indicated with +. (A, B, E) were analyzed with the two‐tailed t test, and (C) was analyzed with a Mann–Whitney test.

References

    1. Caprio M, Infante M, Calanchini M, Mammi C, Fabbri A. Vitamin D: not just the bone. Evidence for beneficial pleiotropic extraskeletal effects. Eating Weight Disord. 2017;22:27–41. - PubMed
    1. Kulie T, Groff A, Redmer J, Hounshell J, Schrager S. Vitamin D: an evidence‐based review. J Am Board Fam Med. 2009;22:698–706. - PubMed
    1. Samuel L, Borrell LN. The effect of body mass index on adequacy of serum 25‐hydroxyvitamin D levels in US adults: The National Health and Nutrition Examination Survey 2001 to 2006. Ann Epidemiol. 2014;24:781–4. - PubMed
    1. Censani M, Stein EM, Shane E, et al. Vitamin D deficiency is prevalent in morbidly obese adolescents prior to bariatric surgery. ISRN Obes. 2013;2013:284516. - PMC - PubMed
    1. Stein EM, Strain G, Sinha N, et al. Vitamin D insufficiency prior to bariatric surgery: risk factors and a pilot treatment study. Clin Endocrinol (Oxf). 2009;71:176–83. - PMC - PubMed

LinkOut - more resources