. 2020 Oct 14;4(11):e10408.
doi: 10.1002/jbm4.10408. eCollection 2020 Nov.

Loss of Adenylyl Cyclase 6 in Leptin Receptor-Expressing Stromal Cells Attenuates Loading-Induced Endosteal Bone Formation

Affiliations

Loss of Adenylyl Cyclase 6 in Leptin Receptor-Expressing Stromal Cells Attenuates Loading-Induced Endosteal Bone Formation

Mathieu Riffault et al. JBMR Plus. .

Abstract

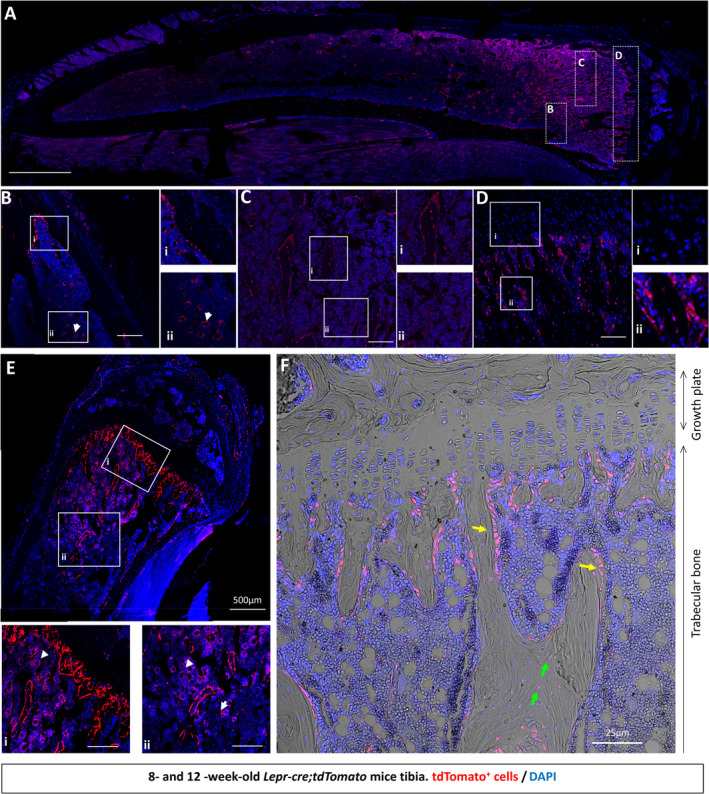
Bone marrow stromal/stem cells represent a quiescent cell population that replenish the osteoblast bone-forming cell pool with age and in response to injury, maintaining bone mass and repair. A potent mediator of stromal/stem cell differentiation in vitro and bone formation in vivo is physical loading, yet it still remains unclear whether loading-induced bone formation requires the osteogenic differentiation of these resident stromal/stem cells. Therefore, in this study, we utilized the leptin receptor (LepR) to identify and trace the contribution of bone marrow stromal cells to mechanoadaptation of bone in vivo. Twelve-week-old Lepr-cre;tdTomato mice were subjected to compressive tibia loading with an 11 N peak load for 40 cycles, every other day for 2 weeks. Histological analysis revealed that Lepr-cre;tdTomato+ cells arise perinatally around blood vessels and populate bone surfaces as lining cells or osteoblasts before a percentage undergo osteocytogenesis. Lepr-cre;tdTomato+ stromal cells within the marrow increase in abundance with age, but not following the application of tibial compressive loading. Mechanical loading induces an increase in bone mass and bone formation parameters, yet does not evoke an increase in Lepr-cre;tdTomato+ osteoblasts or osteocytes. To investigate whether adenylyl cyclase-6 (AC6) in LepR cells contributes to this mechanoadaptive response, Lepr-cre;tdTomato mice were further crossed with AC6 fl/fl mice to generate a LepR+ cell-specific knockout of AC6. These Lepr-cre;tdTomato;AC6 fl/fl animals have an attenuated response to compressive tibia loading, characterized by a deficient load-induced osteogenic response on the endosteal bone surface. This, therefore, shows that Lepr-cre;tdTomato+ cells contribute to short-term bone mechanoadaptation. © 2020 The Authors. JBMR Plus published by Wiley Periodicals LLC on behalf of American Society for Bone and Mineral Research.

Keywords: ADENYLYL CYCLASE 6; BONE ADAPTATION; IN VIVO MECHANICAL LOADING; MECHANOBIOLOGY; STEM CELLS.


Figures

Fig 1
Fig 1
tdTomato+ bone marrow cells appear around sinusoids and contribute to osteoblast and osteocyte populations over time in trabecular bone. To assess whether LepR‐cre was actively expressed in adult tibia, limbs were harvested from 8‐ and 12‐week‐old Lepr‐cre;tdTomato mice and processed for histological analyses with the nuclear dye 4,6‐diamidino‐2‐phenylindole (DAPI). (A) Representative image of an 8‐week‐old tibia, showing ROIs. (BD) Confocal microscopy revealed tdTomato+ signal in 8‐week‐old trabecular bone marrow (BBi), perivascularly in the marrow space (arrow head; Bii), in trabecular bone (C), and below the growth plate (D). (Di) No staining was found in the growth plate. (EF) Confocal microscopy revealed tdTomato+ signal in 12‐week‐old mice along the trabecular bone (E) and in trabecular bone marrow (Ei,ii). (Ei,ii) tdTomato+ was found to be perivascular in the marrow space (arrow head). (F) No staining was found in the growth plate. Additionally, tdTomato+ is expressed on the bone surface (yellow arrow) and embedded within bone (green arrow) in 12‐week‐old mice. N = 4. Scale bar = 50 μm unless otherwise indicated.
Fig 2
Fig 2
tdTomato+ bone marrow cells appear around sinusoids and contribute to osteoblast and osteocyte populations over time in cortical bone. To assess whether LepR‐cre was actively expressed in adult tibia, limbs were harvested from 8‐ and 12‐week‐old mice. Lepr‐cre;tdTomato mice were processed for histological analyses with the nuclear dye 4,6‐diamidino‐2‐phenylindole (DAPI). (A) tdTomato+ signal was found on the endosteal surface of cortical bone at 8 weeks. (BD) Representative image of a 12‐week‐old tibia. (Ci,ii) confocal microscopy revealed LepR signal perivascularly in the marrow space (Ci) and along the cortical bone surface (Cii). (D) LepR is expressed on the bone surface (yellow arrow) and embedded within bone (green arrow). N = 4. Scale bar = 50 μm. (E) Flow cytometry analyses revealed that in 12‐week‐old mice tdTomato+ make‐up 1.23% to 7.65% and 1.35% to 6.36% of bone marrow cells in the tibia and femur, respectively. (F) Exclusion of CD45/Ter119+ cells reveals 0.07% to 0.35% and 0.09% to 0.34% tdTomato+ cells in the tibia and femur, respectively. N = 3. Values are percentages ±SD.
Fig 3
Fig 3
Axial tibia loading of 12‐week‐old Lepr‐cre;tdTomato mice. (A) Schematic of the experimental plan and tibia loading setup. (B) The right tibia of 12‐week‐old mice was axially loaded at 11 N for 40 cycles with 10‐second rest periods per day for 14 days. The left tibias were not loaded and were used as nonloaded internal controls. (C) Schematic representation of analyses done on tibias. Whole‐bone μCT was performed and cortical bone analyzed between 15% and 90% of the total tibial length. Confocal microscopy of cryosections and dynamic histomorphometry were performed on cross‐sections located between 45% and 50% of the tibial length. (D) Whole‐bone analyses of cortical bone between 15% and 85% of the total tibial length, excluding proximal and distal metaphyseal bone, showing cross‐sectional area and ellipticity. Loaded: red, static: black, line graphs represent means ± SEM, n = 7. Statistical significance of differences along the entire tibial shaft is represented as a heat map, red p < 0.001, yellow 0.001 ≤ p < 0.01, green 0.01 ≤ p < 0.05, and blue p ≥ 0.05. (EF) Dynamic histomorphometry analysis of tibial transverse section reveals tibial compressive loading enhances endosteal and periosteal cortical bone formation. Relative mineralizing surface over bone surface, mineral apposition rate, and bone formation rate at the endosteal (E) and periosteal (F) surface of mechanically loaded tibia. N = 5. Mean ± SD.
Fig 4
Fig 4
Tibial compressive loading does not alter proliferation or location of Lepr‐cre;tdTomato cells. (AB) Flow cytometry analyses of bone marrow cells following mechanical loading of Lepr‐cre;tdTomato mouse tibia. (A) Flow cytometry analyses revealed loading did not alter the percentage of tdTomato+ cells. (B) Exclusion of CD45 + and Ter119+ cells reveals a trend towards an increase in tdTomato+ cells following tibia loading; n = 4. (C,D) Tibial compressive loading does not alter the location of tdTomato+ cells. (C) Representative image of tibia transection; scale bar = 100 μm. (D) The percentage of tdTomato+ cells on the endosteal or periosteal surface and embedded with the bone was not altered in cortical bone following tibia compressive loading; N = 7. (E) Analysis of the location of bone formation along the surface of the endosteum. Upper graph: Average number of label observed by dynamic histomorphometry; n = 4. Lower graph: Average number of tdTomato+ cells observed lining endosteum surface on confocal images; n = 3. Statistical tests employed unpaired two‐tailed student t test. Mean ± SD; *p < 0.05.
Fig 5
Fig 5
Phenotypic analysis of Lepr‐cre;tdTomato and Lepr‐cre;tdTomato;AC6 fl/fl mice at 8 and 12 weeks. (A) Photographs of Lepr‐cre;tdTomato and Lepr‐cre;tdTomato;AC6 fl/fl mice at 12 weeks old. (B) Full‐body μCT scans comparing the two genotypes. (C) Gel electrophoresis of genotyping showing a band at 260 bp for AC6 floxed gene. (D) Cortical bone midshaft geometry of 12‐week‐old Lepr‐cre;tdTomato and Lepr‐cre;tdTomato;AC6 fl/fl mice.
Fig 6
Fig 6
Axial tibia loading of 12‐week‐old Lepr‐cre;tdTomato;AC6 fl/fl mice. (A) Whole‐bone analyses of cortical bone of mice lacking AC6 between 15% and 85% of the total tibial length, excluding proximal and distal methaphyseal bone showing cross‐sectional area and ellipticity. Loaded: red, static: black, line graphs represent means ± SEM, n = 6. Statistical significance of differences along the entire tibial shaft is represented as a heat map, red p < 0.001, yellow 0.001 ≤ p < 0.01, green 0.01 ≤ p < 0.05, and blue p ≥ 0.05. (B,C) Mice lacking AC6 showed poor mineralization on the endosteal surface, indicated by a lack of labeling at the endosteal surface in both loaded and nonloaded tibias. (B) Relative mineralizing surface over bone surface, mineral apposition rate, and bone formation rate at the endosteal surface of mechanically loaded tibia. (C) Relative mineralizing surface over bone surface, mineral apposition rate, and bone formation rate at the periosteal surface. N = 5 for Lepr‐cre;tdTomato. N = 3 for Lepr‐cre;tdTomato;AC6 fl/fl . Mean ± SD.
Fig 7
Fig 7
Tibial compressive loading does not alter proliferation or location of Lepr‐cre;tdTomato cells in Lepr‐cre;tdTomato and Lepr‐cre;tdTomato;AC6 fl/fl mice. (A) Representative image of tibia transection of Lepr‐cre;tdTomato;AC6 fl/fl mice following tibia compressive loading; scale bar = 100 μm. (B) The percentage of tdTomato+ cells on the endosteal and periosteal surfaces and embedded with the bone was not altered in cortical bone; N = 4. Statistical tests employed unpaired two‐tailed student t test with Wilcoxon correction. Mean ± SD. (C) Analysis of the location of bone formation along the surface of the endosteum. Upper graph: Average number of label observed by dynamic histomorphometry; n = 4. Lower graph: Average number of tdTomato+ cells observed lining endosteum surface on confocal images; n = 3). Statistical tests employed unpaired two‐tailed student t test. Mean ± SD; *p < 0.05.

Similar articles

Cited by

References

    1. Frost HM. Skeletal structural adaptations to mechanical usage (SATMU): 1. Redefining Wolff's law: the bone modeling problem. Anat Rec. 1990;226(4):403–13. - PubMed
    1. Meakin LB, Price JS, Lanyon LE. The contribution of experimental in vivo models to understanding the mechanisms of adaptation to mechanical loading in bone. Front Endocrinol. 2014;5:154. - PMC - PubMed
    1. Zhou BO, Yue R, Murphy MM, Peyer JG, Morrison SJ. Leptin‐receptor‐expressing mesenchymal stromal cells represent the main source of bone formed by adult bone marrow. Cell Stem Cell. 2014;15(2):154–68. - PMC - PubMed
    1. Park D, Spencer JA, Koh BI, et al. Endogenous bone marrow MSCs are dynamic, fate‐restricted participants in bone maintenance and regeneration. Cell Stem Cell. 2012;10(3):259–72. - PMC - PubMed
    1. Stavenschi E, Labour MN, Hoey DA. Oscillatory fluid flow induces the osteogenic lineage commitment of mesenchymal stem cells: the effect of shear stress magnitude, frequency and duration. J Biomech. 2017;55:99–106. - PubMed

LinkOut - more resources