

Zoledronic Acid Is Not Equally Potent on Osteoclasts Generated From Different Individuals
- PMID: 33210064
- PMCID: PMC7657394
- DOI: 10.1002/jbm4.10412
Zoledronic Acid Is Not Equally Potent on Osteoclasts Generated From Different Individuals
Abstract
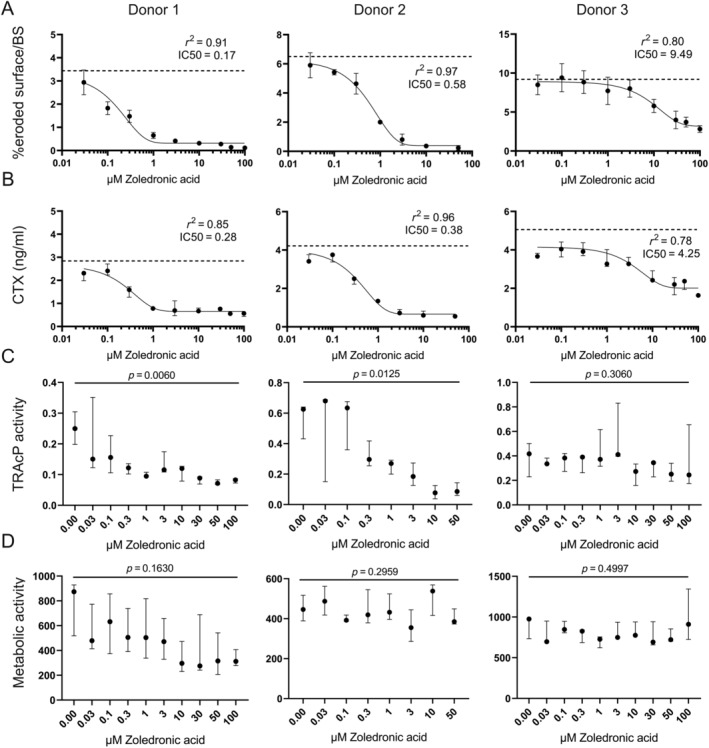
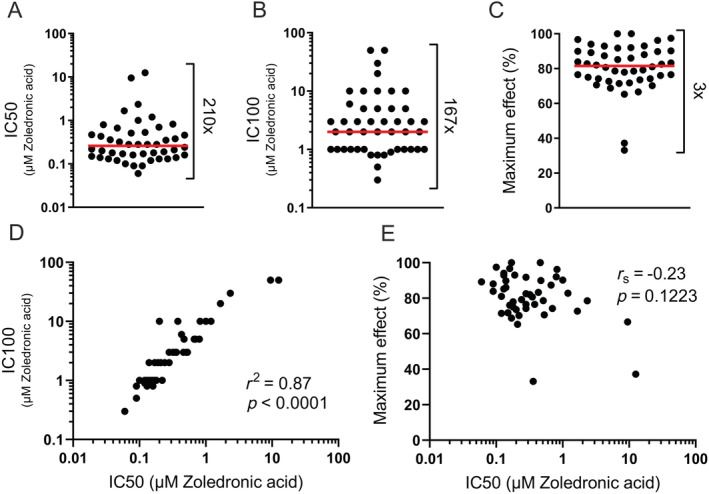
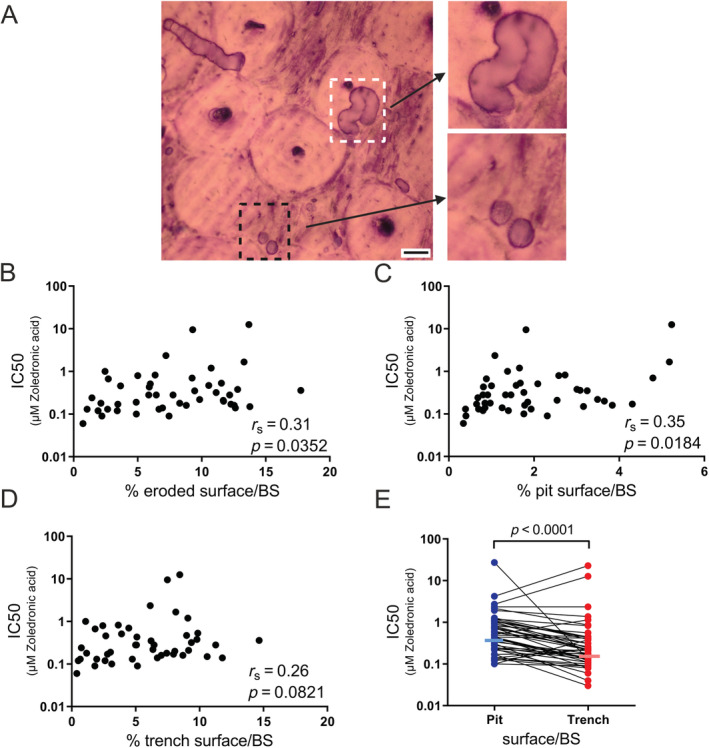
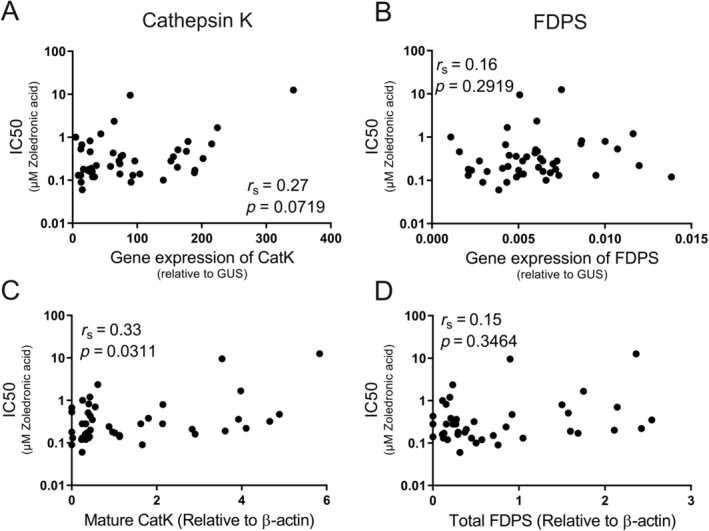
Zoledronic acid is a bisphosphonate commonly used to treat bone diseases such as osteoporosis and cancer-induced bone disease. Patients exhibit a variable sensitivity to zoledronic acid; the underlying explanation for this remains unclear. The objective of this study was to obtain more knowledge in this regard. We hypothesized that osteoclasts generated from different individuals would show a variable sensitivity to zoledronic acid in vitro. Osteoclasts were generated using monocytes from 46 healthy female blood donors (40 to 66 years). Matured osteoclasts were reseeded onto bone slices precoated with different concentrations of zoledronic acid. IC50 values were determined based on total eroded bone surface after 3 days of resorption. The IC50 for inhibition of osteoclastic bone resorption varied from 0.06 to 12.57μM zoledronic acid; thus, a more than 200-fold difference in sensitivity to zoledronic acid among osteoclasts from different individuals was observed. Multiple linear regression analyses showed that the determined IC50 correlated with smoking status, and the average number of nuclei per osteoclast in vitro. Further analyses showed that: (i) increasing protein levels of mature cathepsin K in osteoclast cultures rendered the osteoclasts less sensitive to zoledronic acid; (ii) surprisingly, neither the gene nor the protein expression of farnesyl diphosphate synthase was found to correlate with the IC50; and (iii) trench-forming osteoclasts were found to be more sensitive to zoledronic acid than pit-forming osteoclasts within the same cell culture. Thus, we conclude that there indeed is a high degree of variation in the potency of zoledronic acid on osteoclasts when generated from different individuals. We propose that our findings can explain some of the varying clinical efficacy of zoledronic acid therapy observed in patients, and may therefore be of clinical importance, which should be investigated in a clinical trial combining in vitro and in vivo investigations. © 2020 The Authors. JBMR Plus published by Wiley Periodicals LLC on behalf of American Society for Bone and Mineral Research.
Keywords: ANTIRESORPTIVES; OSTEOCLASTS; OSTEOPOROSIS; TUMOR‐INDUCED BONE DISEASE.
© 2020 The Authors. JBMR Plus published by Wiley Periodicals LLC on behalf of American Society for Bone and Mineral Research.
Figures
Similar articles
-
A variability in response of osteoclasts to zoledronic acid is mediated by smoking-associated modification in the DNA methylome.Clin Epigenetics. 2023 Mar 13;15(1):42. doi: 10.1186/s13148-023-01449-1. Clin Epigenetics. 2023. PMID: 36915112 Free PMC article.
-
Structure-activity relationships for inhibition of farnesyl diphosphate synthase in vitro and inhibition of bone resorption in vivo by nitrogen-containing bisphosphonates.J Pharmacol Exp Ther. 2001 Feb;296(2):235-42. J Pharmacol Exp Ther. 2001. PMID: 11160603
-
Mevalonates restore zoledronic acid-induced osteoclastogenesis inhibition.J Dent Res. 2015 Apr;94(4):594-601. doi: 10.1177/0022034514564187. Epub 2014 Dec 22. J Dent Res. 2015. PMID: 25535203
-
How zoledronic acid improves osteoporosis by acting on osteoclasts.Front Pharmacol. 2022 Aug 25;13:961941. doi: 10.3389/fphar.2022.961941. eCollection 2022. Front Pharmacol. 2022. PMID: 36091799 Free PMC article. Review.
-
Preclinical studies with zoledronic acid and other bisphosphonates: impact on the bone microenvironment.Semin Oncol. 2001 Apr;28(2 Suppl 6):35-44. doi: 10.1016/s0093-7754(01)90263-5. Semin Oncol. 2001. PMID: 11346863 Review.
Cited by
-
Alendronate Use and Risk of Type 2 Diabetes: A Nationwide Danish Nested Case-Control Study.Front Endocrinol (Lausanne). 2021 Nov 19;12:771426. doi: 10.3389/fendo.2021.771426. eCollection 2021. Front Endocrinol (Lausanne). 2021. PMID: 34867816 Free PMC article.
-
A variability in response of osteoclasts to zoledronic acid is mediated by smoking-associated modification in the DNA methylome.Clin Epigenetics. 2023 Mar 13;15(1):42. doi: 10.1186/s13148-023-01449-1. Clin Epigenetics. 2023. PMID: 36915112 Free PMC article.
-
Stage-specific modulation of multinucleation, fusion, and resorption by the long non-coding RNA DLEU1 and miR-16 in human primary osteoclasts.Cell Death Dis. 2024 Oct 11;15(10):741. doi: 10.1038/s41419-024-06983-1. Cell Death Dis. 2024. PMID: 39389940 Free PMC article.
-
Acute Effects of Kisspeptin Administration on Bone Metabolism in Healthy Men.J Clin Endocrinol Metab. 2022 May 17;107(6):1529-1540. doi: 10.1210/clinem/dgac117. J Clin Endocrinol Metab. 2022. PMID: 35244717 Free PMC article. Clinical Trial.
-
Zoledronic Acid for Periprosthetic Bone Mineral Density Changes in Patients With Osteoporosis After Hip Arthroplasty-An Updated Meta-Analysis of Six Randomized Controlled Trials.Front Med (Lausanne). 2021 Dec 23;8:801282. doi: 10.3389/fmed.2021.801282. eCollection 2021. Front Med (Lausanne). 2021. PMID: 35004777 Free PMC article.
References
-
- Coleman R, Body JJ, Aapro M, Hadji P, Herrstedt J. Bone health in cancer patients: ESMO clinical practice guidelines. Ann Oncol. 2014;25:124–37. - PubMed
-
- Ibrahim A, Scher N, Williams G, et al. Approval summary for zoledronic acid for treatment of multiple myeloma and cancer bone metastases. Clin Cancer Res. 2003;9(7):2394–9. - PubMed
-
- Dhillon S. Zoledronic acid (Reclast®, Aclasta®): a review in osteoporosis. Drugs. 2016;76(17):1683–97. - PubMed
-
- Lipton A, Fizazi K, Stopeck AT, et al. Superiority of denosumab to zoledronic acid for prevention of skeletal‐related events: a combined analysis of 3 pivotal, randomised, phase 3 trials. Eur J Cancer. 2012;48(16):3082–92. - PubMed
LinkOut - more resources
Full Text Sources