. 2020 Nov 19:9:e61073.
doi: 10.7554/eLife.61073.

Plasma proteomic biomarker signature of age predicts health and life span

Affiliations

Plasma proteomic biomarker signature of age predicts health and life span

Toshiko Tanaka et al. Elife. .

Abstract

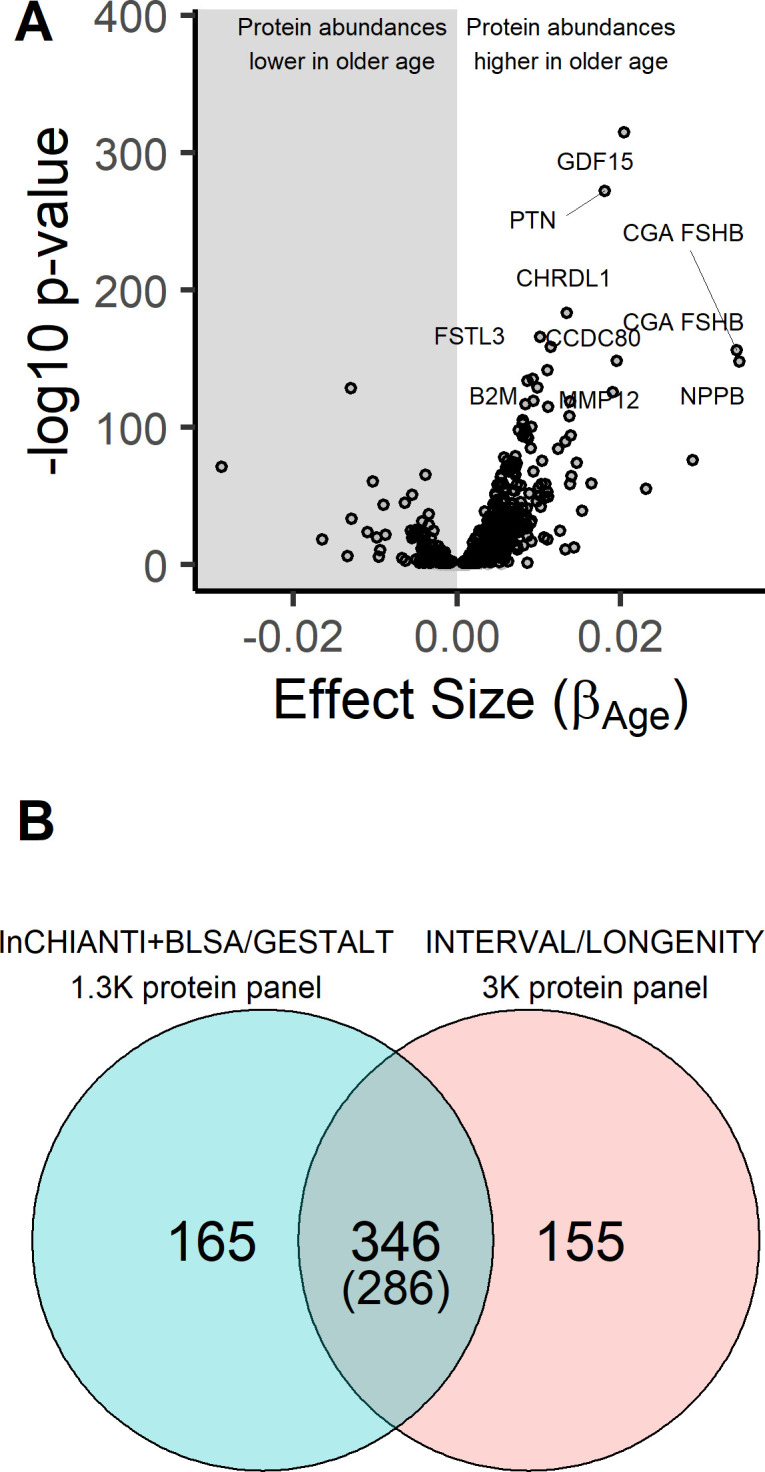
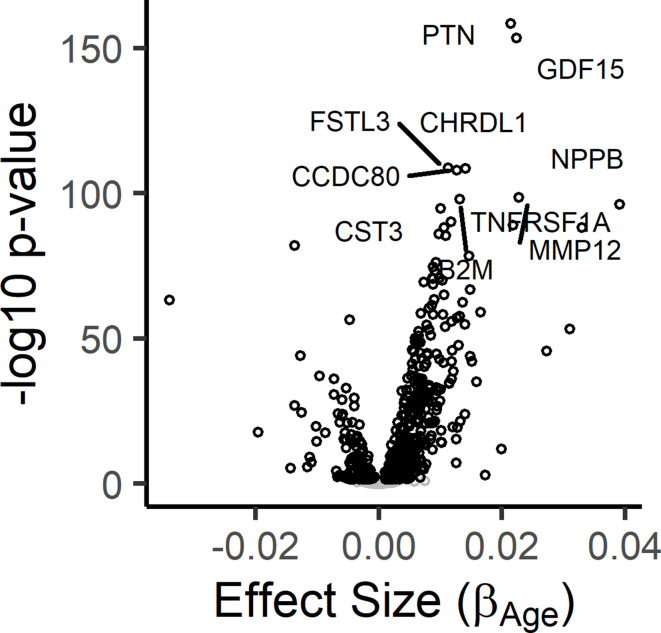
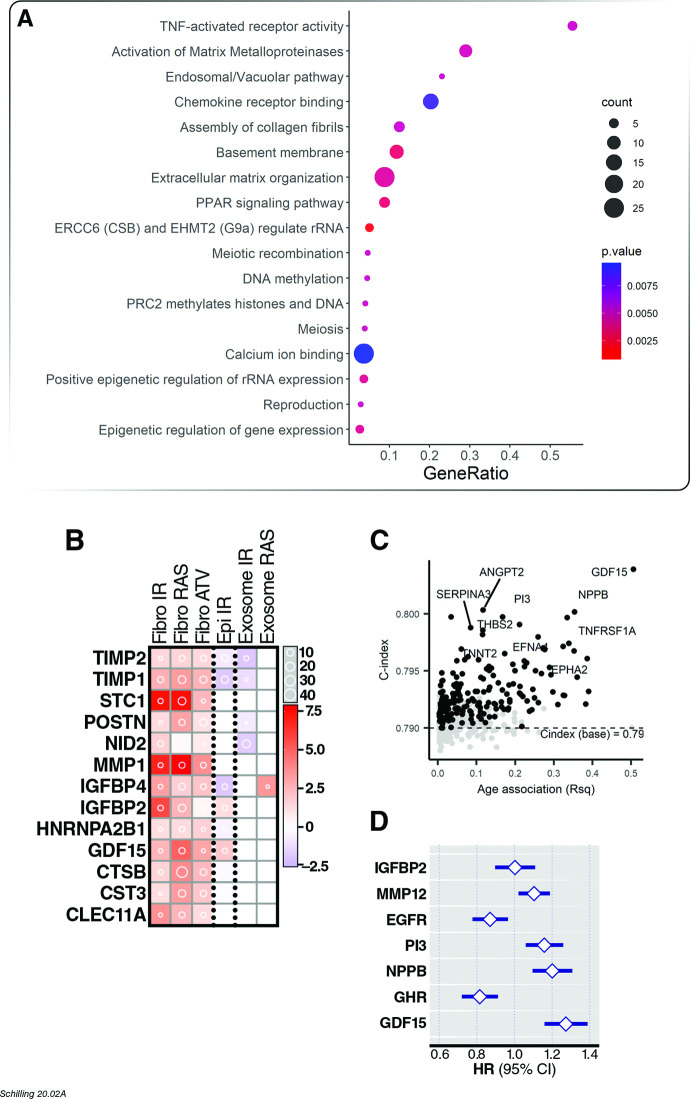
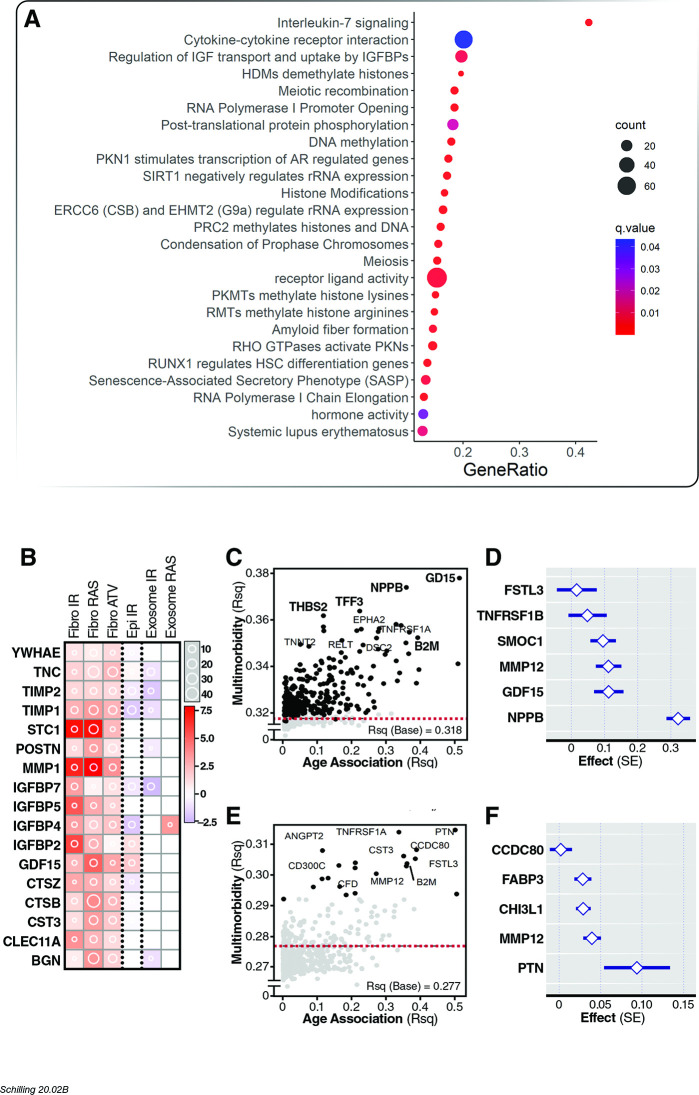
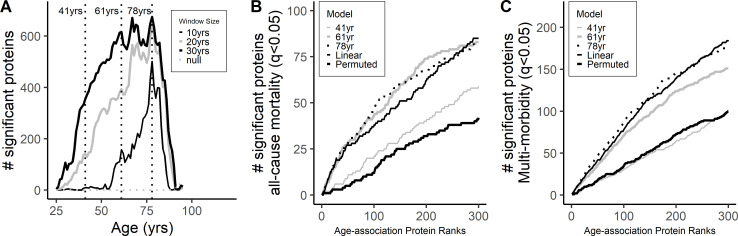
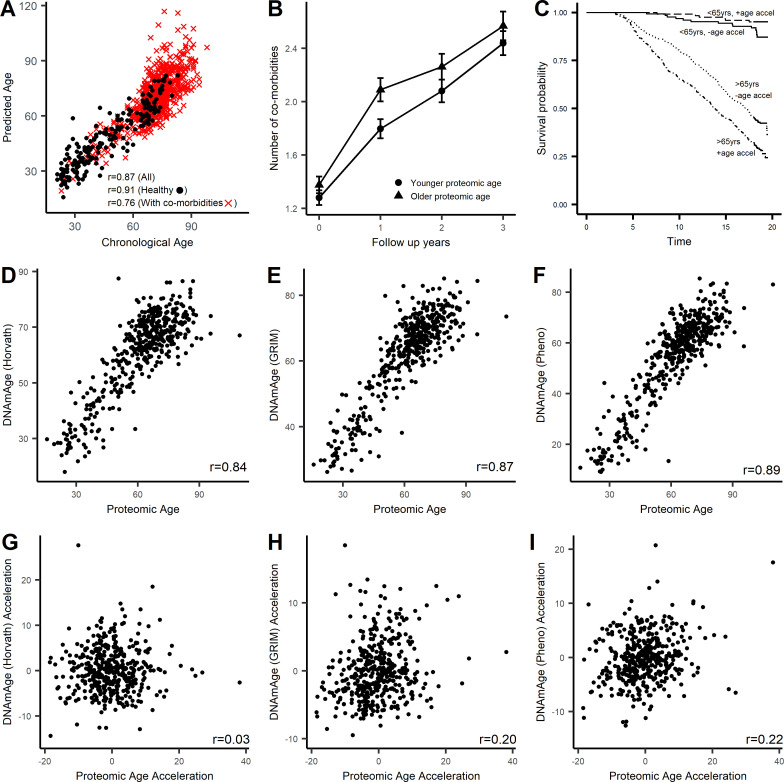
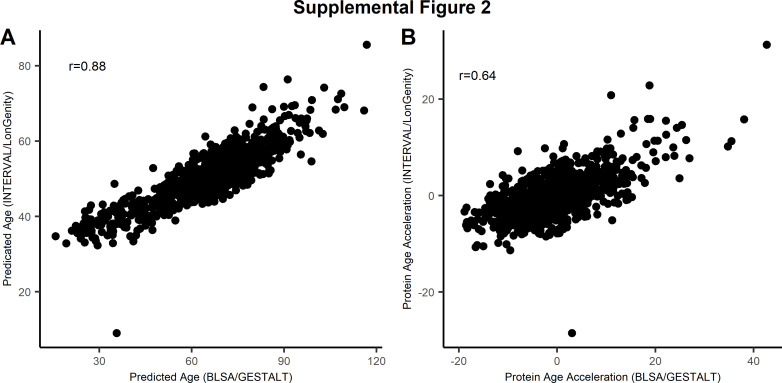
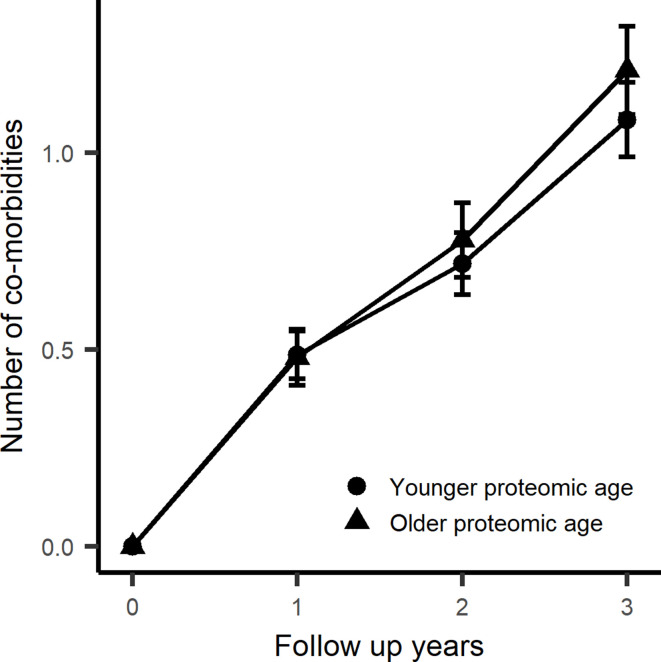
Older age is a strong shared risk factor for many chronic diseases, and there is increasing interest in identifying aging biomarkers. Here, a proteomic analysis of 1301 plasma proteins was conducted in 997 individuals between 21 and 102 years of age. We identified 651 proteins associated with age (506 over-represented, 145 underrepresented with age). Mediation analysis suggested a role for partial cis-epigenetic control of protein expression with age. Of the age-associated proteins, 33.5% and 45.3%, were associated with mortality and multimorbidity, respectively. There was enrichment of proteins associated with inflammation and extracellular matrix as well as senescence-associated secretory proteins. A 76-protein proteomic age signature predicted accumulation of chronic diseases and all-cause mortality. These data support the use of proteomic biomarkers to monitor aging trajectories and to identify individuals at higher risk of disease to be targeted for in depth diagnostic procedures and early interventions.

Keywords: aging; biomarker; computational biology; epidemiology; global health; healthspan; human; proteomics; systems biology.


Conflict of interest statement

TT, NB, GF, JC, AM, AB, BS, SB, LF No competing interests declared

Figures

Figure 1.
Figure 1.. Age-associated proteins in the InCHIANTI study.
(A) The volcano plot displays the results from the association of 1301 proteins with chronological age in the InCHIANTI study (N = 997; Figure 1—source data 1). The figure displays the effect size, or the beta coefficient for age (βage) from the linear model, against significance presented as the -log10(P-value). Of the 1301 proteins, 651 proteins associated were associated with age. (B) Comparison of the age-associated proteins discovered using the 1.3K SOMAscan platform in the INCHIANTI/BLSA/GESTALT studies (Figure 1—source data 2) with the analysis using the 3K SOMAscan platform in the INTERVAL/LONGEVITY study (Lehallier et al., 2019). There were 346 proteins that were significant in both studies, and 286 of these proteins the direction of association with age were concordant.
Figure 1—figure supplement 1.
Figure 1—figure supplement 1.. Results from the meta-analysis of age-associated proteins in the InCHIANTI and BLSA/GESTALT studies.
The results from the InCHIANTI study and BLSA/GESTALT (Tanaka et al., 2018) study was completed using the inverse-variance meta-analysis. Volcano plot displays the meta-analysis results for the 1301 proteins. The figure displays the effect size, or the beta coefficient for age (βage) from the linear model, against significance presented as the -log10(P-value).
Figure 2.
Figure 2.. Sex-associated proteins and sex differences in age association of plasma proteins in the InCHIANTI study.
(A) Volcano plot displaying the results from the association of 1301 proteins with sex in the InCHIANTI study (Figure 2—source data 1). There were 427 proteins (black circles) with differential expression by sex. The figure displays the effect size, or the beta coefficient for sex (βage) where a positive value are proteins with overrepresentation in women, and a negative value are proteins overrepresented in men. The y-axis show the significance presented as the -log10 (P-value). (B) Volcano plot displaying the analysis to explore the differences in age association by sex (Figure 2—source data 1). The values represent the beta estimates for the interaction term between sex and age from the linear model. There were 50 proteins (black circles) with differential age association by sex. A positive effect size are proteins where the age association is more positive in women, conversely a negative effect size reflect proteins where the age association is more positive in men. (C) Scatterplot displaying the relationship between protein sex hormone binding globulin (SHBG) and age stratified by sex. In men, SHBG values were higher in older ages (+) whereas no age association was observed in women (Δ).
Figure 3.
Figure 3.. Association of plasma ENPP7 with age and mediation by cg15739835.
Mediation analysis in 460 subjects with DNA methylation and proteomic data was conducted with Baron and Kenny method (Supplementary file 1A). The most significant mediation was observed for ectonucleotide pyrophosphatase/phosphodiesterase 7 (ENPP7). (A) Scatterplot displaying the association of plasma ENPP7 with age (solid line) and attenuation of the association after adjustment for methylation at cg15739835. (B) Scatterplot displaying the negative association between methylation at cg15739835 with age.
Figure 4.
Figure 4.. Association of age proteins with all-cause mortality.
Of the 651 age-associated proteins, 218 was associated with all-cause mortality (Figure 4—source data 1). (A) Pathway enrichment analysis of age-associated proteins predictive of all-cause mortality. (B) There were 13 core senescence-associated secretory proteins (SASP) among the proteins that predict mortality. (C) Scatterplot displaying the performance (c-index) of plasma proteins that predict all-cause mortality (y-axis) against the proportion of variance in age that is explained by the biomarker (Rsq) on the x-axis. (D) Forest plot to display the effect of 8 plasma proteins that significantly predicted all-cause mortality in a multi-protein model.
Figure 5.
Figure 5.. Association of age proteins with multimorbidity.
Of the 651 age-associated proteins, 295 was associated with all-cause mortality (Figure 5—source data 1). (A) Pathway enrichment analysis of age-associated proteins predictive of multimorbidity. (B) There were 13 core senescence-associated secretory proteins (SASP) among the proteins that predict mortality. Scatterplot displaying the proportion of variance (Rsq) of age explained by protein (x-axis) with relationship (Rsq) with protein with baseline multimorbidity (y-axis) (C) and trajectory of multimorbidity over 10 years in subjects free of disease at baseline (y-axis) (E). Forest plot to display the effect of six and five plasma proteins that predict baseline (D) and trajectory of multimorbidity (F).
Figure 6.
Figure 6.. Differential protein expression across age-span.
(A) Differential expression of protein across different ages was explored suing a sliding-window analysis using an age window of 10, 20, and 30 years (Supplementary file 1B). Peak association was observed at age 78 while no clear peaks were observed at younger ages. Cumulative number of proteins associated with all-cause mortality (A) and multimorbidity (B) was compared in the ranked age-associated proteins at the different age waves (41, 61 and 78 years) and from the linear models.
Figure 7.
Figure 7.. Two-sample Mendelian Randomization.
A two-sample Mendelian randomization (MR) was conducted for 18 age-related disease and endophenotypes using genetic instrument identified in the INTERVAL study for seven age-associated proteins (Sun et al., 2018) and (Supplementary file 1C). Forest plot displaying the results from the two-way MR for age-related disease (A) and endophenotypes (B).
Figure 8.
Figure 8.. Characterization of proteomic signature of age.
A proteomic age predictor was created using 76 proteins and a measure of protein biological age was calculated as the residuals (PROaccel) from the regression model of chronological age with predicted age (PROage; Supplementary file 1D). (A) Scatter plot of PROage with chronological age. The correlation was higher in subjects free of disease (circle) compared to subject with co-morbidities (cross). Subjects that were greater PROaccel display greater increase in multimorbidity (B) and in higher risk for all-cause mortality in subjects older than 65 years of age (C). The proteomic age was compared with existing epigenetic age clocks. The proteomic signature of age was consistent with other aging clocks including methylation age (Horvath, 2013) (D), GRIMage (Lu et al., 2019) (E), and phenotypic age (Levine et al., 2015) (F). Age acceleration or measure of biological age based on proteomic signature was not correlated with biological aging measured by methylation clock (G), but was correlated with biological age based on GRIMage (H) and phenotypic age (I).
Figure 8—figure supplement 1.
Figure 8—figure supplement 1.. Comparison of proteomic signature of age.
The 76-protein age predictor was compared with the parsimonious 9-protein model developed by Lehallier (Lehallier et al., 2019). The scatter plot displays the correlation between the two proteomic signature of age (A) and the measure of age acceleration (deviation of predicted age and observed age) based on 76 proteins (x-axis) with the 9-protein model (y-axis) (B).
Figure 8—figure supplement 2.
Figure 8—figure supplement 2.. Aging rates with trajectory of chronic disease accumulation in healthy disease-free subjects.
The association of age-associated proteins with trajectory of multimorbidity was examined in 310 subjects that were free of chronic diseases at baseline. Being biologically older (proteomic signature of age is greater than chronological age) displays greater increase in multimorbidity during a 10 year follow period.

References

    1. ActiFE study group. Rothenbacher D, Dallmeier D, Christow H, Koenig W, Denkinger M, Klenk J. Association of growth differentiation factor 15 with other key biomarkers, functional parameters and mortality in community-dwelling older adults. Age and Ageing. 2019;48:541–546. doi: 10.1093/ageing/afz022. - DOI - PubMed
    1. Alam SR, Newby DE, Henriksen PA. Role of the endogenous elastase inhibitor, Elafin, in cardiovascular injury: from epithelium to endothelium. Biochemical Pharmacology. 2012;83:695–704. doi: 10.1016/j.bcp.2011.11.003. - DOI - PubMed
    1. Baek SJ, Eling T. Growth differentiation factor 15 (GDF15): A survival protein with therapeutic potential in metabolic diseases. Pharmacology & Therapeutics. 2019;198:46–58. doi: 10.1016/j.pharmthera.2019.02.008. - DOI - PMC - PubMed
    1. Baird AL, Westwood S, Lovestone S. Blood-Based proteomic biomarkers of Alzheimer's Disease Pathology. Frontiers in Neurology. 2015;6:236. doi: 10.3389/fneur.2015.00236. - DOI - PMC - PubMed
    1. Baron RM, Kenny DA. The moderator-mediator variable distinction in social psychological research: conceptual, strategic, and statistical considerations. Journal of Personality and Social Psychology. 1986;51:1173–1182. doi: 10.1037/0022-3514.51.6.1173. - DOI - PubMed

Publication types