

Distinct expression of SARS-CoV-2 receptor ACE2 correlates with endotypes of chronic rhinosinusitis with nasal polyps
- PMID: 33210729
- PMCID: PMC7753806
- DOI: 10.1111/all.14665
Distinct expression of SARS-CoV-2 receptor ACE2 correlates with endotypes of chronic rhinosinusitis with nasal polyps
Abstract
Background: Severe acute respiratory syndrome coronavirus 2 (SARS-CoV-2) entry factors, ACE2 and TMPRSS2, are highly expressed in nasal epithelial cells. However, the association between SARS-CoV-2 and nasal inflammation in chronic rhinosinusitis with nasal polyps (CRSwNP) has not been investigated. We thus investigated the expression of SARS-CoV-2 entry factors in nasal tissues of CRSwNP patients, and their associations with inflammatory endotypes of CRSwNP.
Methods: The expression of ACE2 and TMPRSS2 was assessed in nasal tissues of control subjects and eosinophilic CRSwNP (ECRSwNP) and nonECRSwNP patients. The correlations between ACE2/TMPRSS2 expression and inflammatory indices of CRSwNP endotypes were evaluated. Regulation of ACE2/TMPRSS2 expression by inflammatory cytokines and glucocorticoids was investigated.
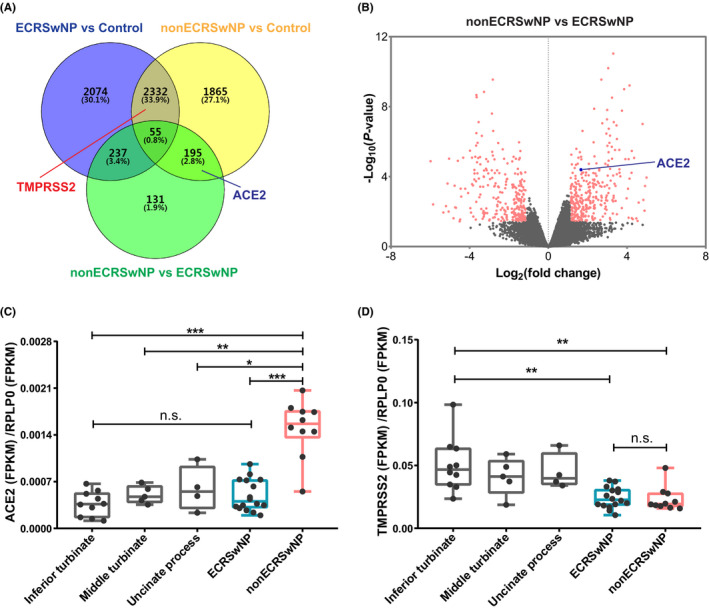
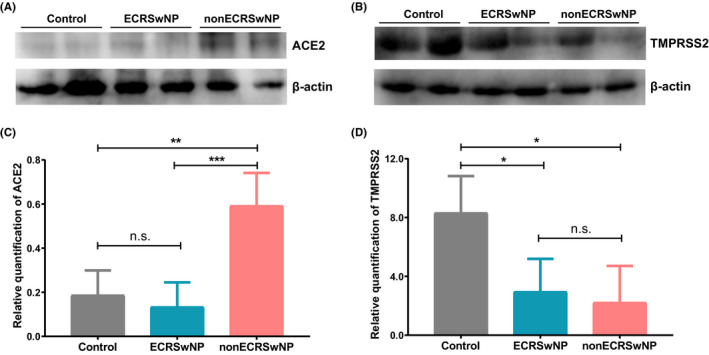
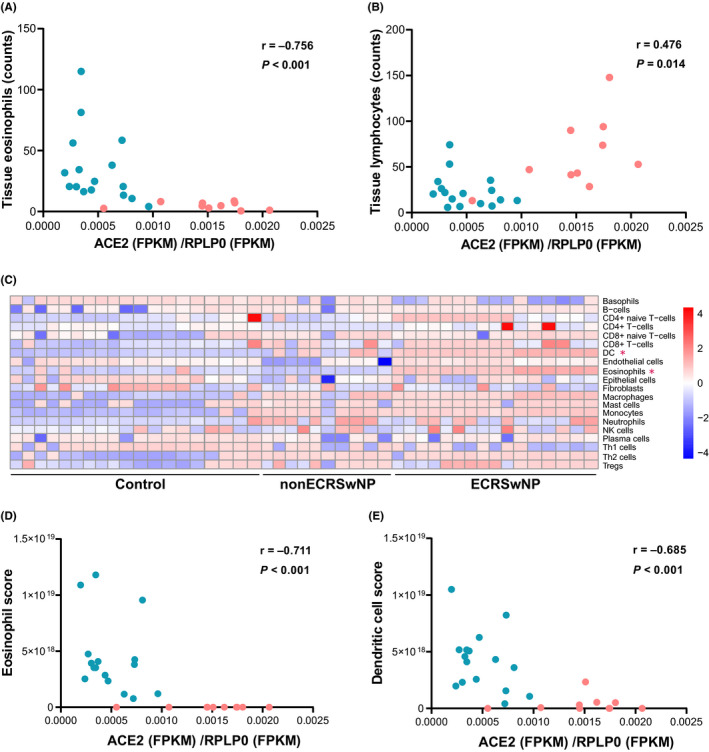
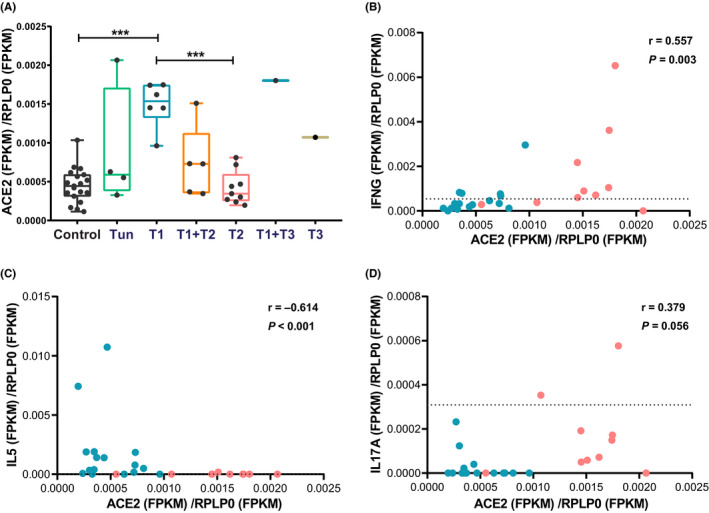
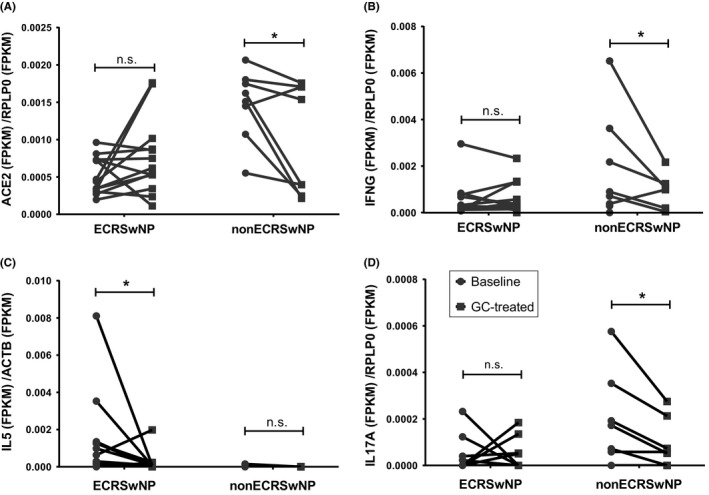
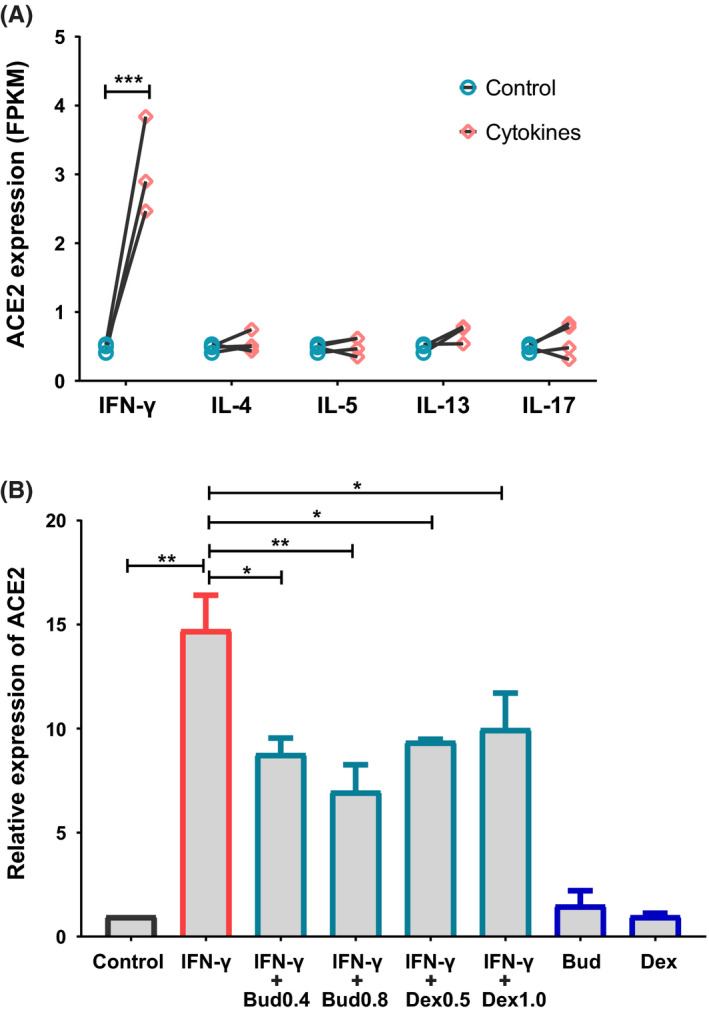
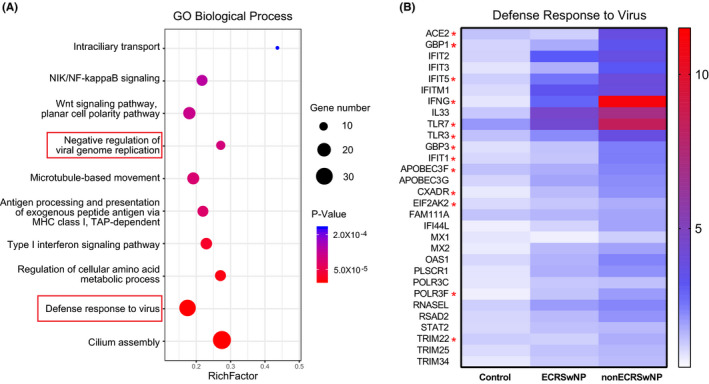
Results: ACE2 expression was significantly increased in nasal tissues of nonECRSwNP patients compared to ECRSwNP patients and control subjects, and positively correlated with the expression of IFN-γ, but negatively correlated with tissue infiltrated eosinophils, and expression of IL5 and IL13. IFN-γ up-regulated ACE2 expression while glucocorticoid attenuated this increase in cultured nasal epithelial cells. Genes co-expressed with ACE2 were enriched in pathways relating to defence response to virus in nasal tissue. TMPRSS2 expression was decreased in nasal tissues of CRSwNP patients compared to control subjects and not correlated with the inflammatory endotypes of CRSwNP. Glucocorticoid treatment decreased ACE2 expression in nasal tissues of nonECRSwNP patients, but not in ECRSwNP patients, whereas TMPRSS2 expression was not affected.
Conclusion: These findings indicate that ACE2 expression, regulated by IFN-γ, is increased in nasal tissues of nonECRSwNP patients and positively correlates with type 1 inflammation.
Keywords: ACE2; SARS-CoV-2; TMPRSS2; chronic rhinosinusitis with nasal polyps; inflammatory endotype.
© 2020 EAACI and John Wiley and Sons A/S. Published by John Wiley and Sons Ltd.
Conflict of interest statement
The authors declare that they have no conflicts of interest.
Figures
Similar articles
-
Inflammatory endotypes of CRSwNP and responses to COVID-19.Curr Opin Allergy Clin Immunol. 2021 Feb 1;21(1):8-15. doi: 10.1097/ACI.0000000000000700. Curr Opin Allergy Clin Immunol. 2021. PMID: 33164997 Review.
-
Co-Expression and Localization of Angiotensin-Converting Enzyme-2 (ACE2) and the Transmembrane Serine Protease 2 (TMPRSS2) in Paranasal Ciliated Epithelium of Patients with Chronic Rhinosinusitis.Am J Rhinol Allergy. 2022 May;36(3):313-322. doi: 10.1177/19458924211059639. Epub 2022 Jan 6. Am J Rhinol Allergy. 2022. PMID: 34989246
-
Viral stimulation modulates endotype-related ACE2 expression in eosinophilic chronic rhinosinusitis.Rhinology. 2021 Oct 1;59(5):460-469. doi: 10.4193/Rhin21.001. Rhinology. 2021. PMID: 34282808
-
Epithelium-derived cystatin SN enhances eosinophil activation and infiltration through IL-5 in patients with chronic rhinosinusitis with nasal polyps.J Allergy Clin Immunol. 2019 Aug;144(2):455-469. doi: 10.1016/j.jaci.2019.03.026. Epub 2019 Apr 8. J Allergy Clin Immunol. 2019. PMID: 30974106 Clinical Trial.
-
The epithelium-derived inflammatory mediators of chronic rhinosinusitis with nasal polyps.Expert Rev Clin Immunol. 2020 Mar;16(3):293-310. doi: 10.1080/1744666X.2020.1723417. Epub 2020 Feb 8. Expert Rev Clin Immunol. 2020. PMID: 31986923 Review.
Cited by
-
Evaluation of Angiotensin-Converting Enzyme 2 Expression In Vivo with Novel 68Ga-Labeled Peptides Originated from the Coronavirus Receptor-Binding Domain.ACS Pharmacol Transl Sci. 2024 Sep 12;7(10):3119-3130. doi: 10.1021/acsptsci.4c00316. eCollection 2024 Oct 11. ACS Pharmacol Transl Sci. 2024. PMID: 39416971
-
Advances and highlights in biomarkers of allergic diseases.Allergy. 2021 Dec;76(12):3659-3686. doi: 10.1111/all.15089. Epub 2021 Sep 27. Allergy. 2021. PMID: 34519063 Free PMC article. Review.
-
Differential susceptibility to SARS-CoV-2 in the normal nasal mucosa and in chronic sinusitis.Eur J Immunol. 2022 Aug;52(8):1308-1320. doi: 10.1002/eji.202249805. Epub 2022 May 14. Eur J Immunol. 2022. PMID: 35524548 Free PMC article.
-
Symptom-based early-stage differentiation between SARS-CoV-2 versus other respiratory tract infections-Upper Silesia pilot study.Sci Rep. 2021 Jun 30;11(1):13580. doi: 10.1038/s41598-021-93046-6. Sci Rep. 2021. PMID: 34193945 Free PMC article.
-
The impact of chronic rhinosinusitis on COVID-19 risk and outcomes: A systematic review and meta-analysis.Front Immunol. 2023 Mar 29;14:1139031. doi: 10.3389/fimmu.2023.1139031. eCollection 2023. Front Immunol. 2023. PMID: 37063875 Free PMC article.
References
Publication types
MeSH terms
Substances
Grants and funding
- 81800882/National Natural Science Foundation of China
- 81630023/National Natural Science Foundation of China
- 81870698/National Natural Science Foundation of China
- SML20150203/Beijing municipal administration of hospitals' mission plan
- 2018YFC0116800/national key R&D program of China
- 2016YFC0905200/national key R&D program of China
- IRT13082/program for the Changjiang scholars and innovative research team
- DFL20190202/Beijing municipal administration of hospitals' Dengfeng plan
- XMLX201816/Beijing municipal administration of hospitals clinical medicine development of special funding support
LinkOut - more resources
Full Text Sources
Medical
Miscellaneous
