

A new linear cyclin docking motif that mediates exclusively S-phase CDK-specific signaling
- PMID: 33210757
- PMCID: PMC7809796
- DOI: 10.15252/embj.2020105839
A new linear cyclin docking motif that mediates exclusively S-phase CDK-specific signaling
Abstract
Cyclin-dependent kinases (CDKs), the master regulators of cell division, are activated by different cyclins at different cell cycle stages. In addition to being activators of CDKs, cyclins recognize various linear motifs to target CDK activity to specific proteins. We uncovered a cyclin docking motif, NLxxxL, that contributes to phosphorylation-dependent degradation of the CDK inhibitor Far1 at the G1/S stage in the yeast Saccharomyces cerevisiae. This motif is recognized exclusively by S-phase CDK (S-CDK) Clb5/6-Cdc28 and is considerably more potent than the conventional RxL docking motif. The NLxxxL and RxL motifs were found to overlap in some target proteins, suggesting that cyclin docking motifs can evolve to switch from one to another for fine-tuning of cell cycle events. Using time-lapse fluorescence microscopy, we show how different docking connections temporally control phosphorylation-driven target degradation. This also revealed a differential function of the phosphoadaptor protein Cks1, as Cks1 docking potentiated degron phosphorylation of RxL-containing but not of NLxxxL-containing substrates. The NLxxxL motif was found to govern S-cyclin-specificity in multiple yeast CDK targets including Fin1, Lif1, and Slx4, suggesting its wider importance.
Keywords: cell cycle; cyclin docking; cyclin-dependent kinase; phosphorylation; short linear motifs.
© 2020 The Authors. Published under the terms of the CC BY NC ND 4.0 license.
Conflict of interest statement
The authors declare that they have no conflict of interest.
Figures

- A
Scheme showing the major cyclin‐substrate interactions of Cdk1 complex.
- B
Scheme showing the CDK phosphorylation sites and the potential Clb5 docking region in the disordered N terminus of Far1 (residues 1–150).
- C
Co‐immunoprecipitation of Cdc4 using either unphosphorylated or Clb5‐Cdk1‐phosphorylated Far1(85–150) as bait. The experiment was repeated twice, a representative example is shown.
- D
Time‐lapse fluorescence images showing the expression and degradation of wild‐type and S87A S91A mutant Far1(1–150)‐GFP and nuclear‐cytoplasmic shuttling of Whi5‐mCherry. Nuclear export of Whi5‐mCherry takes place at 0 min (Start point) and was used to synchronize the cells for quantitative analysis.
- E, F
Mean ± SEM fluorescence intensities of the indicated Far1(1–150)‐GFP mutants over the cell cycle. The number of cells analyzed for each construct is noted in Table EV2.
- G
Time from Start to degradation of 50% of the indicated Far1‐GFP sensor in single cells. The bars show median ± 95% confidence intervals. The numbers above the plot show median values. ****P‐value < 0.0001, ***<0.001 and ns > 0.05 for pairwise comparisons with wild type using Mann–Whitney U‐test. The number of cells analyzed for each construct is noted in Table EV2.
- H
In vitro kinase assay showing the effect of N130A, L131A, L135A, and L136A mutations on Far1(1–150)‐GFP phosphorylation by Clb5‐Cdk1. WT/mut shows the decrease in phosphorylation rate of the mutant compared to wild type. The experiment was repeated twice, a representative example is shown.

Alignment of S. cerevisiae Far1(80–100) with homologs from other yeast species. Far1 segment 85–91 matches the consensus for Cdc4 di‐phosphodegron.
Sequence of Far1 positions 85–140 showing the linker sequence between the S87/S91 degron and the NLxxxL motif. To study the linker region, positions 103–109 and 112–119 were replaced with glycine‐serine linkers in two constructs that were analyzed in time‐lapse microscopy in panel “C”.
Mean ± SEM fluorescence intensities of the indicated Far1(1–150)‐GFP constructs after Start. For sample size, please see Table EV2.
Plot showing the 50% degradation timing of indicated Far1(1–150)‐GFP mutants in individual cells. The bars show median ± 95% CI. The numbers above the plot show median values for each construct. ns denotes P‐value > 0.05 for pairwise comparisons with wild type using Mann–Whitney U‐test. The number of cells analyzed is shown in Table EV2.

Autoradiograph of a cyclin specificity analysis of the indicated substrates with wild‐type or docking site mutant cyclin‐Cdk1 complexes. Far1(1–150 mut) is L131A L135A L136A mutant, Sic1ΔC is the non‐inhibitory mutant of Sic1 (deletion of 216–284). The experiment was repeated twice, a representative example is shown.
Mean ± SEM fluorescence intensities of wild‐type and NLxxxL motif mutant Far1(1–150)‐GFP in either wild‐type or clb5(hpm) clb6(hpm) strain over the cell cycle. The number of cells analyzed is noted in Table EV2.

Schemes of Far1(1–150)‐GFP constructs, either wild‐type or mutant where NLxxxL motif is replaced with RxL motif (VKRTLF), that are used in time‐lapse microscopy experiments in panel (C).
Sequence alignment showing the introduction of wild‐type or mutated RxL motif to Far1.
Plot showing the mean ± SEM fluorescence intensities of Far1(1–150)‐GFP constructs with the indicated docking site. In rxl mutant, the NLxxxL motif is replaced with a mutated non‐functional RxL motif (VKATAF). The number of cells analyzed is noted in Table EV2.
Kinetic characterization of Far1(1–150 WT)‐GFP and Far1(1–150 RxL)‐GFP phosphorylation by Clb5‐Cdk1. The data are from two experimental replicates.
Mean ± SEM fluorescence intensities of wild‐type or RxL‐dependent Far1(1–150)‐GFP in wild‐type or the indicated cyclin hpm mutant strains. The number of cells analyzed is noted in Table EV2.
Pheromone sensitivity halo assay with PGAL1‐3HA‐CLB5 sic1Δ strains carrying either wild‐type FAR1, far1Δ, far1(L135A), or far1(RxL). Different concentrations of α‐factor were pipetted on the paper disks. On glucose plates, α‐factor triggers cell cycle arrest. CLB5 overexpression from PGAL1 in sic1Δ strain causes lethality presumably by inhibition of replication licensing, which is rescued by the presence of α‐factor, which leads to Far1‐dependent inhibition of excess Clb5‐Cdk1 activity. The experiment was repeated twice, a representative example is shown.
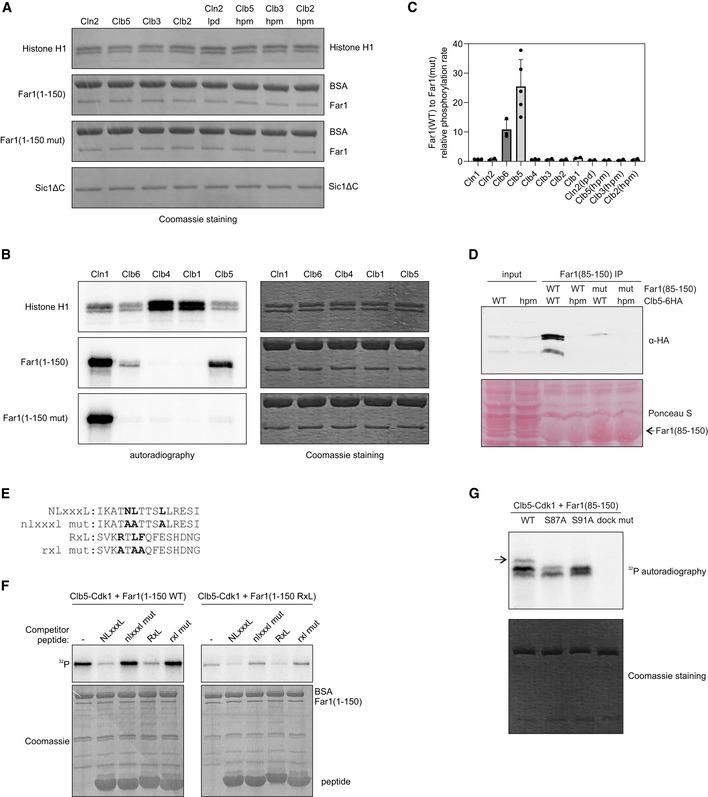
Coomassie‐stained SDS–PAGE gels from kinase assays presented in Fig 2A.
Phosphorylation of histone H1, Far1(1–150), and Far1(1–150 mut) by Cln1‐, Clb6‐, Clb4‐, Clb1‐, and Clb5‐Cdk1 in vitro. In Far1(1–150 mut), the NLxxxL motif is mutated.
The relative phosphorylation rate of wild‐type Far1(1–150) compared to NLxxxL motif mutant Far1(1–150) by the indicated cyclin‐Cdk1 complex. The data are mean from at least two experiments, and the error bars show standard deviation. Individual experiment data points are also shown.
Co‐immunoprecipitation of either wild‐type or hpm Clb5 using either wild‐type or NLxxxL motif mutant Far1(85–150) as bait. The experiment was repeated twice, a representative example is shown.
Alignment of the competitor peptides used in Fig EV2F. The peptides were fused via ELGGGGG linker to GB1 domain.
In vitro phosphorylation experiment showing the phosphorylation of Far1(1–150) with either NLxxxL (WT) or RxL motif (RxL) by Clb5‐Cdk1 in the presence of 210 µM competitor peptides with the indicated motifs. The experiment was repeated twice, a representative example is shown. Sequences of the competitor peptides are shown in Fig EV2E.
The indicated Far1(85–150) variant was phosphorylated with Clb5‐Cdk1, and the multisite phosphorylation was studied using Phos‐tag SDS–PAGE autoradiography. The arrow points to the product with phosphorylation at both S87 and S91.

Schemes of the Far1(1–150)‐GFP constructs used in (B). The constructs contain either wild‐type phosphorylation sites or have all TP sites mutated to SP sites (SP mutant). The predicted Cks1 docking connections are shown with the arrows below the scheme.
The degradation of Far1(1–150)‐GFP with either wild‐type or all serine‐based phosphorylation sites and the indicated docking motifs was measured in time‐lapse microscopy. Plot shows mean ± SEM of GFP fluorescence intensities from Start. The number of cells is shown in Table EV2.
Phos‐tag SDS–PAGE autoradiographs showing the Cks1 dependency of Clb5‐Cdk1‐mediated multisite phosphorylation of Far1(1–150) with either NLxxxL (WT) motif or RxL motif. The experiment was performed twice, a representative example is shown.
Plot showing the kinetics of Clb5‐Cdk1‐mediated phosphorylation of Far1(85–150) with either wild‐type (NLxxxL) or RxL docking motif. The data are from two replicates.
Scheme of Far1(85–150)‐GFP with either NLxxxL, RxL, or mutated cyclin docking motif and with or without T3 primer site introduced upstream of the S87 S91 degron.
Mean ± SEM GFP fluorescence intensities of the indicated Far1(1–85) constructs, synchronized at the time of Start. The number of cells is noted in Table EV2.
Plot showing the timing of 50% degradation of the indicated Far1(85‐150) constructs in single cells. The numbers above the plot show median values. The bars show median ± 95% CI. **** and ns indicate P‐values < 0.0001 and > 0.05 by Mann–Whitney test for pairwise comparisons with WT. The number of cells is noted in Table EV2.

Schemes of the CDK threshold sensors based on Sic1 used in panels (C, D). The sensors contain the non‐inhibitory domain of Sic1 (1–215), have mutated RxL and LP docking sites and insertion of 4 residues between T33 and T45. The docking sites are inserted to the position of Sic1 RxL motif.
Alignment of the Sic1 segment with the different introduced docking motifs.
Plot showing the mean ± SEM fluorescence intensities of the Sic1‐based threshold sensors shown in (A) containing the indicated cyclin docking motif. The sample size for each strain is noted in Table EV2.
The time from Start to the fluorescence levels of the threshold sensors with indicated docking motifs decreasing to 50% of peak level was measured in single cells. The black lines show median ± 95% CI. The numbers above the plot show median degradation timings of the indicated sensors. The number of cells is noted in Table EV2.
In vitro phosphorylation kinetics of Sic1(T33 + 16T45 rxl llpp ΔC) with the indicated cyclin docking motif by Clb5‐Cdk1. The data are from two replicate experiments.
Analysis of multisite phosphorylation of Sic1(T33 + 16T45 rxl llpp ΔC) with different docking motifs using Phos‐tag SDS–PAGE autoradiography. The experiment was performed twice, a representative example is shown.
The fraction of maximally phosphorylated form from total phosphorylation signal was quantified from Phos‐tag gels as shown in panel (F).
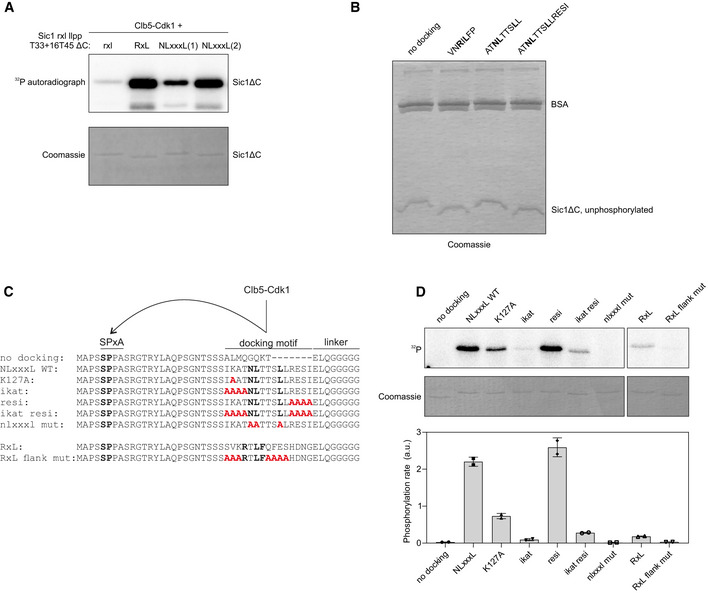
Autoradiograph and Coomassie‐stained gel of phosphorylation reactions of the indicated Sic1ΔC variant and Clb5‐Cdk1.
Coomassie‐stained Phos‐tag SDS–PAGE gel of the phosphorylation experiment in Fig 5F.
Sic1‐based minimal model substrates used to study the specificity determinants of NLxxxL and RxL motifs. Fifteen amino acid segments with the docking motifs were introduced 20 amino acids downstream of a minimal consensus site SP. The motifs are followed by a linker and fused to GB1 domain.
In vitro phosphorylation assay with Clb5‐Cdk1 using the Sic1‐based minimal model substrates described in panel “C”. The data are from two independent experiments. The error bars show standard deviation of the mean from two experiments.

An alignment of predicted NLxxxL motifs from Far1, Lif1, Slx4, Fin1, and Spc110. In case of Fin1 and Spc110, the motif overlaps with an RxL motif.
Autoradiograph showing the cyclin specificity and docking dependency of Lif1 and Slx4 phosphorylation. The experiments were repeated twice, representative examples are shown.
NLxxxL is necessary for efficient phosphorylation of Lif1 and Slx4 by Clb5‐Cdk1, as shown by the in vitro kinase assay. The experiments were repeated twice, representative examples are shown.
Autoradiograph of Clb5‐Cdk1‐mediated phosphorylation of indicated Fin1 mutants. The experiments were repeated twice, representative examples are shown.
Alignment showing the introduction of RxL motif determinants to Far1 NLxxxL motif in mutants analyzed in time‐lapse microscopy in panels (G, H).
Scheme of Far1(1–150 SP)‐GFP sensors used for time‐lapse microscopy‐based analysis of different docking motif variants. All TP sites have been mutated to SP sites.
The effect of different docking motifs on the degradation of Far1(1–150 SP)‐GFP, where all TP sites are mutated to SP. Plot shows mean ± SEM of fluorescence intensities in the cell cycle. For the sample sizes, please see Table EV2.
The time from Start to the degradation of 50% of Far1(1–150 SP)‐GFP with the indicated docking motif was measured in single cells. The numbers above the plot show median values for the sensors, and the black lines show median ± 95% CI. **** and ns denote P‐value < 0.0001 and > 0.05, respectively, for pairwise comparisons with SP WT using Mann–Whitney U‐test. For the sample sizes, please see Table EV2.

- A
Coomassie‐stained gels for phosphorylation assay presented in Fig 6B.
- B–D
Alignment of Fin1 (B), Far1 (C), and Lif1 (D) homologs in yeasts showing the conservation and overlap of cyclin docking motifs. The match to either RxL or NLxxxL motif consensus is presented on the right. The RxL consensus was defined as R/K‐x‐L‐Φ or R/K‐x‐L‐x‐Φ.
- E
Coomassie‐stained gels of phosphorylation assays presented in Fig 6D.
- F
Computational structural model of Clb5 with RxL peptide bound to the hydrophobic patch. The RxL interaction is based on alignment of Clb5 model with crystal structure of cyclin A in complex with Cdc6 RxL peptide (2CCI).
- G
Phosphorylation of Far1(1–150), Lif1, and Sic1ΔC by different Clb5‐Cdk1 mutants was measured under initial velocity conditions. The plots show the mean of phosphorylation rate by the indicated Clb5 mutant compared to wild‐type Clb5‐Cdk1. The data are from two independent experiments, and the error bars show standard deviation.

The nuclear fluorescence levels of Whi5‐mCherry after spindle elongation were measured in single cells using time‐lapse microscopy. The plot shows mean ± SEM levels from a group of cells synchronized at the time of anaphase onset detected by movement of Spc42‐EGFP. The data are from 95 cells.
Dephosphorylation of Fin1(WT) and Fin1(PKKLQF) by Glc7 (PP1) and Cdc14. Fin1 was phosphorylated with Clb2‐Cdk1 before addition of phosphatase and Sic1 to inhibit Clb2‐Cdk1.
Quantified data from the dephosphorylation experiment in panel “B”. Data are from at least two replicates, and error bars show standard deviation.

Time‐lapse microscopy was used to measure cyclin–citrine levels during mitotic exit in unperturbed cell cycles. The cells were synchronized by the nuclear import of 50% of Whi5‐mCherry at mitotic exit. The plot shows mean ± SEM fluorescence intensities averaged over a population of cells. The vertical line at −14 min marks the estimated time of anaphase entry. Sample sizes are shown in Table EV2.
Cyclin–citrine degradation relative to the nuclear import of 50% Whi5‐mCherry was followed in single cells. Plot shows the time from nuclear import of 50% Whi5‐mCherry to the degradation of 50% of the indicated cyclin in individual cells. The error bars show 95% CI of the mean. The number of cells is noted in Table EV2.
Simplified cell cycle model showing the expression profiles of 4 cyclins and the activation and inactivation of 3 CDK‐dependent switches A, B, C. On the left plot, the switches are controlled in the last‐in‐first‐out order, and on the right, the first‐in‐first‐out order.
Sequence alignment of predicted Clb5‐specific motifs in Fin1, Spc110, and Cnn1.
The effect of cyclin specificity on the phosphorylation of Fin1, Cnn1, and Spc110 was studied in a kinase assay. The plots show the phosphorylation by Clb5‐, Clb3‐, and Clb2‐Cdk1, the error bars show standard deviation (n = 2).
Images from a time‐lapse microscopy experiment of an exemplar cell expressing Spc42‐mCherry for detection of SPBs and EGFP‐Fin1. Cells were imaged every 2 min, the white arrow indicates onset of anaphase.
The accumulation of EGFP‐Fin1 to SPBs in anaphase was measured in experiments described in (F). The plot shows mean EGFP fluorescence intensities at SPBs around the time of anaphase onset. The error bars are ± SEM. The number of cells analyzed is shown in Table EV2.
Similar articles
-
CDK signaling via nonconventional CDK phosphorylation sites.Mol Biol Cell. 2023 Nov 1;34(12):pe5. doi: 10.1091/mbc.E22-06-0196. Mol Biol Cell. 2023. PMID: 37906435 Free PMC article. Review.
-
Cyclin-specific docking motifs promote phosphorylation of yeast signaling proteins by G1/S Cdk complexes.Curr Biol. 2011 Oct 11;21(19):1615-23. doi: 10.1016/j.cub.2011.08.033. Epub 2011 Sep 22. Curr Biol. 2011. PMID: 21945277 Free PMC article.
-
Cyclin-Specific Docking Mechanisms Reveal the Complexity of M-CDK Function in the Cell Cycle.Mol Cell. 2019 Jul 11;75(1):76-89.e3. doi: 10.1016/j.molcel.2019.04.026. Epub 2019 May 14. Mol Cell. 2019. PMID: 31101497 Free PMC article.
-
Comprehensive Analysis of G1 Cyclin Docking Motif Sequences that Control CDK Regulatory Potency In Vivo.Curr Biol. 2020 Nov 16;30(22):4454-4466.e5. doi: 10.1016/j.cub.2020.08.099. Epub 2020 Sep 24. Curr Biol. 2020. PMID: 32976810 Free PMC article.
-
Cyclins and CDKS in development and cancer: lessons from genetically modified mice.Front Biosci. 2006 Jan 1;11:1164-88. doi: 10.2741/1871. Front Biosci. 2006. PMID: 16146805 Review.
Cited by
-
A synthetic biology approach reveals diverse and dynamic CDK response profiles via multisite phosphorylation of NLS-NES modules.Sci Adv. 2022 Aug 19;8(33):eabp8992. doi: 10.1126/sciadv.abp8992. Epub 2022 Aug 17. Sci Adv. 2022. PMID: 35977012 Free PMC article.
-
Docking to a Basic Helix Promotes Specific Phosphorylation by G1-Cdk1.Int J Mol Sci. 2021 Sep 1;22(17):9514. doi: 10.3390/ijms22179514. Int J Mol Sci. 2021. PMID: 34502421 Free PMC article.
-
Statistical analysis of sequential motifs at biologically relevant protein-protein interfaces.Comput Struct Biotechnol J. 2024 Mar 7;23:1244-1259. doi: 10.1016/j.csbj.2024.03.004. eCollection 2024 Dec. Comput Struct Biotechnol J. 2024. PMID: 38550974 Free PMC article.
-
CDK signaling via nonconventional CDK phosphorylation sites.Mol Biol Cell. 2023 Nov 1;34(12):pe5. doi: 10.1091/mbc.E22-06-0196. Mol Biol Cell. 2023. PMID: 37906435 Free PMC article. Review.
-
Orchestrating serine/threonine phosphorylation and elucidating downstream effects by short linear motifs.Biochem J. 2022 Jan 14;479(1):1-22. doi: 10.1042/BCJ20200714. Biochem J. 2022. PMID: 34989786 Free PMC article. Review.
References
Publication types
MeSH terms
Substances
Grants and funding
LinkOut - more resources
Full Text Sources
Molecular Biology Databases
