. 2021 Mar;42(4):1206-1222.
doi: 10.1002/hbm.25287. Epub 2020 Nov 19.

Reorganization of functional brain network architecture in chronic osteoarthritis pain

Affiliations

Reorganization of functional brain network architecture in chronic osteoarthritis pain

Joana Barroso et al. Hum Brain Mapp. 2021 Mar.

Abstract

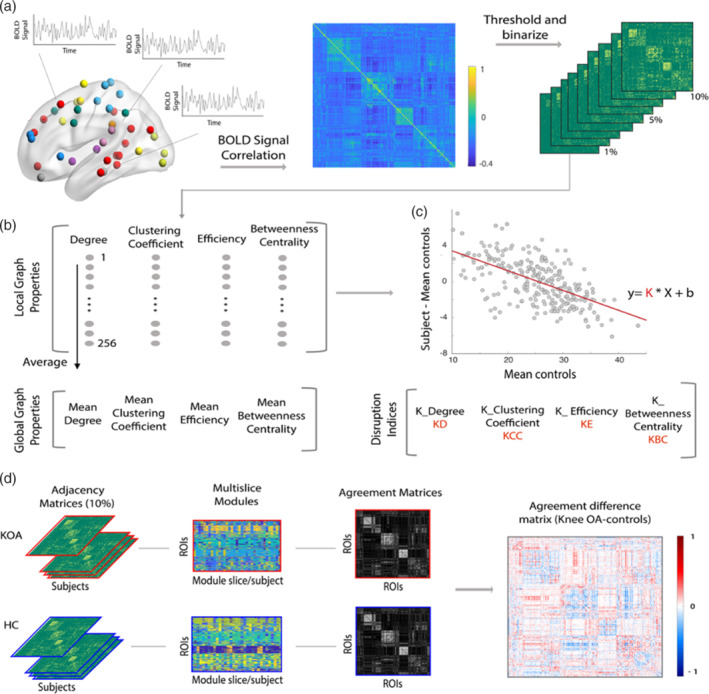
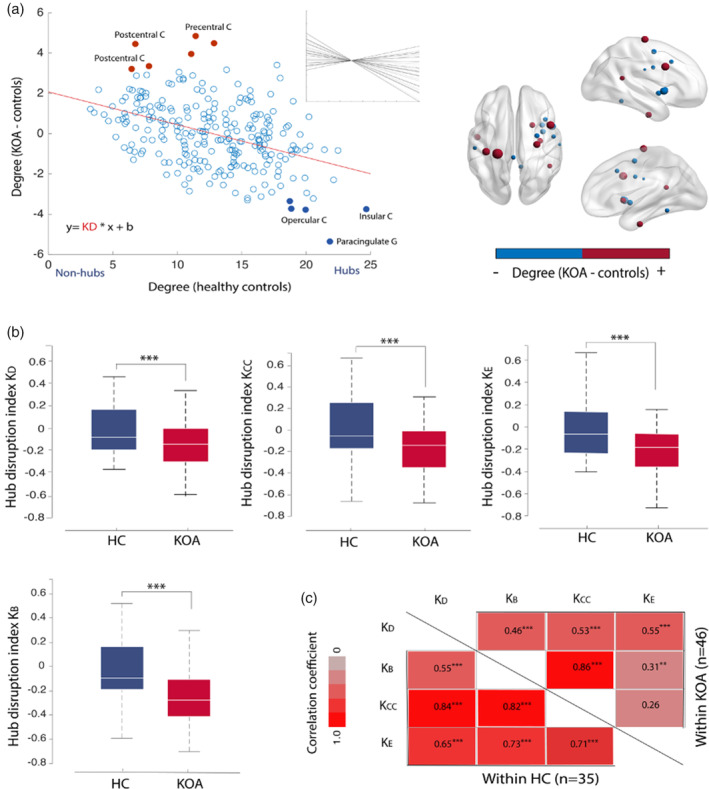
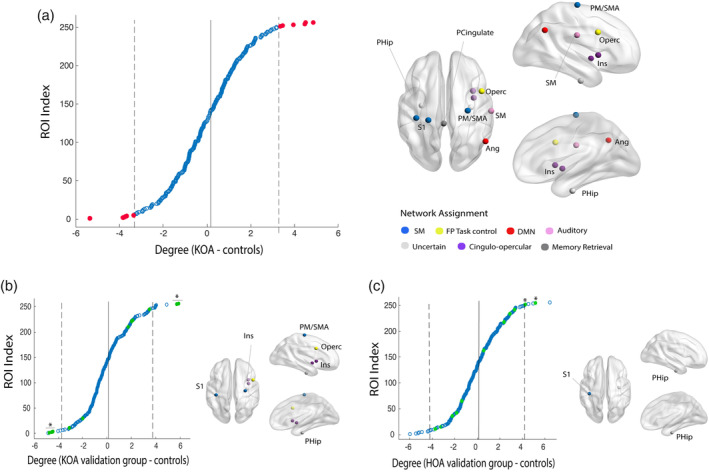
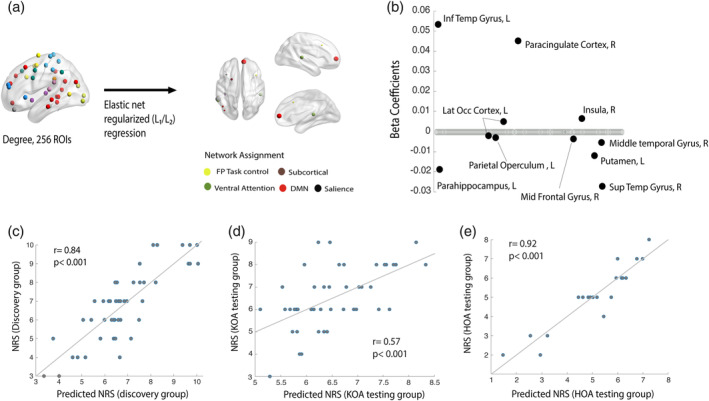
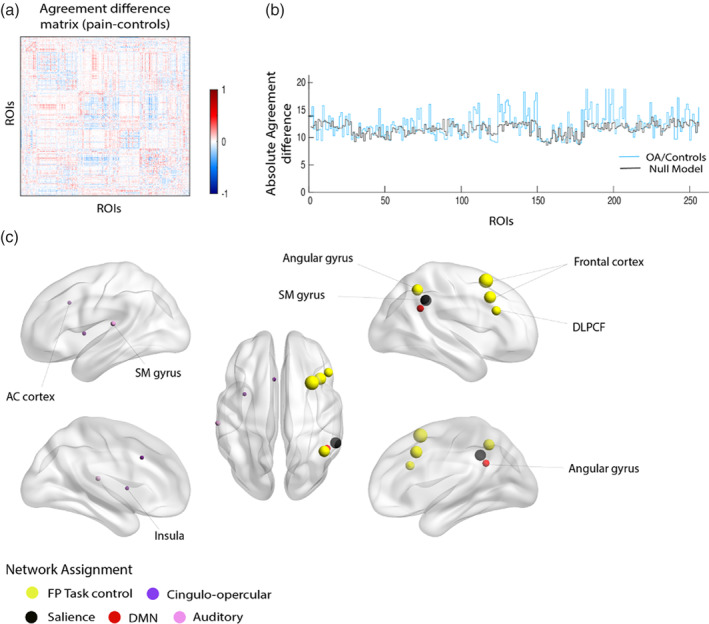
Osteoarthritis (OA) manifests with chronic pain, motor impairment, and proprioceptive changes. However, the role of the brain in the disease is largely unknown. Here, we studied brain networks using the mathematical properties of graphs in a large sample of knee and hip OA (KOA, n = 91; HOA, n = 23) patients. We used a robust validation strategy by subdividing the KOA data into discovery and testing groups and tested the generalizability of our findings in HOA. Despite brain global topological properties being conserved in OA, we show there is a network wide pattern of reorganization that can be captured at the subject-level by a single measure, the hub disruption index. We localized reorganization patterns and uncovered a shift in the hierarchy of network hubs in OA: primary sensory and motor regions and parahippocampal gyrus behave as hubs and insular cortex loses its central placement. At an intermediate level of network structure, frontoparietal and cingulo-opercular modules showed preferential reorganization. We examined the association between network properties and clinical correlates: global disruption indices and isolated degree properties did not reflect clinical parameters; however, by modeling whole brain nodal degree properties, we identified a distributed set of regions that reliably predicted pain intensity in KOA and generalized to hip OA. Together, our findings reveal that while conserving global topological properties, brain network architecture reorganizes in OA, at both global and local scale. Network connectivity related to OA pain intensity is dissociated from the major hub disruptions, challenging the extent of dependence of OA pain on nociceptive signaling.

Keywords: brain networks; brain topology; chronic pain; graph properties; osteoarthritis.


Conflict of interest statement

The authors declare no conflict of interest.

Figures

FIGURE 1
FIGURE 1
Methodological overview of the computation pipeline for global and nodal graph properties, hub disruption indices and modular reorganization analysis. (a) For each subject included in the study, brain was parcellated in 256 regions of interest (ROIs) from a 264 parcellation Scheme (eight ROIs corresponding to the cerebellum were excluded). For each ROI, blood oxygenation level‐dependent signal (BOLD) was extracted as an average over voxels within 10‐mm diameter spheres with center at defined peak coordinate. Next, a 256 × 256 Pearson's full correlation matrix was computed between all pairs of ROIs time‐series; nine adjacency matrices were then calculated at different link densities (2–10%). (b) Graph properties (degree, clustering coefficient, efficiency, and betweenness centrality) were estimated using the Brain Connectivity Toolbox: First, we calculated nodal (local level) properties; latter, by averaging each property across the 256 ROIs we computed the corresponding global measurement. (c) Hub disruption indices were calculated for each subject as the gradient of a straight line fitted to a scatterplot of the nodal property of interest, for example, degree, minus the same nodal property on average in HC ([osteoarthritis [OA] patient—HC group], y‐axis), versus the mean nodal property in the HC group (x‐axis). (d) Modular reorganization was studied by calculating multislice modularity and agreement matrices separately for knee OA (KOA) and controls (agreement: 0 to 1). A difference agreement matrix was then considered, by subtracting controls agreement matrix to KOA (diff. agreement: −1 to 1). A positive entrance value (red) indicates higher likelihood for the two corresponding ROIs to be in the same module in KOA, but not in the control group. The opposite for negative entrance values (blue). Near zero values reveals pairs of ROIs that behave similarly in both groups. A permutational‐based random model was created by shuffling the two groups over 1,000 times, for further statistical testing
FIGURE 2
FIGURE 2
Disruption of functional network hub organization in osteoarthritis (OA) patients. (a) Group hub disruption index calculation for degree (K D) at 5% link density: for each node (256 regions), the mean degree in the control group (x‐axis) is plotted against the mean nodal difference between groups (KOA—control) (y‐axis). Red dots represent nodes that are non‐hubs in controls but show an abnormal increase in degree in KOA patients: precentral and postcentral gyrus; filled blue dots represent nodes that are typically hubs in healthy controls and show a reduction in degree for KOA: insula; paracingulate gyrus; opercular cortex. The hub disruption index corresponds to the slope of the line fitted to the data (red line), K D = −0.18, p < .001. Insert shows individual K D values. On the right, brain graphical representation of the difference in mean degree between KOA and controls, top 10% most different regions of interest (ROIs) are depicted, red denotes abnormally increased degree and blue abnormally decreased degree in KOA compared to healthy controls. (c) Boxplots of the subject‐wise estimated hub disruption indices for the control group (blue) and KOA (red) at 5% link density. Between‐group differences in K D, K BC, K E, and K CC were deemed significant by an ANCOVA (p < .001), while controlling for age and gender. Corresponding results for the same measures different graph connection densities are shown in Figure S2. (d) The four hub disruption indices here significantly correlated with each other (Person's r), and the strength of correlation was overall higher in healthy controls than in KOA patients. ***p < .001; **p < .01; HC, healthy control; KOA, knee osteoarthritis
FIGURE 3
FIGURE 3
Hub topology is altered in knee OA (KOA): differences in hub status between osteoarthritis (OA) patients and healthy controls. (a) Mean nodal difference between groups (KOA—control), organized by score and thresholded at ±2 SD (gray lines) from the mean difference (red dots) and graphic representation of selected nodes. (b) Validation of nodal disruption in KOA hold out sample: 6 out of 11 regions were validated: sensory‐motor regions and parahippocampal gyrus present a significant degree gain and insula/operculum, normal hub nodes, show an abnormal reduction of degree in KOA patients. (c) Hip OA group, validates uniquely the increase in degree for S1 and parahippocampal gyrus. FP, frontoparietal cortex; DMN, default mode network; ROI, region of interest; S1, primary somatosensory cortex; SM, sensory‐motor cortex. *p < .05, permutational test
FIGURE 4
FIGURE 4
Multinodal distributed degree properties predict pain intensity numeric pain rating (NRS) in osteoarthritis (OA) patients. (a) Graphical representation of the linear regression model using Elastic net regularization and variable selection with penalty weight (α) of .5 and regularization parameter (λ) choice via a 10‐fold cross validation. Brain nodes depicted correspond to regions predicting pain intensity; node size reflects the weight (B‐coefficients) in the regression model. This is also illustrated in (b) the majority of nodes has regression coefficients set to zero, indicating that the corresponding variables are not contributing to the model. Nonzero regression coefficients identify the predictive features and indicate the weight and direction of degree change in relation to the response variable: that is, higher levels of pain (NRS) relate with lower degree in parahipoccampal gyrus, putamen, and superior temporal gyrus and higher degree in paracingulate cortex and inferior temporal gyrus. (c) Features selected in the elastic net regression predicted the magnitude of response and (d) validate in the hold out knee OA (KOA) and (e) hip OA samples: high correlation value between predicted and actual NRS scores in the KOA discovery group (Pearson's r = .84, p < .001) KOA holdout testing group (r = .57, p < .001) and HOA holdout testing group (r = .92, p < .001)
FIGURE 5
FIGURE 5
Modular reorganization in osteoarthritis (OA) involves predominantly nodes assigned the frontoparietal and cingulo‐opercular task control networks. (a) Agreement difference matrix obtained from the difference between the modular agreement matrix from OA and control groups. Positive (red) values reflect pairs of nodes that are estimated to appear more commonly in the same module in OA patients, and negative (blue) values represent pairs of nodes that are estimated to appear less commonly in the same module in OA. White value represents regions of interest (ROIs) that has the same behavior in both groups. (b) Blue line shows overall modular reorganization for each node as the sum of both positive and negative values for each node (sum of absolute value per row in (a)), meaning the largest value, the greater reorganization. To statistically evaluate these values, we performed a permutation test of sum reorganization estimation (null model, gray color), yielding one‐side p‐values across all ROIs. (c) Representation of statistically significant nodes showing modular reorganization at a threshold of p < .01; size reflects magnitude of the absolute agreement difference

References

    1. Achard, S. , Delon‐Martin, C. , Vertes, P. E. , Renard, F. , Schenck, M. , Schneider, F. , … Bullmore, E. T. (2012). Hubs of brain functional networks are radically reorganized in comatose patients. Proceedings of the National Academy of Sciences, 109, 20608–20613. - PMC - PubMed
    1. Azevedo, L. (2007). Tradução, adaptação cultural e estudo multicêntrico de validação de instrumentos para rastreio e avaliação do impacto da dor crónica (Translation, cultural adaptation and multicentric validation study of chronic pain screening and impact assessment instruments). Dor, 15, 6–65.
    1. Balke, B. (1963). A simple field test for the assessment of physical fitness. Rep 63‐6. Report Civil Aeromedical Research Institute (U.S.) 1–8. - PubMed
    1. Barroso, J. , Vigotsky, A.D. , Branco, P. , Reis, A.M. , Schnitzer, T.J. , Galhardo, V. , & Apkarian, A.V. (2020). Brain gray matter abnormalities in osteoarthritis pain: a cross‐sectional evaluation. Pain,. 161, 2167–2178. - PMC - PubMed
    1. Bouhassira, D. , Attal, N. , Alchaar, H. , Boureau, F. , Brochet, B. , Bruxelle, J. , … Vicaut, E. (2005). Comparison of pain syndromes associated with nervous or somatic lesions and development of a new neuropathic pain diagnostic questionnaire (DN4). Pain, 114, 29–36. - PubMed

Publication types

MeSH terms