

A digital protein microarray for COVID-19 cytokine storm monitoring
- PMID: 33211045
- PMCID: PMC7855944
- DOI: 10.1039/d0lc00678e
A digital protein microarray for COVID-19 cytokine storm monitoring
Abstract
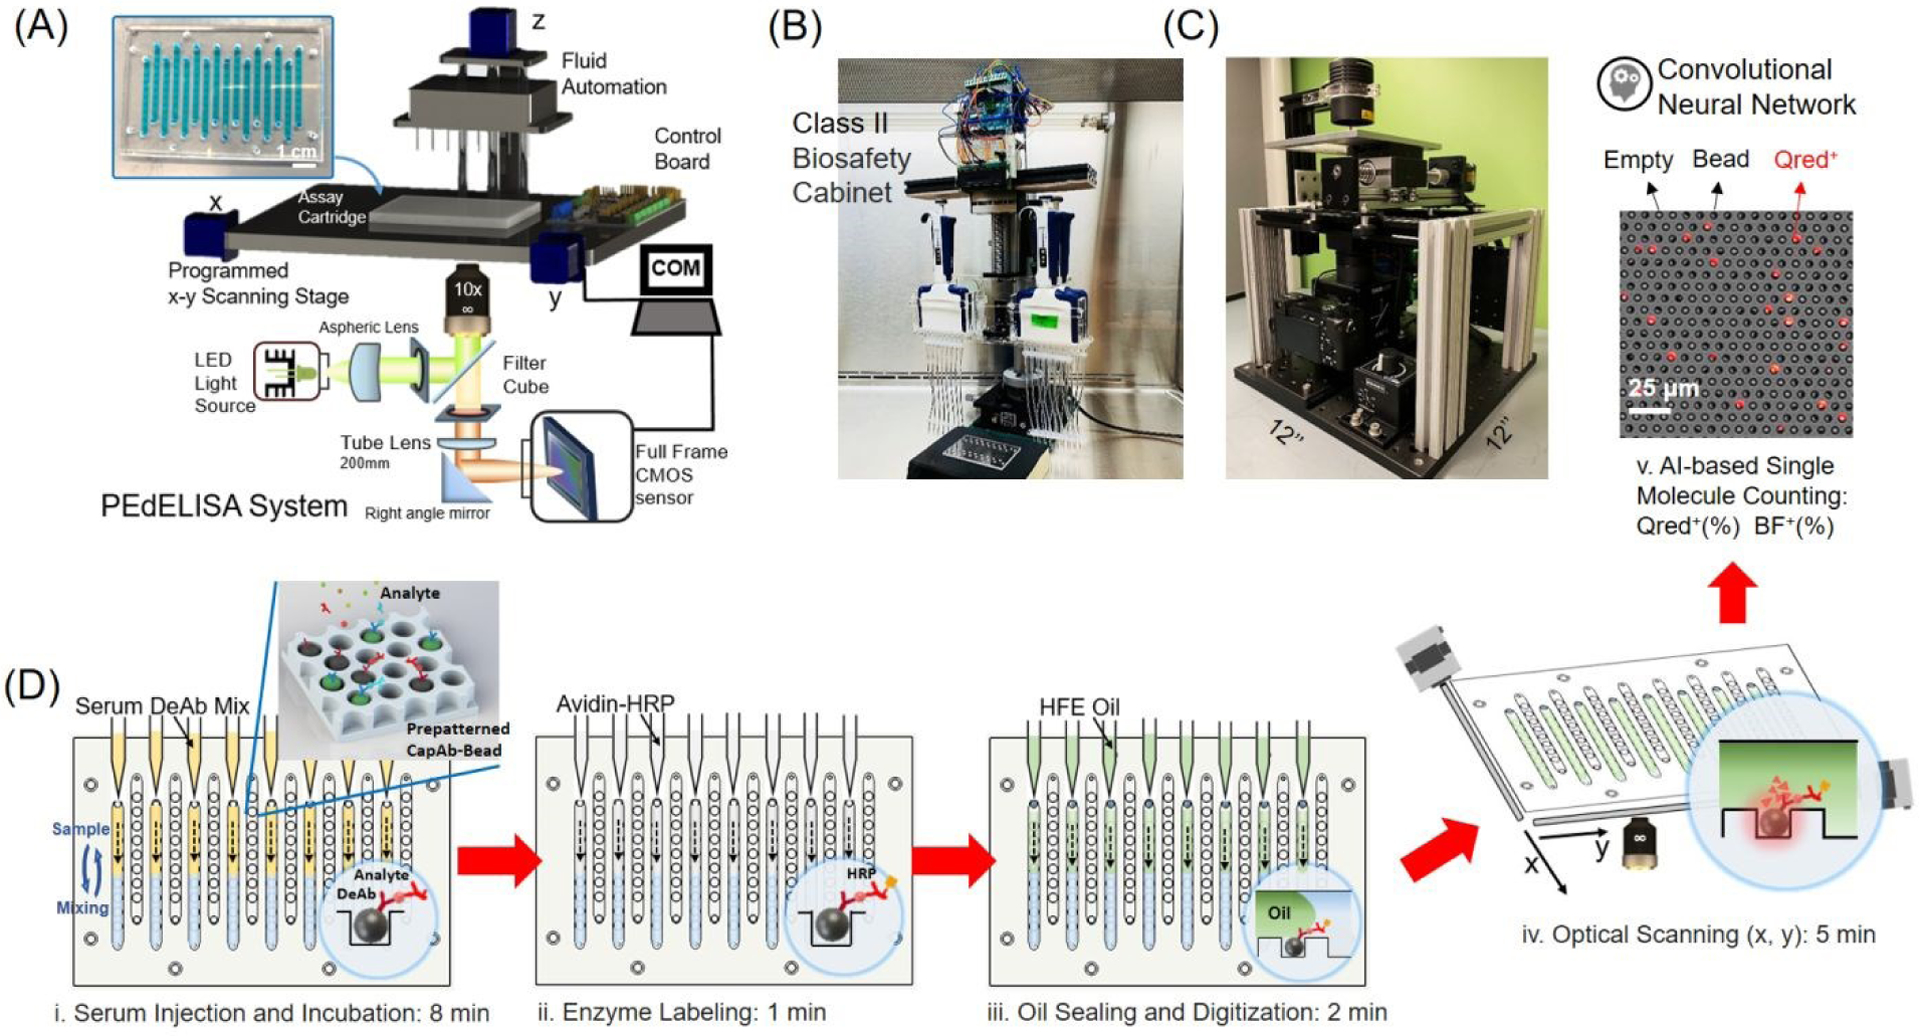
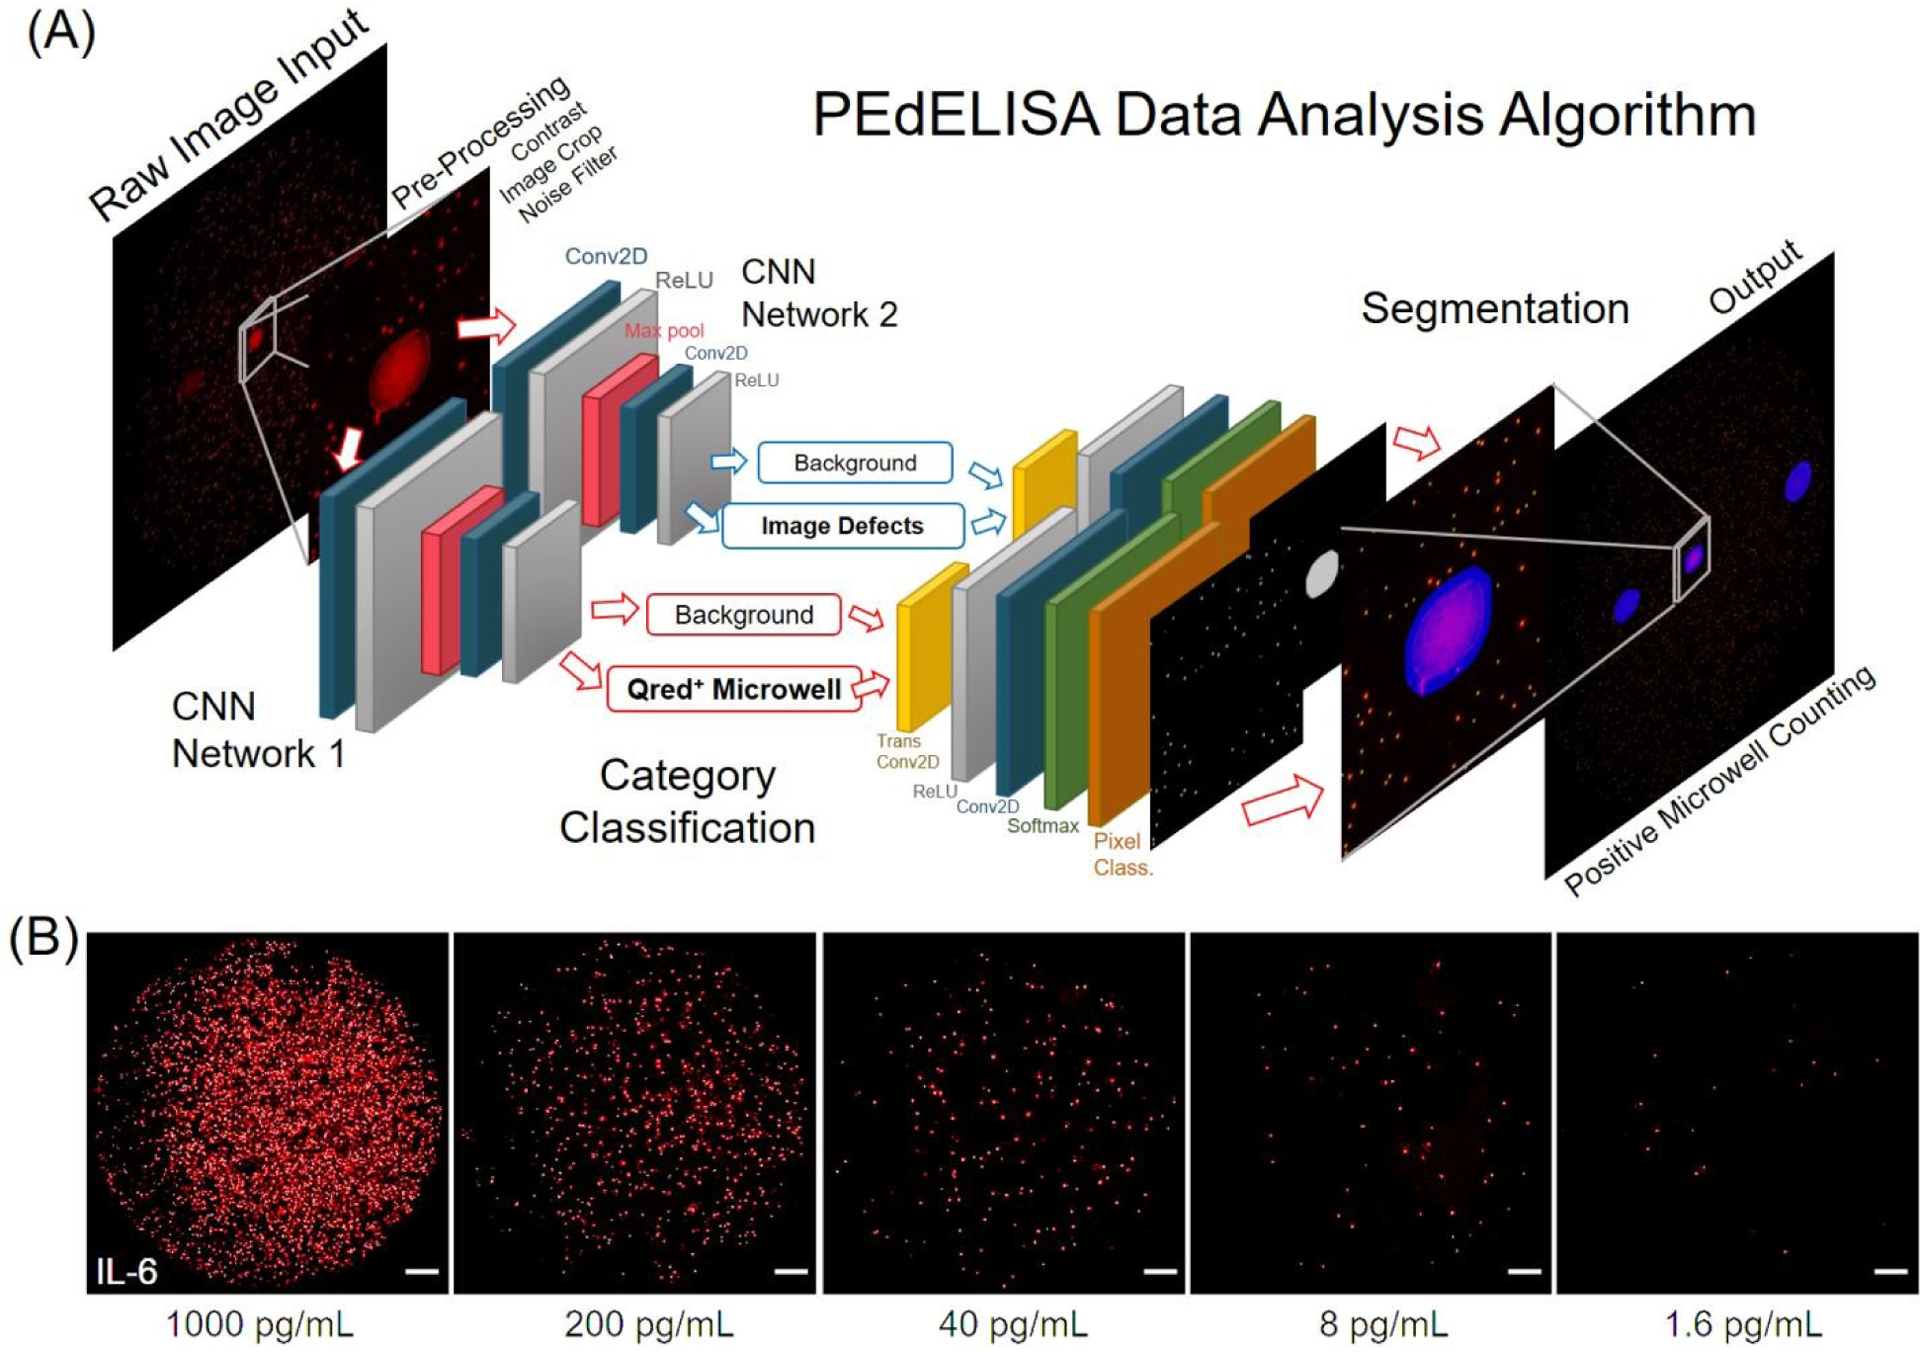
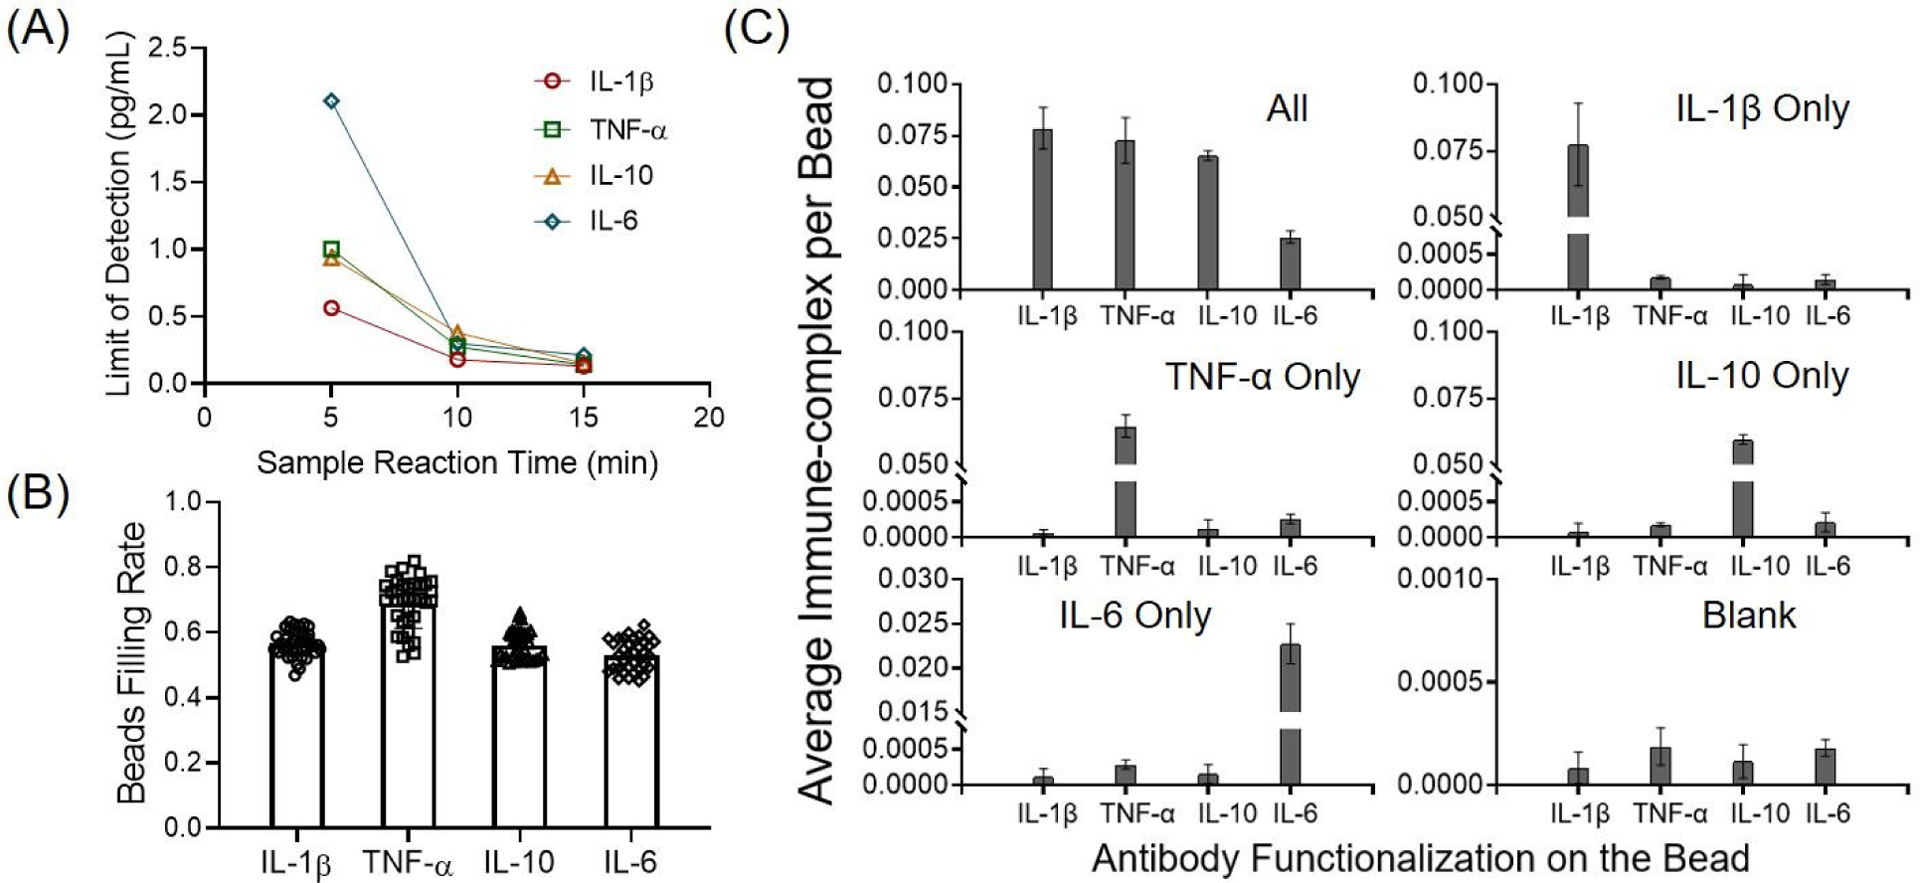
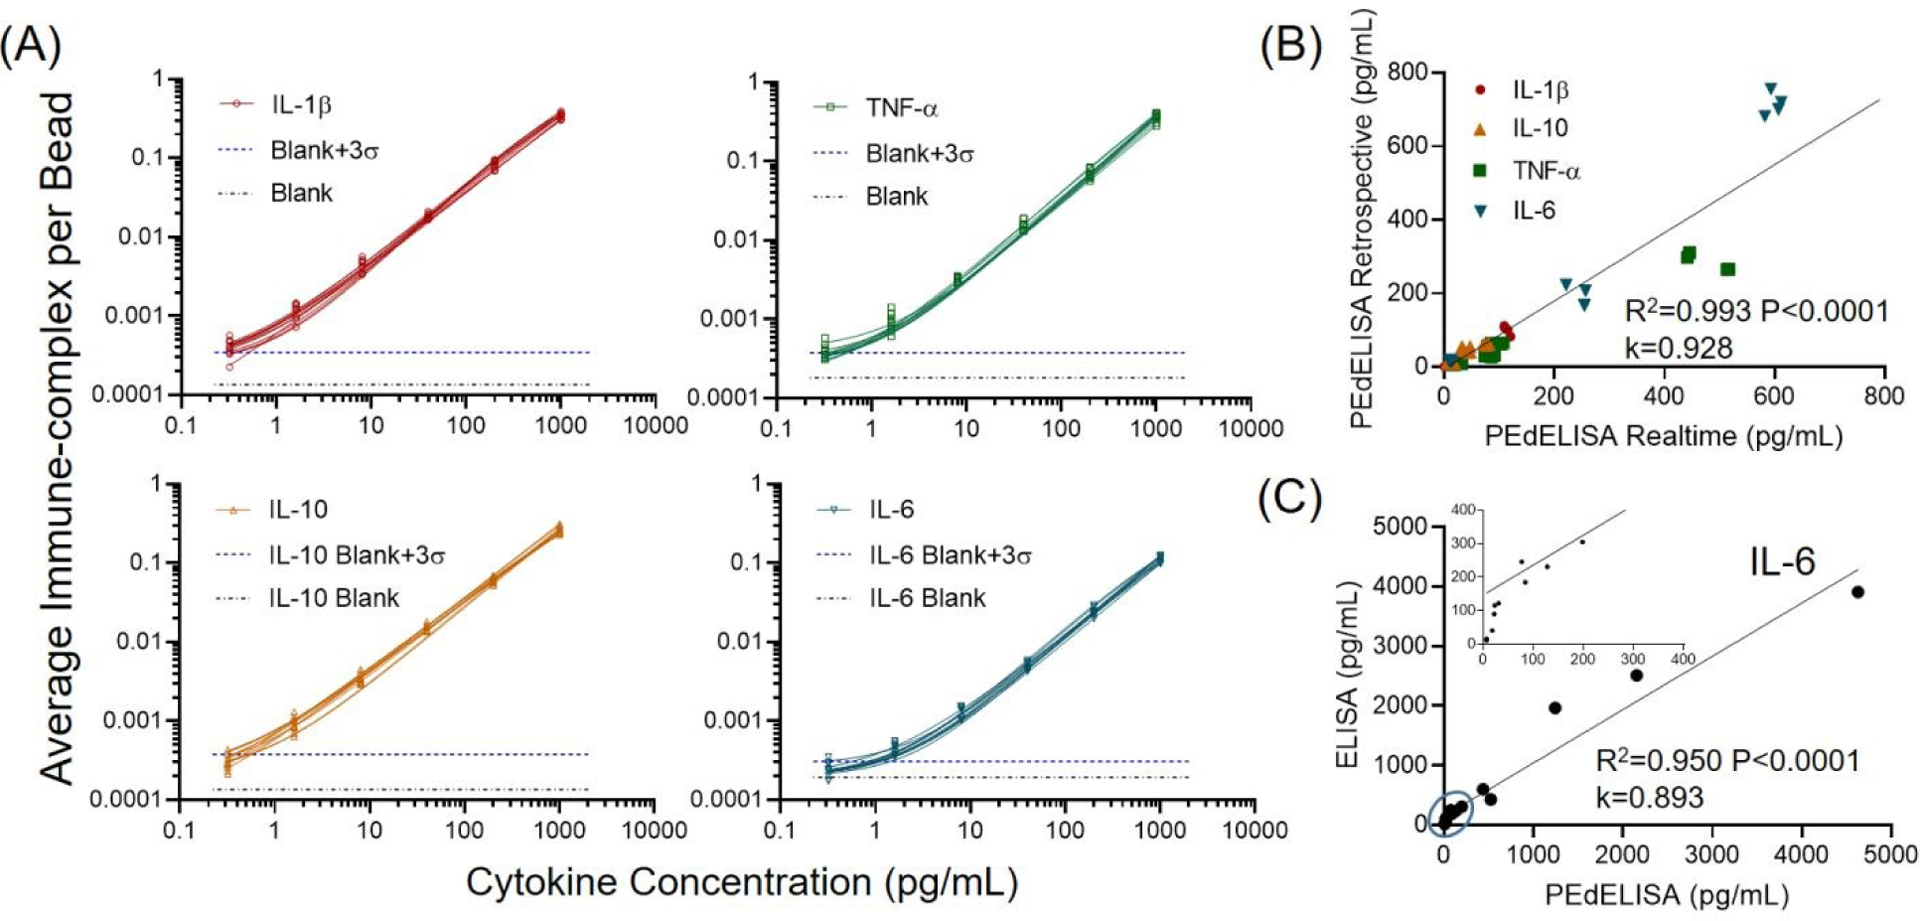
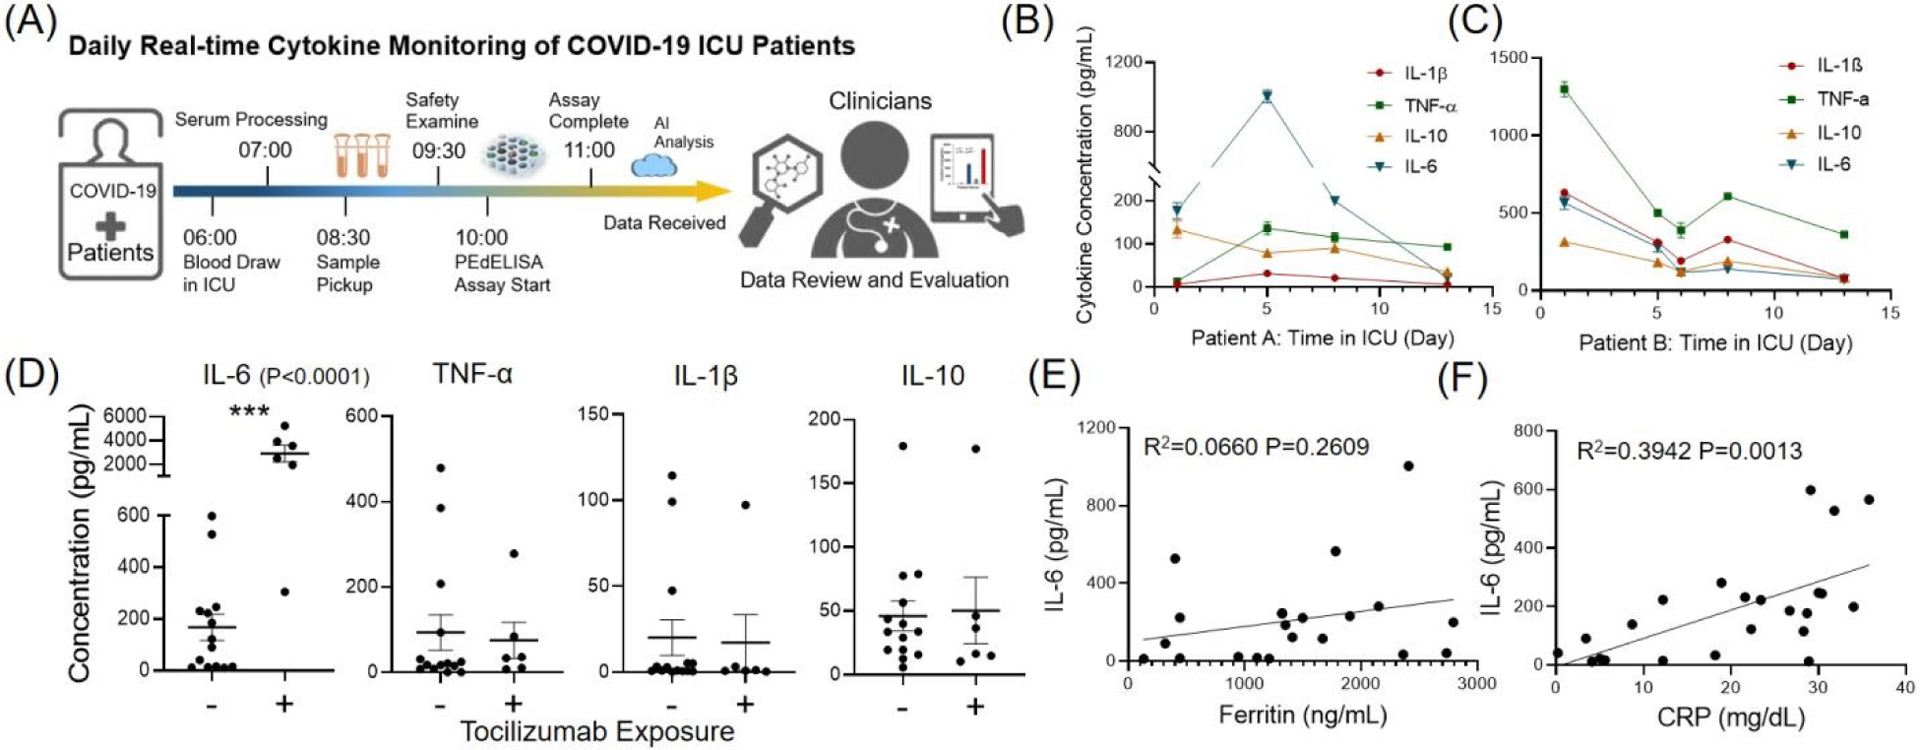
Despite widespread concern regarding cytokine storms leading to severe morbidity in COVID-19, rapid cytokine assays are not routinely available for monitoring critically ill patients. We report the clinical application of a digital protein microarray platform for rapid multiplex quantification of cytokines from critically ill COVID-19 patients admitted to the intensive care unit (ICU) at the University of Michigan Hospital. The platform comprises two low-cost modules: (i) a semi-automated fluidic dispensing/mixing module that can be operated inside a biosafety cabinet to minimize the exposure of the technician to the virus infection and (ii) a 12-12-15 inch compact fluorescence optical scanner for the potential near-bedside readout. The platform enabled daily cytokine analysis in clinical practice with high sensitivity (<0.4 pg mL-1), inter-assay repeatability (∼10% CV), and rapid operation providing feedback on the progress of therapy within 4 hours. This test allowed us to perform serial monitoring of two critically ill patients with respiratory failure and to support immunomodulatory therapy using the selective cytopheretic device (SCD). We also observed clear interleukin-6 (IL-6) elevations after receiving tocilizumab (IL-6 inhibitor) while significant cytokine profile variability exists across all critically ill COVID-19 patients and to discover a weak correlation between IL-6 to clinical biomarkers, such as ferritin and C-reactive protein (CRP). Our data revealed large subject-to-subject variability in patients' response to COVID-19, reaffirming the need for a personalized strategy guided by rapid cytokine assays.
Conflict of interest statement
Conflicts of interest
D.H. discloses the financial interest in SeaStar Medical, Inc. and Innovative Biotherapies, Inc, which has an exclusive license from the University of Michigan to develop the Selective Cytopheretic Device technology.
Figures
Update of
-
A Digital Protein Microarray for COVID-19 Cytokine Storm Monitoring.medRxiv [Preprint]. 2020 Jun 17:2020.06.15.20131870. doi: 10.1101/2020.06.15.20131870. medRxiv. 2020. Update in: Lab Chip. 2021 Jan 21;21(2):331-343. doi: 10.1039/d0lc00678e. PMID: 32587979 Free PMC article. Updated. Preprint.
Similar articles
-
A Digital Protein Microarray for COVID-19 Cytokine Storm Monitoring.medRxiv [Preprint]. 2020 Jun 17:2020.06.15.20131870. doi: 10.1101/2020.06.15.20131870. medRxiv. 2020. Update in: Lab Chip. 2021 Jan 21;21(2):331-343. doi: 10.1039/d0lc00678e. PMID: 32587979 Free PMC article. Updated. Preprint.
-
Profiling serum cytokines in COVID-19 patients reveals IL-6 and IL-10 are disease severity predictors.Emerg Microbes Infect. 2020 Dec;9(1):1123-1130. doi: 10.1080/22221751.2020.1770129. Emerg Microbes Infect. 2020. PMID: 32475230 Free PMC article.
-
Cytokine Profiles Before and After Immune Modulation in Hospitalized Patients with COVID-19.J Clin Immunol. 2021 May;41(4):738-747. doi: 10.1007/s10875-020-00949-6. Epub 2021 Jan 18. J Clin Immunol. 2021. PMID: 33459964 Free PMC article.
-
Circulating Levels of Interleukin-6 and Interleukin-10, But Not Tumor Necrosis Factor-Alpha, as Potential Biomarkers of Severity and Mortality for COVID-19: Systematic Review with Meta-analysis.J Clin Immunol. 2021 Jan;41(1):11-22. doi: 10.1007/s10875-020-00899-z. Epub 2020 Oct 31. J Clin Immunol. 2021. PMID: 33128665 Free PMC article.
-
Cytokine Drizzle-The Rationale for Abandoning "Cytokine Storm".Shock. 2021 Nov 1;56(5):667-672. doi: 10.1097/SHK.0000000000001769. Shock. 2021. PMID: 34652339 Review.
Cited by
-
Machine learning-based cytokine microarray digital immunoassay analysis.Biosens Bioelectron. 2021 May 15;180:113088. doi: 10.1016/j.bios.2021.113088. Epub 2021 Feb 20. Biosens Bioelectron. 2021. PMID: 33647790 Free PMC article.
-
In vitro induction of interleukin-8 by SARS-CoV-2 Spike protein is inhibited in bronchial epithelial IB3-1 cells by a miR-93-5p agomiR.Int Immunopharmacol. 2021 Dec;101(Pt B):108201. doi: 10.1016/j.intimp.2021.108201. Epub 2021 Sep 28. Int Immunopharmacol. 2021. PMID: 34653729 Free PMC article.
-
A tissue chip with integrated digital immunosensors: In situ brain endothelial barrier cytokine secretion monitoring.Biosens Bioelectron. 2023 Mar 15;224:115030. doi: 10.1016/j.bios.2022.115030. Epub 2022 Dec 24. Biosens Bioelectron. 2023. PMID: 36603283 Free PMC article.
-
Human Body-Related Disease Diagnosis Systems Using CMOS Image Sensors: A Systematic Review.Sensors (Basel). 2021 Mar 17;21(6):2098. doi: 10.3390/s21062098. Sensors (Basel). 2021. PMID: 33802718 Free PMC article.
-
Tumor-Induced Inflammatory Cytokines and the Emerging Diagnostic Devices for Cancer Detection and Prognosis.Front Oncol. 2021 Jul 7;11:692142. doi: 10.3389/fonc.2021.692142. eCollection 2021. Front Oncol. 2021. PMID: 34307156 Free PMC article. Review.
References
-
- Moore JB and June CH, Science, 2020, 368, 473–474. - PubMed
Publication types
MeSH terms
Substances
Grants and funding
LinkOut - more resources
Full Text Sources
Other Literature Sources
Medical
Research Materials
Miscellaneous