. 2021 Jan 1;130(1):124-138.
doi: 10.1152/japplphysiol.00156.2020. Epub 2020 Nov 19.

The effects of diet composition and chronic obesity on muscle growth and function

Affiliations

The effects of diet composition and chronic obesity on muscle growth and function

Luís G O de Sousa et al. J Appl Physiol (1985). .

Abstract

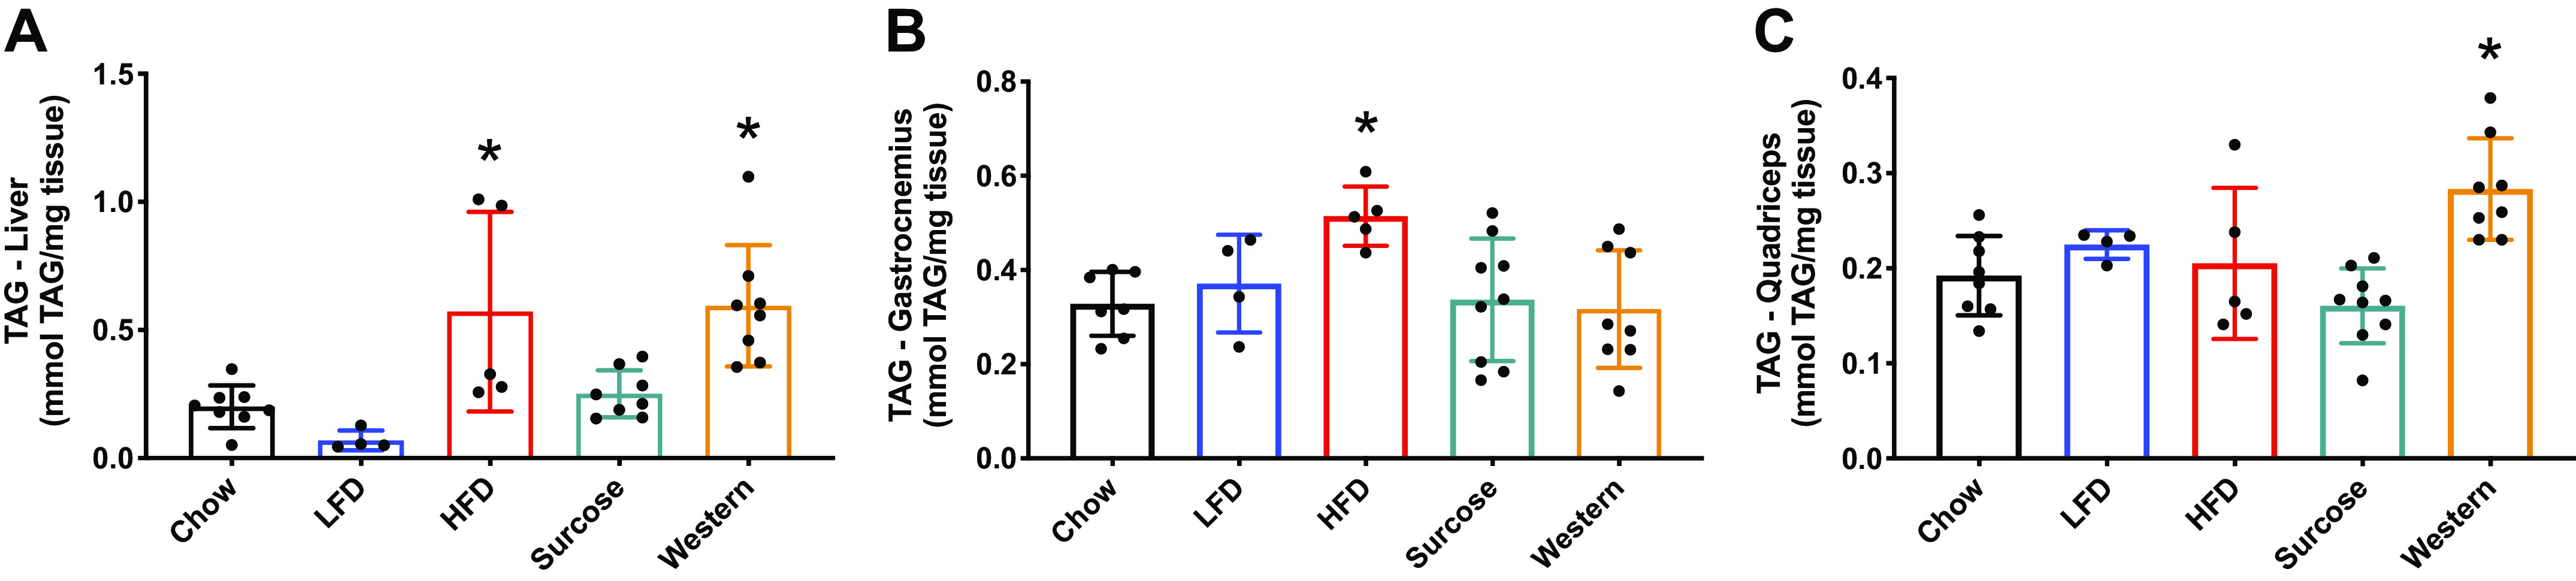
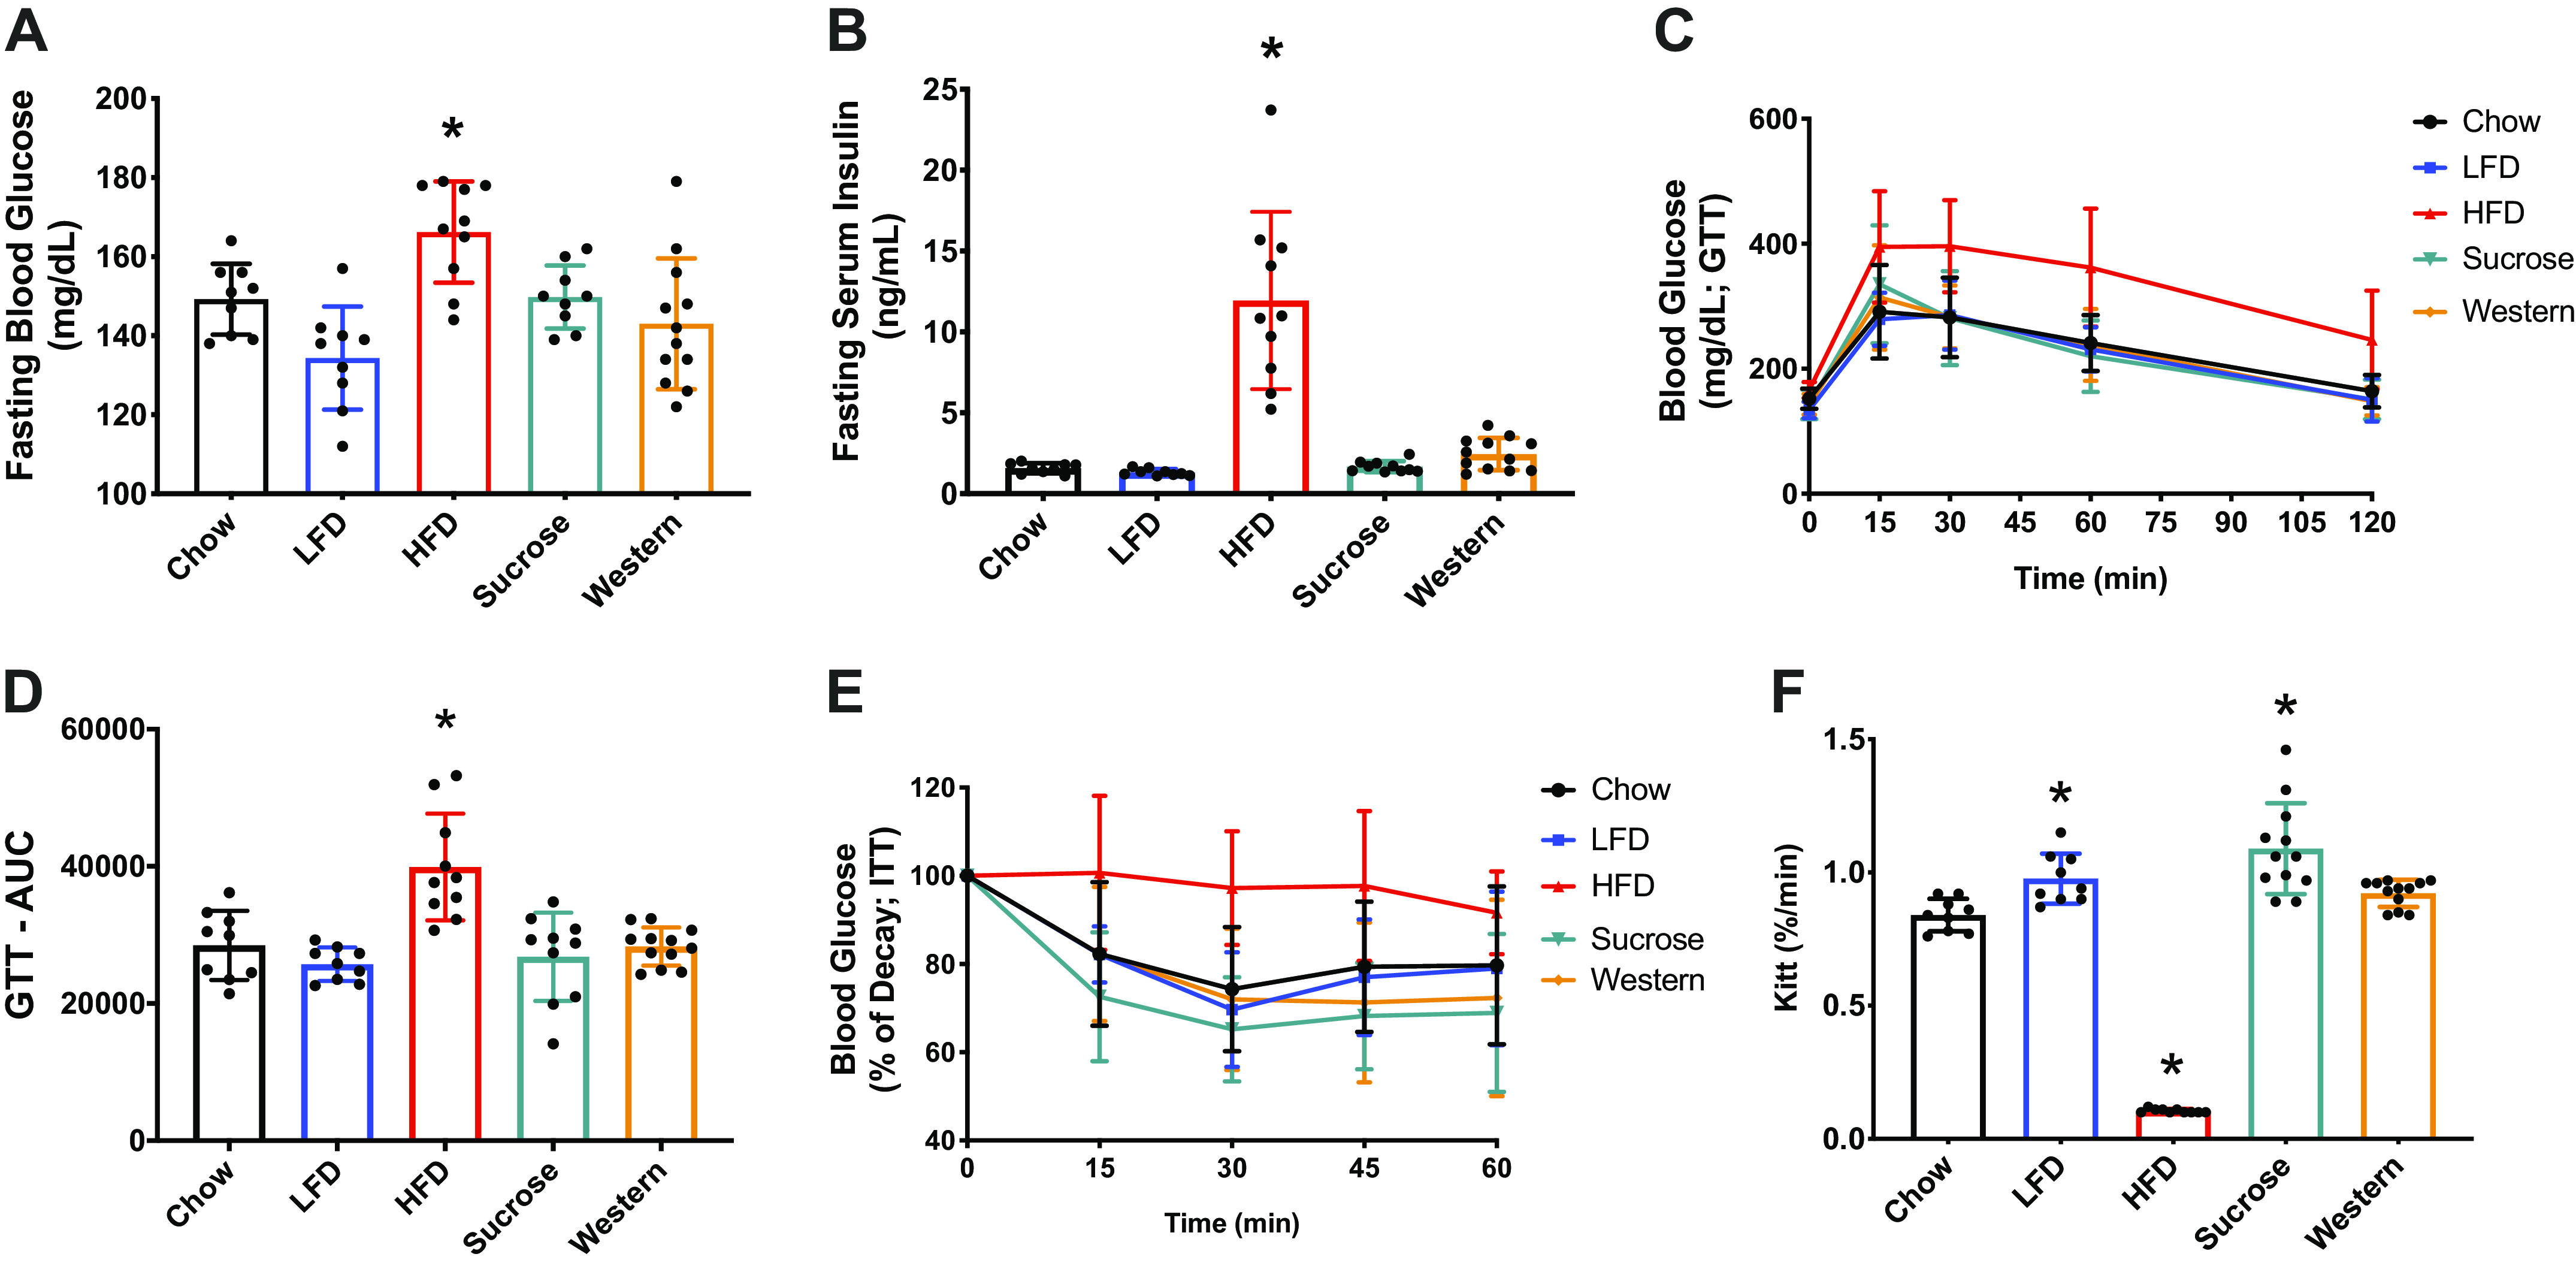
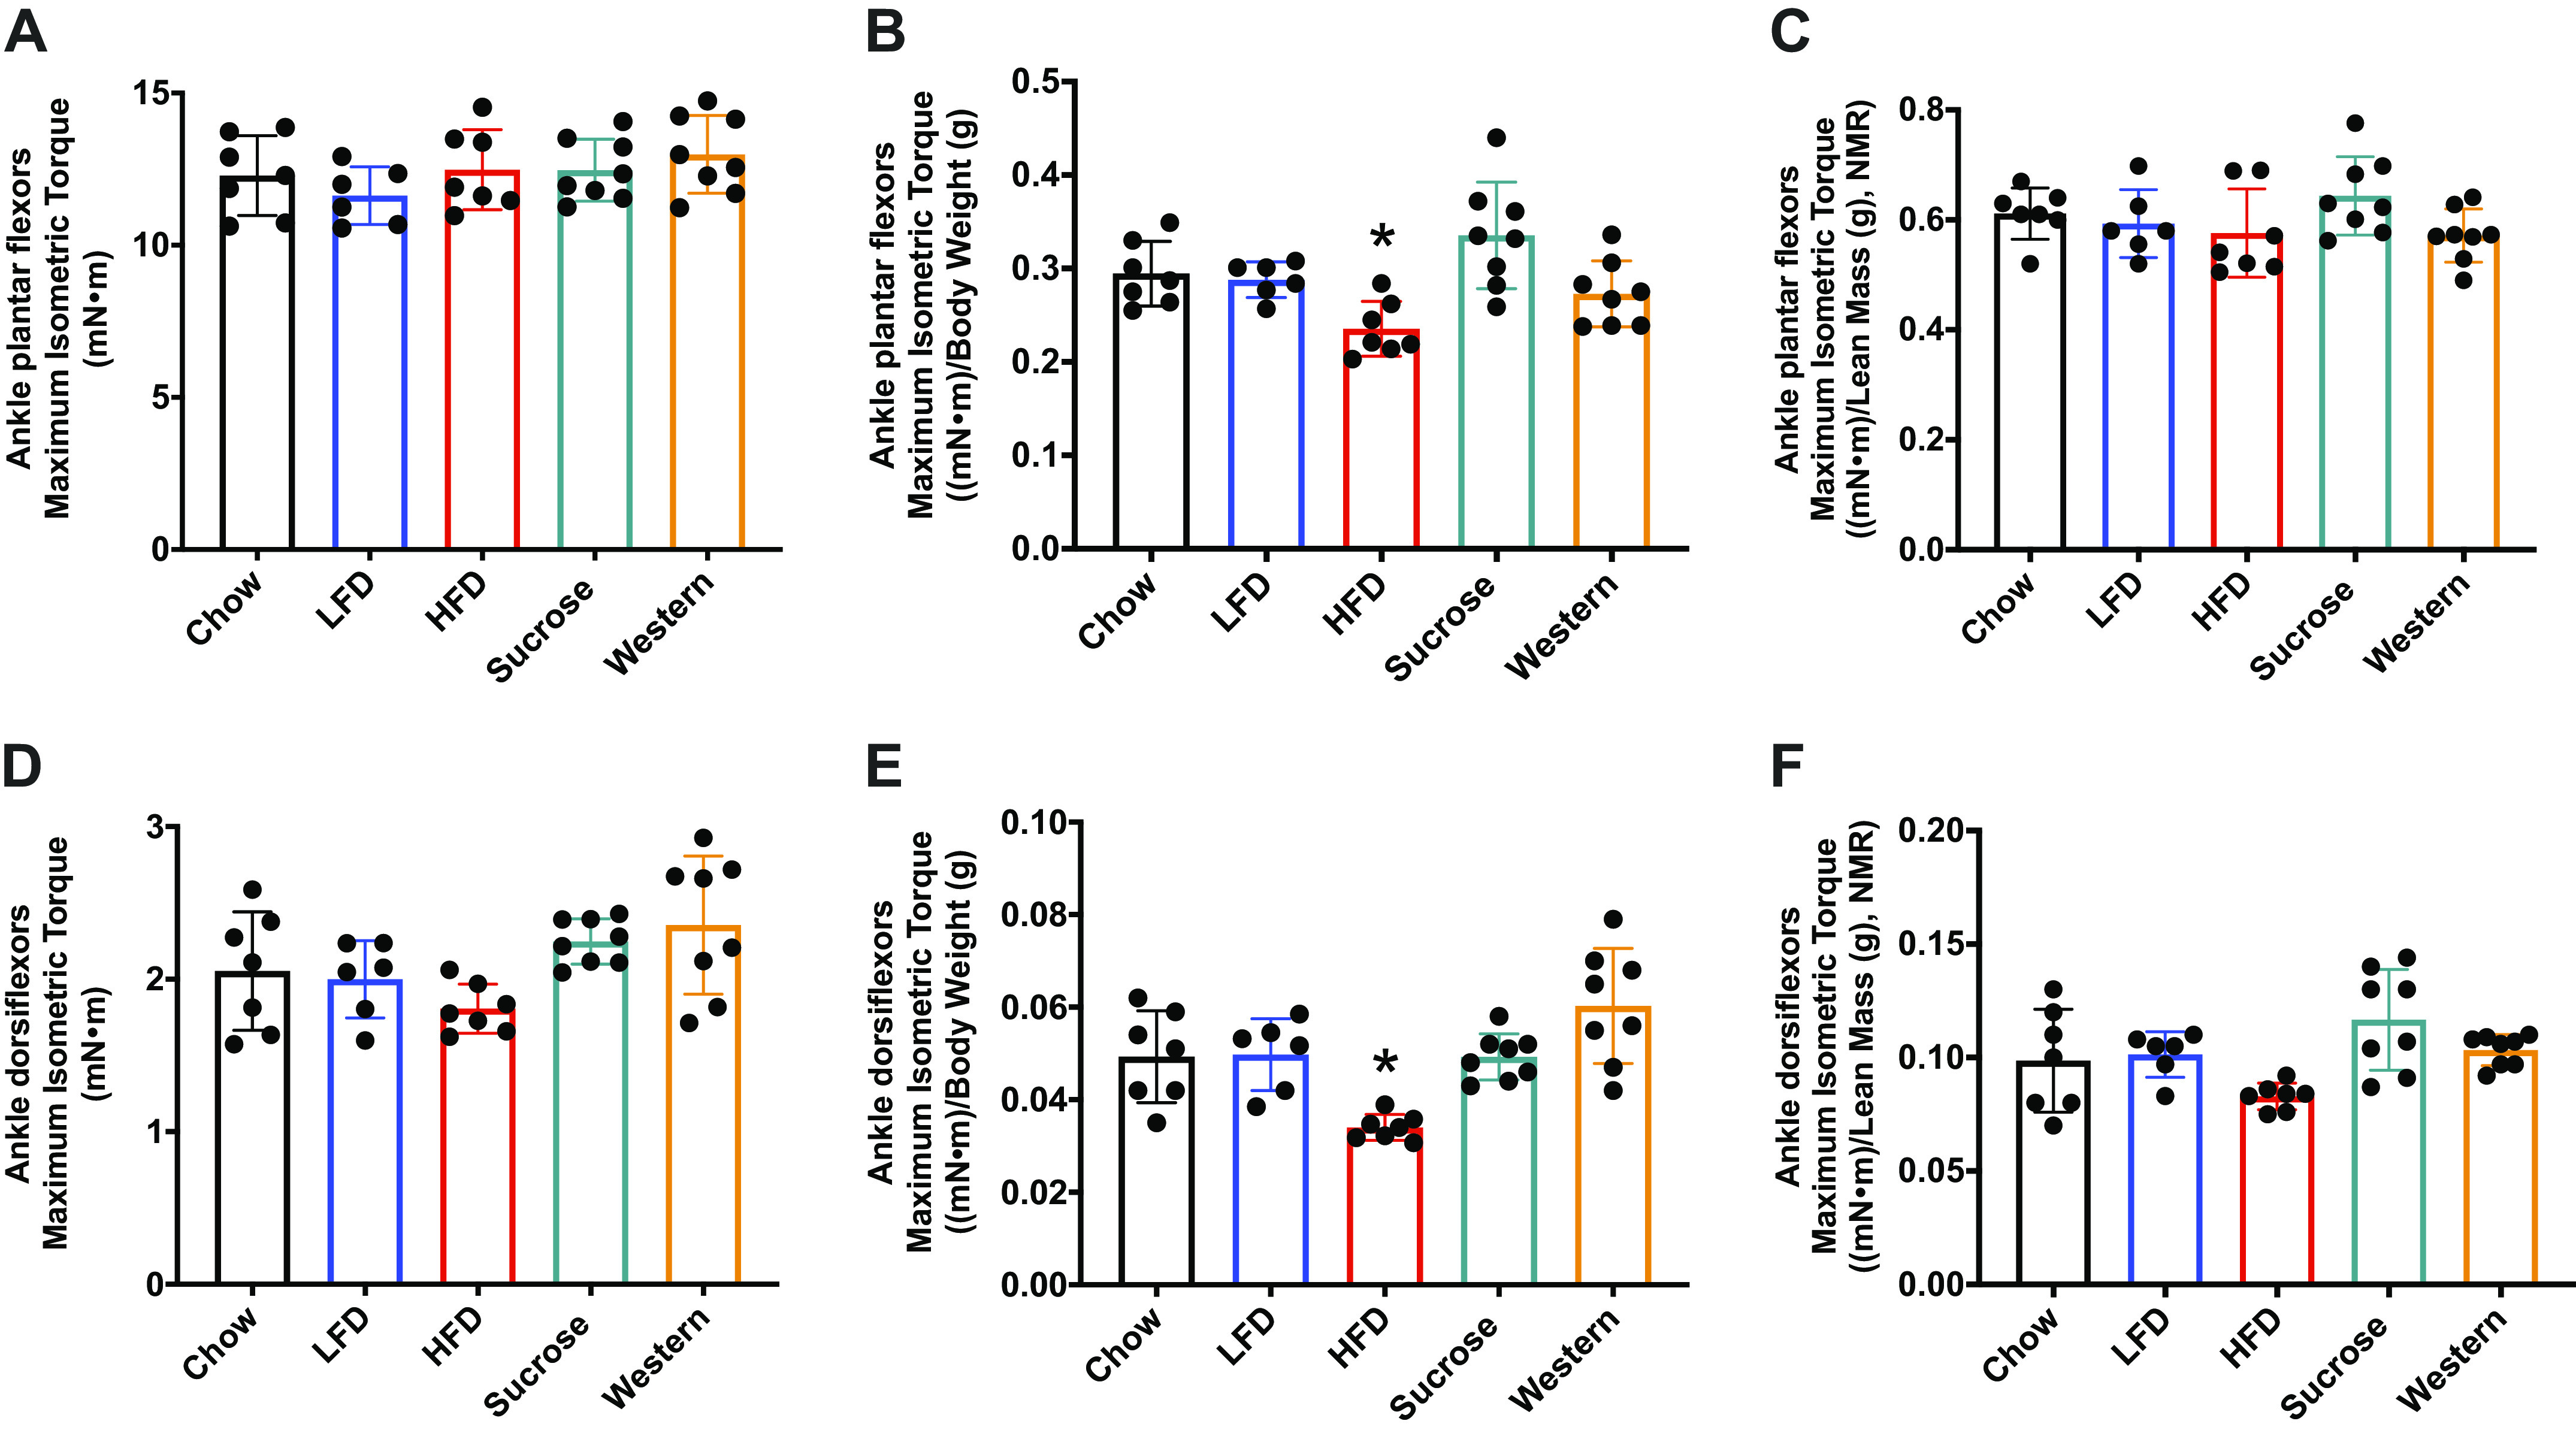
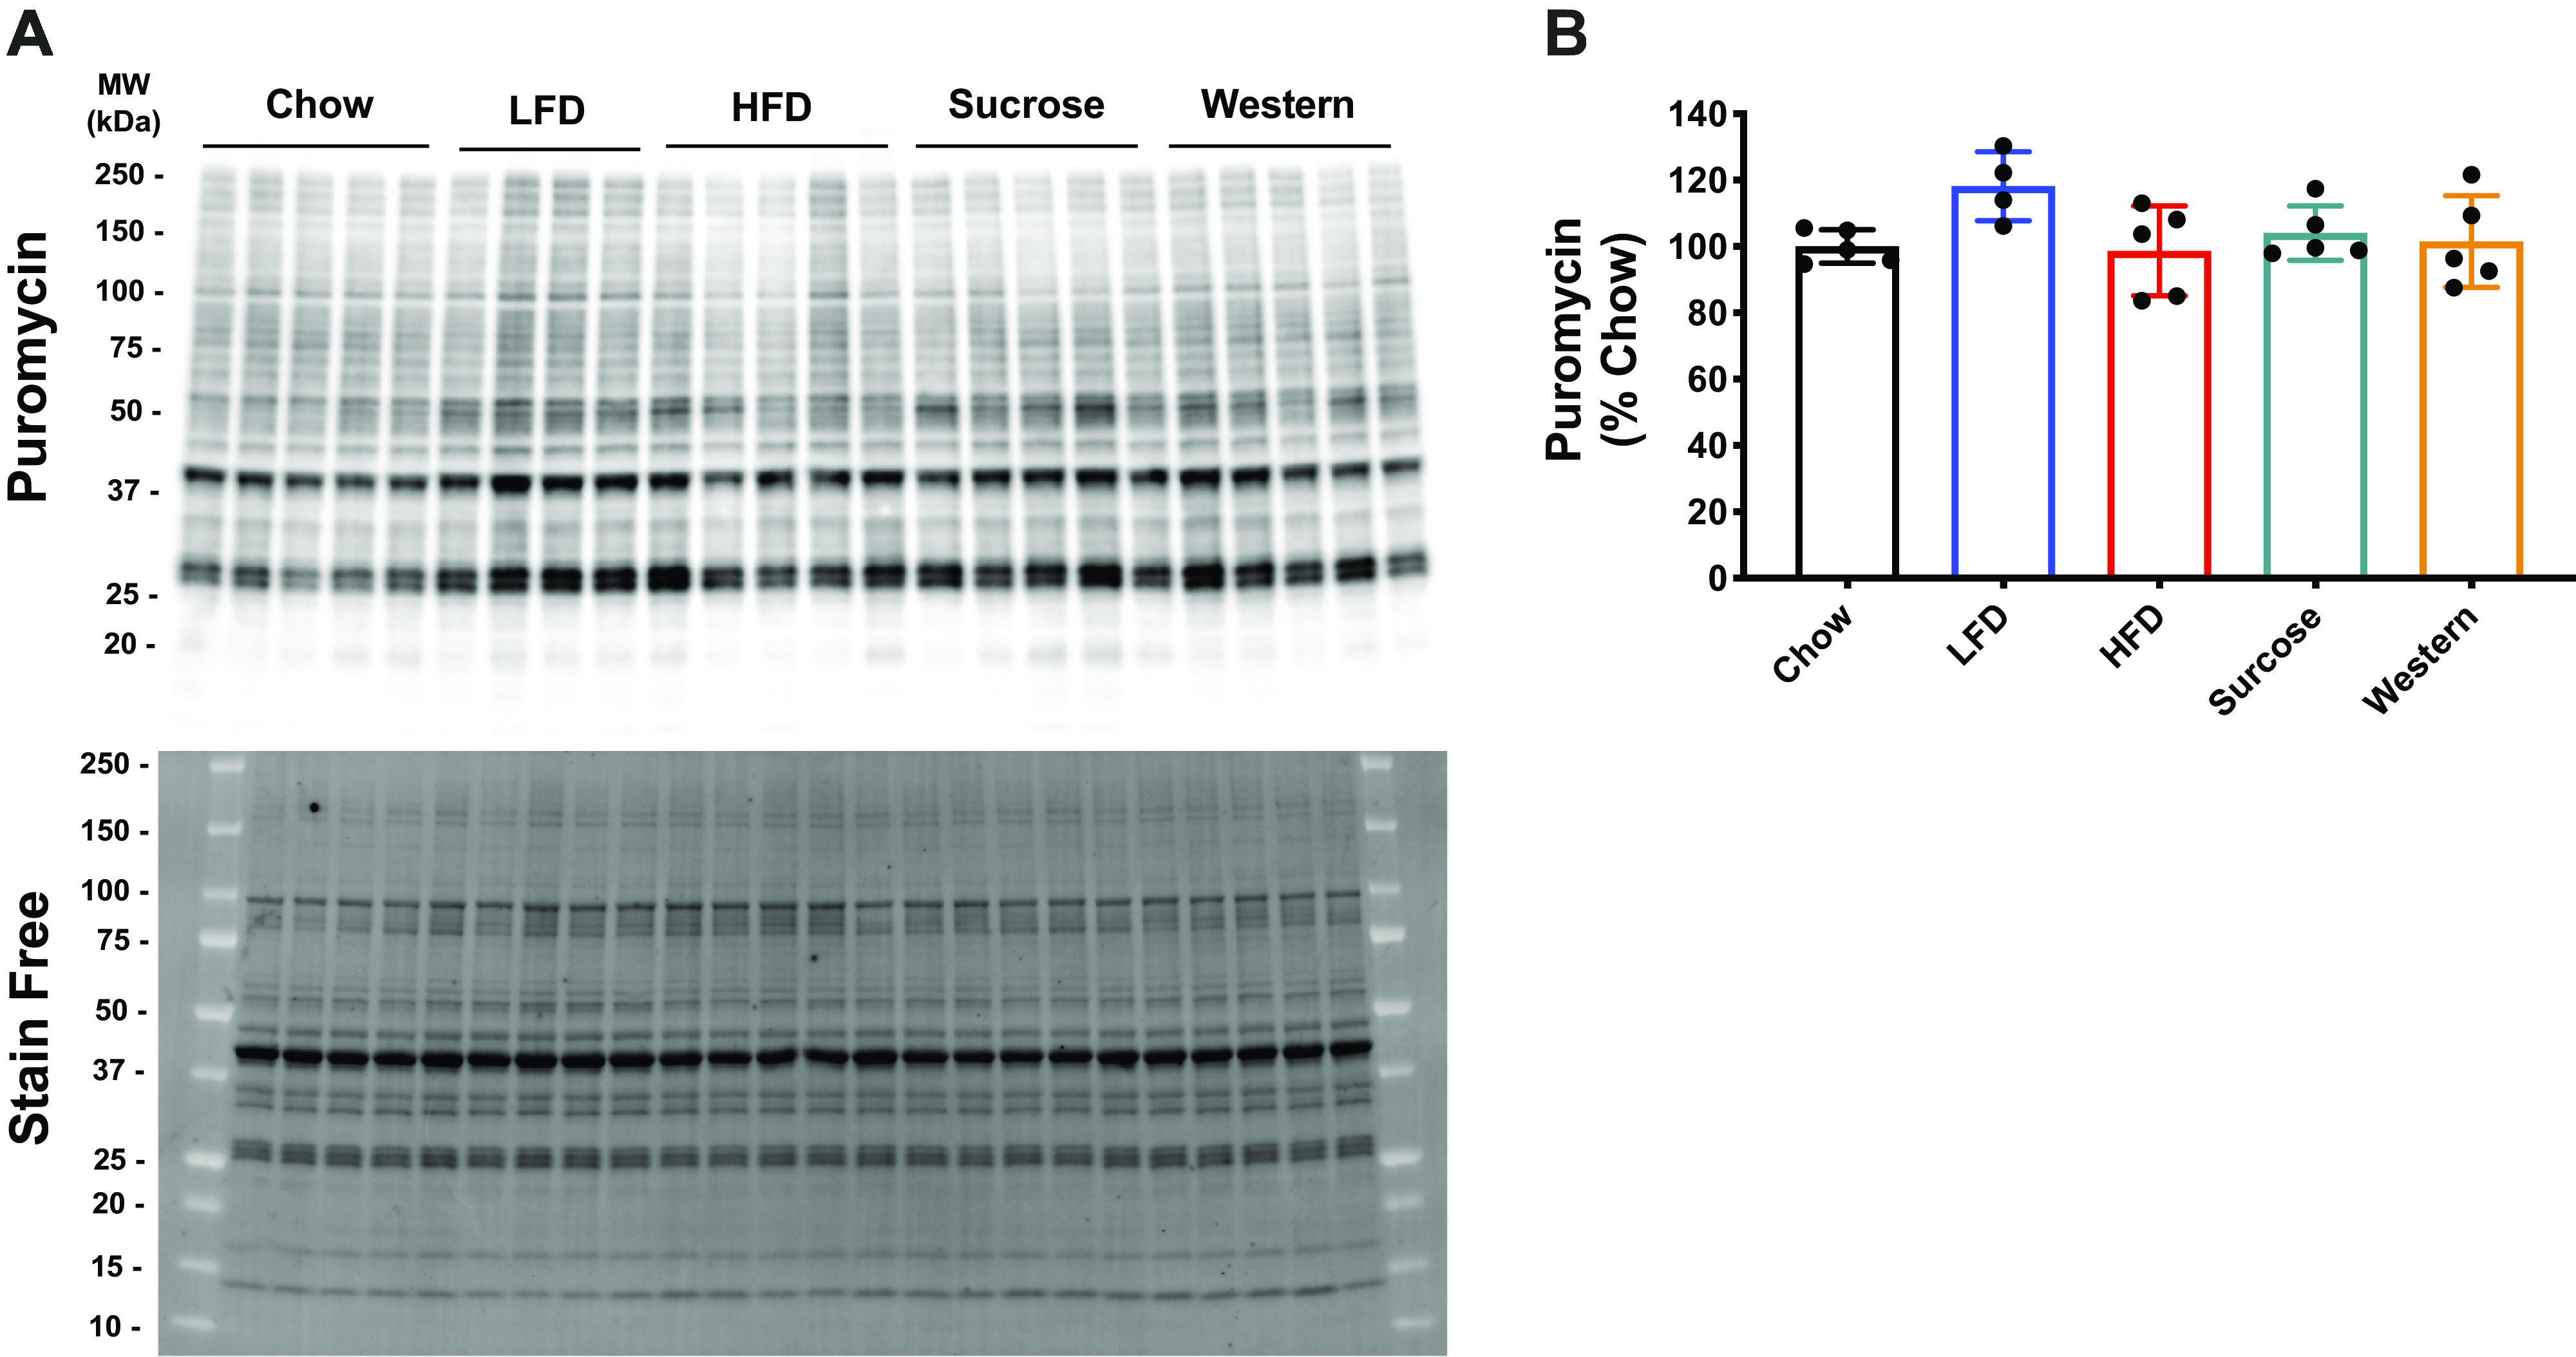
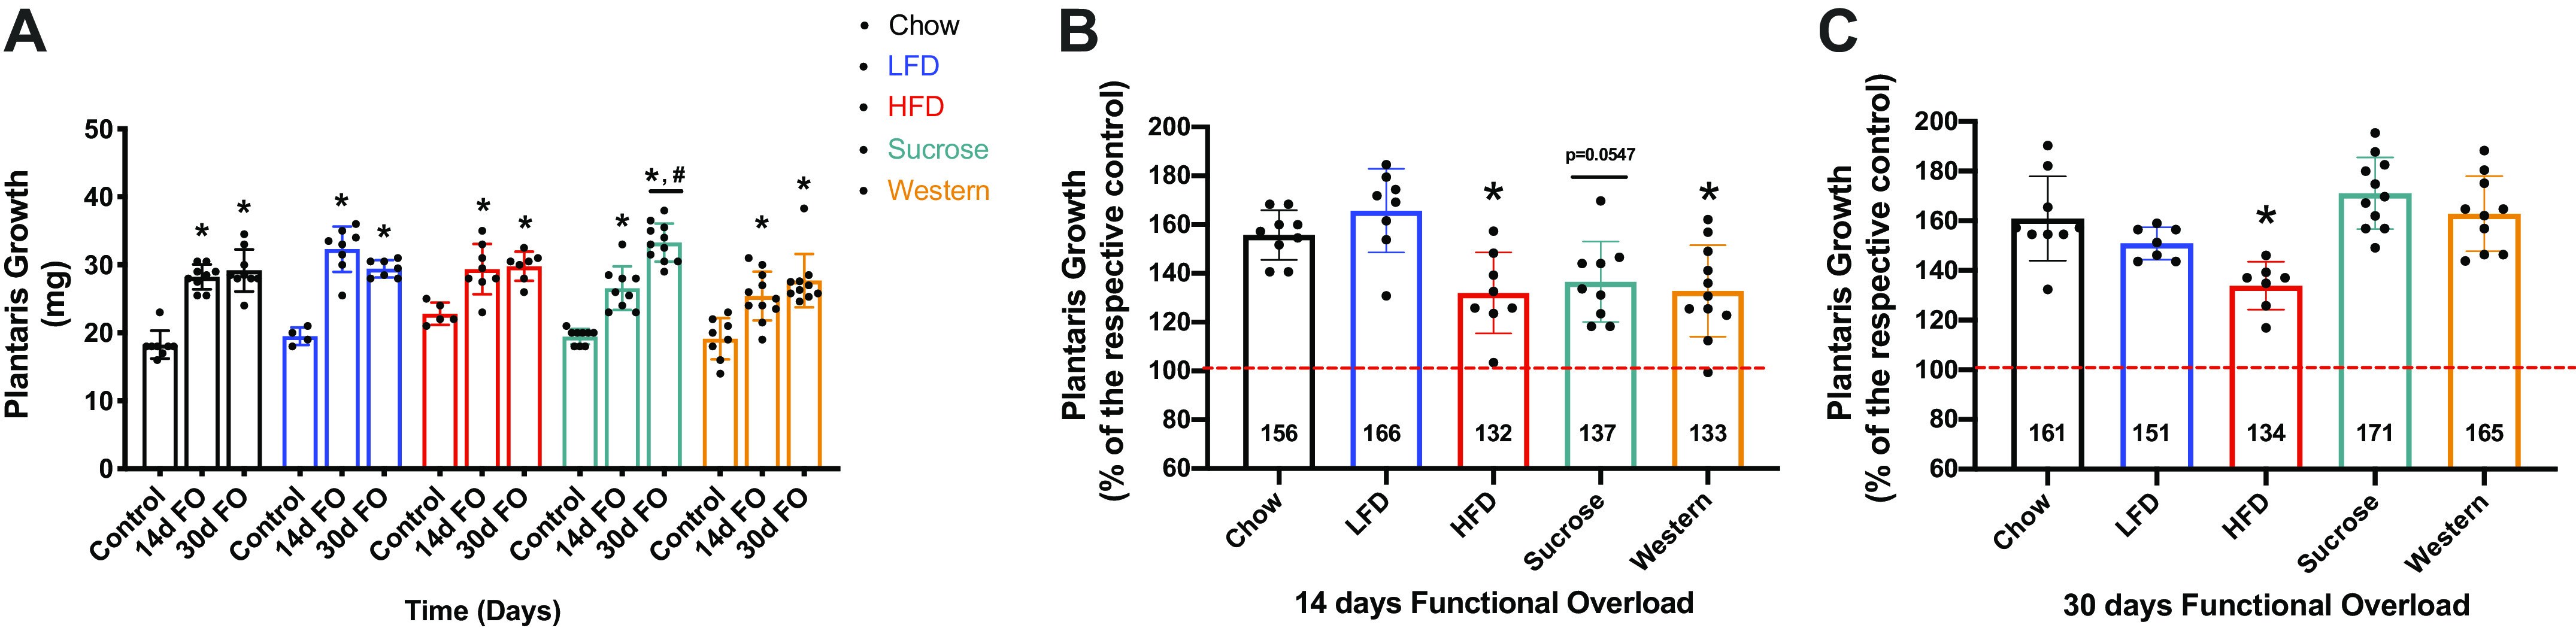
Diet-induced obesity (DIO) is associated with glucose intolerance, insulin resistance (IR), and an increase in intramyocellular lipids (IMCL), which may lead to disturbances in glucose and protein metabolism. To this matter, it has been speculated that chronic obesity and elevated IMCL may contribute to skeletal muscle loss and deficits in muscle function and growth capacity. Thus, we hypothesized that diets with elevated fat content would induce obesity and insulin resistance, leading to a decrease in muscle mass and an attenuated growth response to increased external loading in adult male mice. Male C57BL/6 mice (8 wk of age) were subjected to five different diets, namely, chow, low-dat-diet (LFD), high-fat-diet (HFD), sucrose, or Western diet, for 28 wk. At 25 wk, HFD and Western diets induced a 60.4% and 35.9% increase in body weight, respectively. Interestingly, HFD, but not Western or sucrose, induced glucose intolerance and insulin resistance. Measurement of isometric torque (ankle plantar flexor and ankle dorsiflexor muscles) revealed no effect of DIO on muscle function. At 28 wk of intervention, muscle area and protein synthesis were similar across all diet groups, despite insulin resistance and increased IMCL being observed in HFD and Western diet groups. In response to 30 days of functional overload, an attenuated growth response was observed in only the HFD group. Nevertheless, our results show that DIO alone is not sufficient to induce muscle atrophy and contractile dysfunction in adult male C57BL/6 mice. However, diet composition does have an impact on muscle growth in response to increased external loading.NEW & NOTEWORTHY The effects of diet-induced obesity on skeletal muscle mass are complex and dependent on diet composition and diet duration. The present study results show that chronic exposure to high levels of fatty acids does not affect muscle mass, contractile function, or protein synthesis in obese C57BL/6 mice compared with the consumption of chow. Obesity did result in a delay in load-induced growth; however, only a 45% HFD resulted in attenuated growth following 30 days of functional overload.

Keywords: atrophy; hypertrophy; insulin resistance; intramuscular lipids; muscle function; obesity; skeletal muscle atrophy.


Figures

Figure 1.
Figure 1.
Consumption of diets with elevated fat content lead to increased weight gain and elevated fat composition. body weight (A) and grams of body weight gain (B) for 25 wk. Data were analyzed by one-way ANOVA. < 0.05. *HFD versus Chow; #Western versus Chow; γWestern versus HFD. Values are means ± SD; n = 20 per group. lean and fat mass composition in grams (C) and percent (D) at 24 wk. Data were analyzed by one-way ANOVA. < 0.05. *HFD versus chow; #Western versus chow; γWestern versus HFD. Values are means ± SD, n = 8–12 mice per group. ANOVA, analysis of variance; HFD, high-fat diet; LFD, low-fat diet.
Figure 2.
Figure 2.
Twenty-eight weeks under various diet compositions affected muscle TAG content in a muscle/liver specific manner. Liver (A), gastrocnemius (B), and quadriceps triglyceride content (C). Data were analyzed by one-way ANOVA. P < 0.05. Asterisk (*) denotes significant difference from chow group. Values are means ± SD; n = 4–8 mice per group. ANOVA, analysis of variance; HFD, high-fat diet; LFD, low-fat diet; TAG, triglyceride.
Figure 3.
Figure 3.
Neutral lipids in gastrocnemius muscle after 28 wk on different diets. Gastrocnemius lipids quantification (A) and representative images of the gastrocnemius myofibers following Oil Red O stain (B). Data were analyzed by one-way ANOVA. < 0.05. * versus chow. Values are means ± SD; n = 4–5 mice per group. ANOVA, analysis of variance; HFD, high-fat diet; LFD, low-fat diet.
Figure 4.
Figure 4.
Long-term high-fat diet, not sucrose or Western diet, promotes glucose intolerance and insulin resistance. Fasting blood glucose (A), fasting plasma insulin (B), glucose tolerance test (GTT) performed after 21 wk on each diet (C), GTT area under the curve (D), insulin tolerance test (ITT) (E), and KITT (%/min) (F), plasma glucose disappearance rate in the insulin tolerance test performed after 22 wk on each diet. Data were analyzed by one-way ANOVA. < 0.05. Asterisk (*) denotes significant difference from chow group. Values are means ± SD; n = 9–10 mice per group. insulin tolerance test (ITT) performed after 22 wk on each diet (E). ANOVA, analysis of variance; HFD, high-fat diet; LFD, low-fat diet.
Figure 5.
Figure 5.
Short-term high-fat diet and Western diet, promotes glucose intolerance and insulin resistance. Fasting blood glucose (A), fasting serum insulin (B), glucose tolerance test (GTT) performed after 9 wk on each diet (C), GTT area under the curve (D), insulin tolerance test (ITT) (E), and KITT (%/min) (F), plasma glucose disappearance rate in the insulin tolerance test were performed after 10 wk on each diet. Data were analyzed by one-way ANOVA. < 0.05. Asterisk (*) denotes significant difference from chow group. Values are means ± SD; n = 8 mice per group. ANOVA, analysis of variance; HFD, high-fat diet; LFD, low-fat diet.
Figure 6.
Figure 6.
Muscle contractile function is not impacted by diet fat content. A: maximum isometric torque (mN·m) on ankle plantar flexors (A) and ankle dorsiflexors muscles (D) after 24 wk of diet compared with chow group. Muscle strength normalized by body weight [(mN·m)/body weight (g)] (B and E). Muscle strength normalized by lean muscle mass from NMR [(mN·m)/lean mass (g), NMR] (C and F). Data were analyzed by one-way ANOVA. < 0.05. Asterisk (*) denotes significant difference from chow group. Values are means ± SD; n = 6–8 mice per group. ANOVA, analysis of variance; HFD, high-fat diet; LFD, low-fat diet; NMR, nuclear magnetic resonance.
Figure 7.
Figure 7.
High-fat, sucrose, or Western diet, do not cause muscle atrophy. Soleus (mg) (A), soleus (mg/g body weight) (B), soleus (mg/g lean mass (C), NMR), plantaris (mg) (D) plantaris (mg/g body weight) (E), plantaris (mg/g lean mass, NMR) (F), tibialis anterior (mg) (G), tibialis anterior (mg/g body weight) (H), tibialis anterior (mg/g lean mass, NMR) (I), gastrocnemius (mg) (J), gastrocnemius (mg/g body weight) (K), gastrocnemius (mg/g lean mass, NMR) (L), quadriceps (mg) (M), quadriceps (mg/g body weight) (N), and quadriceps (mg/g lean mass, NMR) (O), after 28 wk on different diets. Data were analyzed by one-way ANOVA. < 0.05. Asterisk (*) denotes significant difference from chow group. Values are means ± SD; n = 4–9 mice per group. ANOVA, analysis of variance; HFD, high-fat diet; LFD, low-fat diet; NMR, nuclear magnetic resonance.
Figure 8.
Figure 8.
Fiber cross section area in unaffected by diets with high fat content. Frequency distribution of fiber cross section area in the MG (A) and plantaris (C). Mean cross section area of the MG (B) and plantaris (D) across the diets. Data were analyzed by one-way ANOVA. Values are means ± SD; n = 4–8 mice per group. ANOVA, analysis of variance; CA, cross-sectional area; HFD, high-fat diet; LFD, low-fat diet.
Figure 9.
Figure 9.
Muscle protein synthesis in mice after 28 wk on various diets. Puromycin and stain free representative image of Western blot (A). Stain free was utilized to do the total protein expression normalization. Quantification of the puromycin Western blot (B). Data were analyzed by one-way ANOVA. Values are means ± SD; n = 4–5 mice per group. ANOVA, analysis of variance; HFD, high-fat diet; LFD, low-fat diet.
Figure 10.
Figure 10.
Plantaris growth (absolute and relative) in mice after 14 and 30 days of functional overload. Plantaris growth (mg) after 14 and 30 days of functional overload (A). Data were analyzed by two-way ANOVA. < 0.05. Asterisk (*) denotes significant difference from respective control. Pound (#) denotes significant difference from sucrose 14 days FO. Values are means ± SD; n = 4–11 mice per group. Plantaris growth after 14 days FO (B) and (C) 30 days FO. Data were analyzed by one-way ANOVA. < 0.05. Asterisk (*) denotes significant difference from chow 14 days FO (B) or chow 30 days FO (C). Values are means ± SD; n = 4–11 mice per group. ANOVA, analysis of variance; FO, functional overload; HFD, high-fat diet; LFD, low-fat diet.
Figure 11.
Figure 11.
Muscle protein synthesis in mice after 14 and 30 days of functional overload. Puromycin and stain free representative image of Western blot. Stain free was utilized to do the total protein expression normalization (A and B). Quantification of the puromycin Western blot for 14 days FO (C) and 30 days FO (D) groups. Data were analyzed by one-way ANOVA. < 0.05. Asterisk (*) denotes significant difference from chow group. Values are means ± SD; n = 4–8 mice per group. ANOVA, analysis of variance; FO, functional overload; HFD, high-fat diet; LFD, low-fat diet.

Similar articles

Cited by

References

    1. Tomlinson DJ, Erskine RM, Morse CI, Winwood K, Onambele-Pearson G. The impact of obesity on skeletal muscle strength and structure through adolescence to old age. Biogerontology 17: 467–483, 2016. doi:10.1007/s10522-015-9626-4. - DOI - PMC - PubMed
    1. Finkelstein EA. How big of a problem is obesity? Surg Obes Relat Dis 10: 569–570, 2014. doi:10.1016/j.soard.2014.02.028. - DOI - PubMed
    1. Finkelstein EA, Trogdon JG, Cohen JW, Dietz W. Annual medical spending attributable to obesity: payer-and service-specific estimates. Health Aff (Millwood) 28: w822–w831, 2009. doi:10.1377/hlthaff.28.5.w822. - DOI - PubMed
    1. Pahlavani M, Ramalingam L, Miller EK, Scoggin S, Menikdiwela KR, Kalupahana NS, Festuccia WT, Moustaid-Moussa N. Eicosapentaenoic acid reduces adiposity, glucose intolerance and increases oxygen consumption independently of uncoupling protein 1. Mol Nutr Food Res 63: e1800821, 2019. doi:10.1002/mnfr.201800821. - DOI - PMC - PubMed
    1. Stenholm S, Sallinen J, Koster A, Rantanen T, Sainio P, Heliovaara M, Koskinen S. Association between obesity history and hand grip strength in older adults–exploring the roles of inflammation and insulin resistance as mediating factors. J Gerontol A Biol Sci Med Sci 66A: 341–348, 2011. doi:10.1093/gerona/glq226. - DOI - PMC - PubMed

Publication types

LinkOut - more resources