

Quantifying myelin content in brain tissue using color Spatial Light Interference Microscopy (cSLIM)
- PMID: 33211727
- PMCID: PMC7676665
- DOI: 10.1371/journal.pone.0241084
Quantifying myelin content in brain tissue using color Spatial Light Interference Microscopy (cSLIM)
Abstract
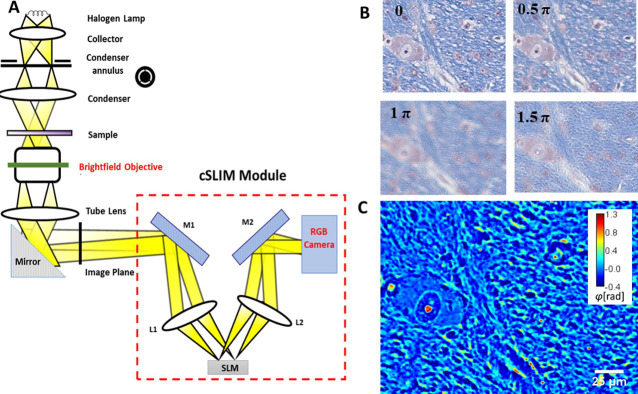
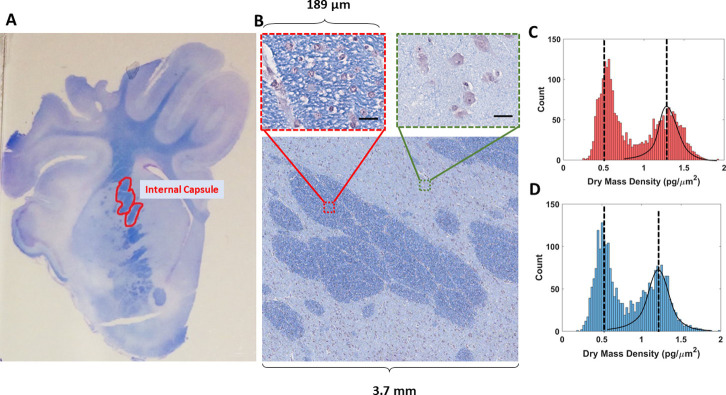
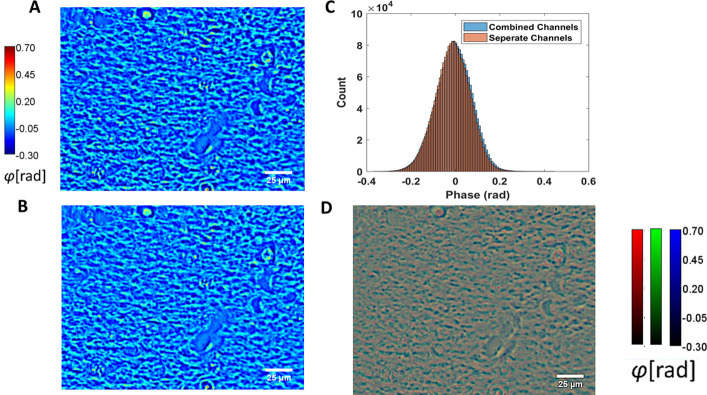
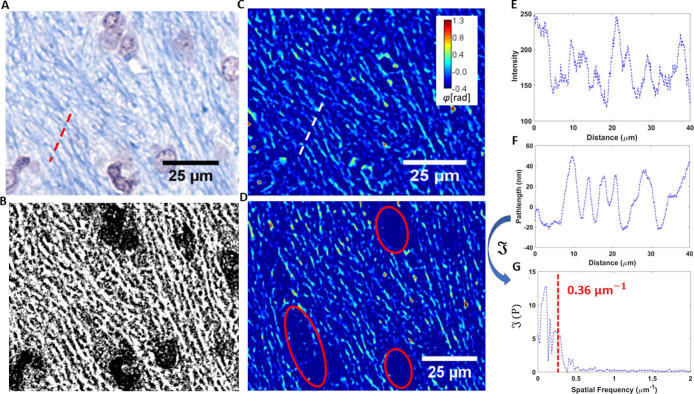
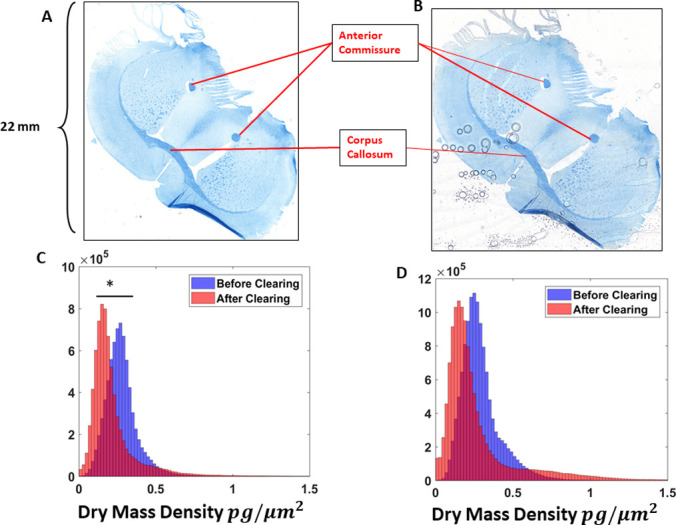
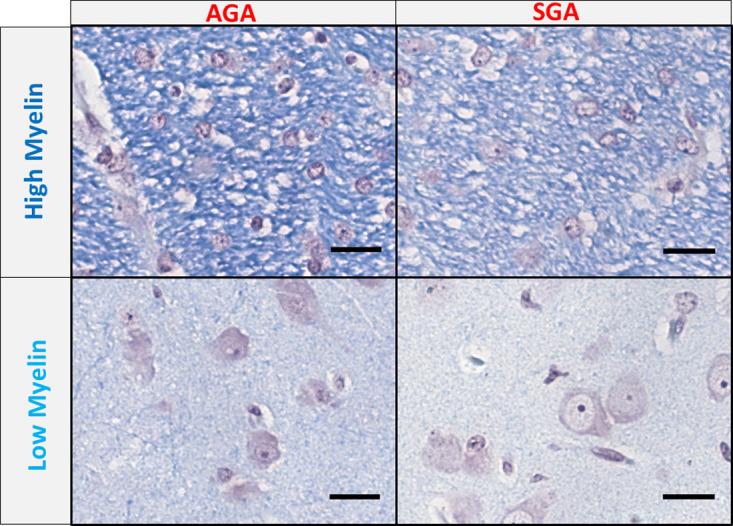
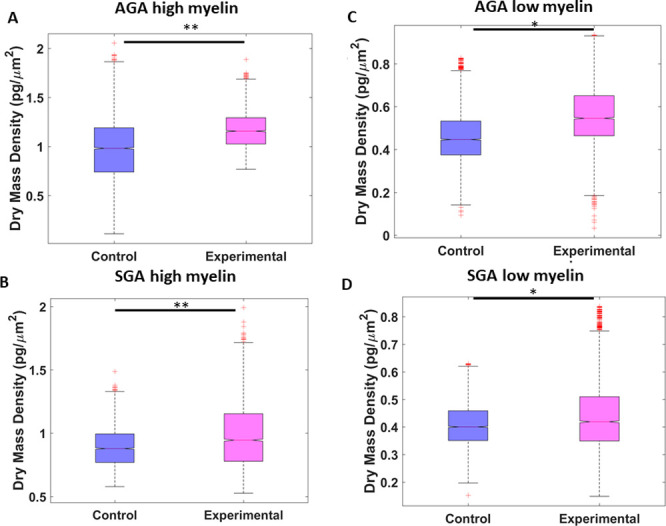
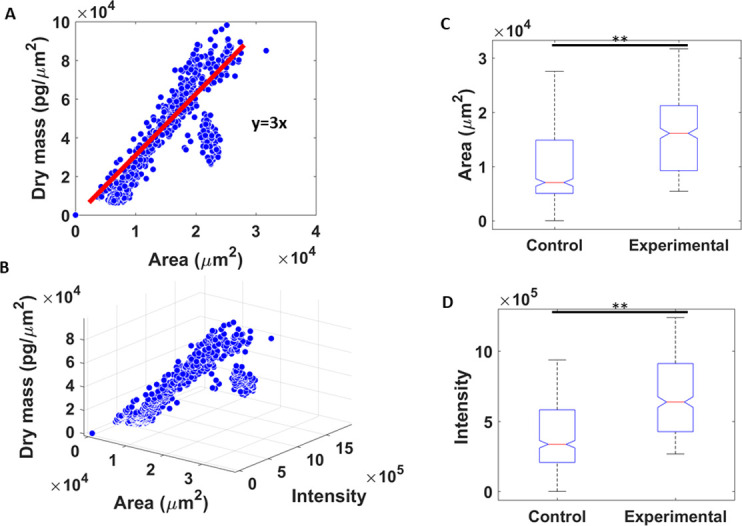
Deficient myelination of the brain is associated with neurodevelopmental delays, particularly in high-risk infants, such as those born small in relation to their gestational age (SGA). New methods are needed to further study this condition. Here, we employ Color Spatial Light Interference Microscopy (cSLIM), which uses a brightfield objective and RGB camera to generate pathlength-maps with nanoscale sensitivity in conjunction with a regular brightfield image. Using tissue sections stained with Luxol Fast Blue, the myelin structures were segmented from a brightfield image. Using a binary mask, those portions were quantitatively analyzed in the corresponding phase maps. We first used the CLARITY method to remove tissue lipids and validate the sensitivity of cSLIM to lipid content. We then applied cSLIM to brain histology slices. These specimens are from a previous MRI study, which demonstrated that appropriate for gestational age (AGA) piglets have increased internal capsule myelination (ICM) compared to small for gestational age (SGA) piglets and that a hydrolyzed fat diet improved ICM in both. The identity of samples was blinded until after statistical analyses.
Conflict of interest statement
I have financial interest in Phi Optics, Inc., a company developing quantitative phase imaging technology for materials and life sciences applications. Tapas Das and Matthew Kuchan are affiliated with Abbott Nutrition, who provided support in the form of salaries and materials for authors C.B-P. and G.P. but did not have any role in data collection or analysis. The specific roles of these authors are articulated in the ‘author contributions’ section. This does not alter our adherence to PLOS ONE policies on sharing data and materials.
Figures
Similar articles
-
Quantitative Histopathology of Stained Tissues using Color Spatial Light Interference Microscopy (cSLIM).Sci Rep. 2019 Oct 11;9(1):14679. doi: 10.1038/s41598-019-50143-x. Sci Rep. 2019. PMID: 31604963 Free PMC article.
-
Hydrolyzed Fat Formula Increases Brain White Matter in Small for Gestational Age and Appropriate for Gestational Age Neonatal Piglets.Front Pediatr. 2020 Feb 12;8:32. doi: 10.3389/fped.2020.00032. eCollection 2020. Front Pediatr. 2020. PMID: 32117837 Free PMC article.
-
A hydrolyzed lipid blend diet promotes myelination in neonatal piglets in a region and concentration-dependent manner.J Neurosci Res. 2023 Dec;101(12):1864-1883. doi: 10.1002/jnr.25243. Epub 2023 Sep 22. J Neurosci Res. 2023. PMID: 37737490
-
Oleic acid (18:1) in plasma, liver and brain myelin lipid of piglets fed from birth with formulas differing in 18:1 content.J Nutr. 1992 Jul;122(7):1521-8. doi: 10.1093/jn/122.7.1521. J Nutr. 1992. PMID: 1619477
-
A correlative light and electron microscopic study of postnatal myelination in the murine corpus callosum.Int J Dev Neurosci. 2008 Oct;26(6):575-84. doi: 10.1016/j.ijdevneu.2008.05.003. Epub 2008 May 15. Int J Dev Neurosci. 2008. PMID: 18556167
Cited by
-
Quantitative phase imaging techniques for measuring scattering properties of cells and tissues: a review-part I.J Biomed Opt. 2024 Jun;29(Suppl 2):S22713. doi: 10.1117/1.JBO.29.S2.S22713. Epub 2024 Jul 18. J Biomed Opt. 2024. PMID: 39026612 Free PMC article. Review.
-
Spatial light interference microscopy: principle and applications to biomedicine.Adv Opt Photonics. 2021 Jun 30;13(2):353-425. doi: 10.1364/AOP.417837. Epub 2021 May 5. Adv Opt Photonics. 2021. PMID: 35494404 Free PMC article.
-
White blood cell detection, classification and analysis using phase imaging with computational specificity (PICS).Sci Rep. 2022 Nov 21;12(1):20043. doi: 10.1038/s41598-022-21250-z. Sci Rep. 2022. PMID: 36414631 Free PMC article.
-
Label-free screening of brain tissue myelin content using phase imaging with computational specificity (PICS).APL Photonics. 2021 Jul 1;6(7):076103. doi: 10.1063/5.0050889. Epub 2021 Jul 12. APL Photonics. 2021. PMID: 34291159 Free PMC article.
-
BlurryScope enables compact, cost-effective scanning microscopy for HER2 scoring using deep learning on blurry images.NPJ Digit Med. 2025 Aug 6;8(1):506. doi: 10.1038/s41746-025-01882-x. NPJ Digit Med. 2025. PMID: 40764388 Free PMC article.
References
-
- Fields RD. White matter matters. Scientific American. 2008;298(3):54–61. - PubMed
-
- Yakovlev P. The myelogenetic cycles of regional maturation of the brain. Regional development of the brain in early life. 1967:3–70.
Publication types
MeSH terms
Grants and funding
LinkOut - more resources
Full Text Sources
Miscellaneous
