. 2020 Nov 24;4(22):5666-5680.
doi: 10.1182/bloodadvances.2020003100.

A new role of glutathione peroxidase 4 during human erythroblast enucleation

Affiliations

A new role of glutathione peroxidase 4 during human erythroblast enucleation

Hakim Ouled-Haddou et al. Blood Adv. .

Abstract

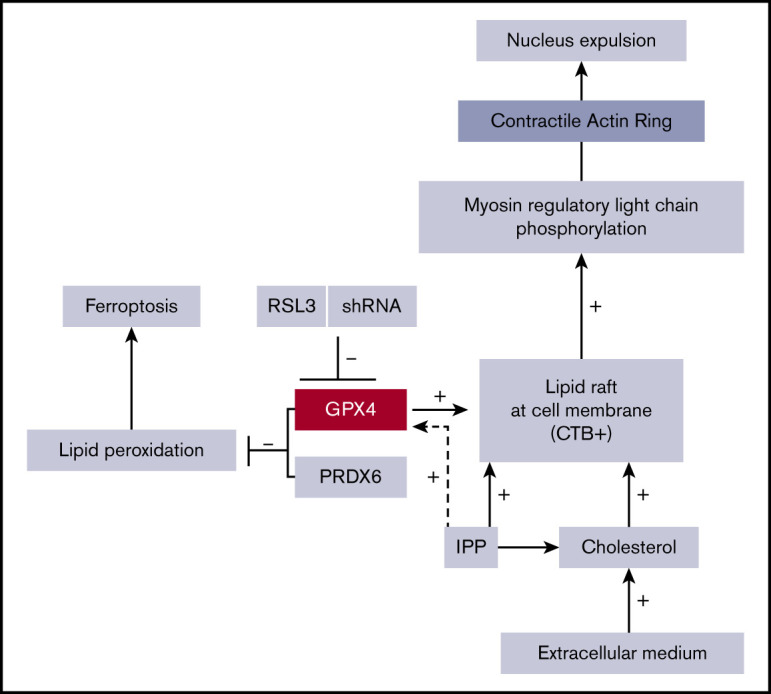
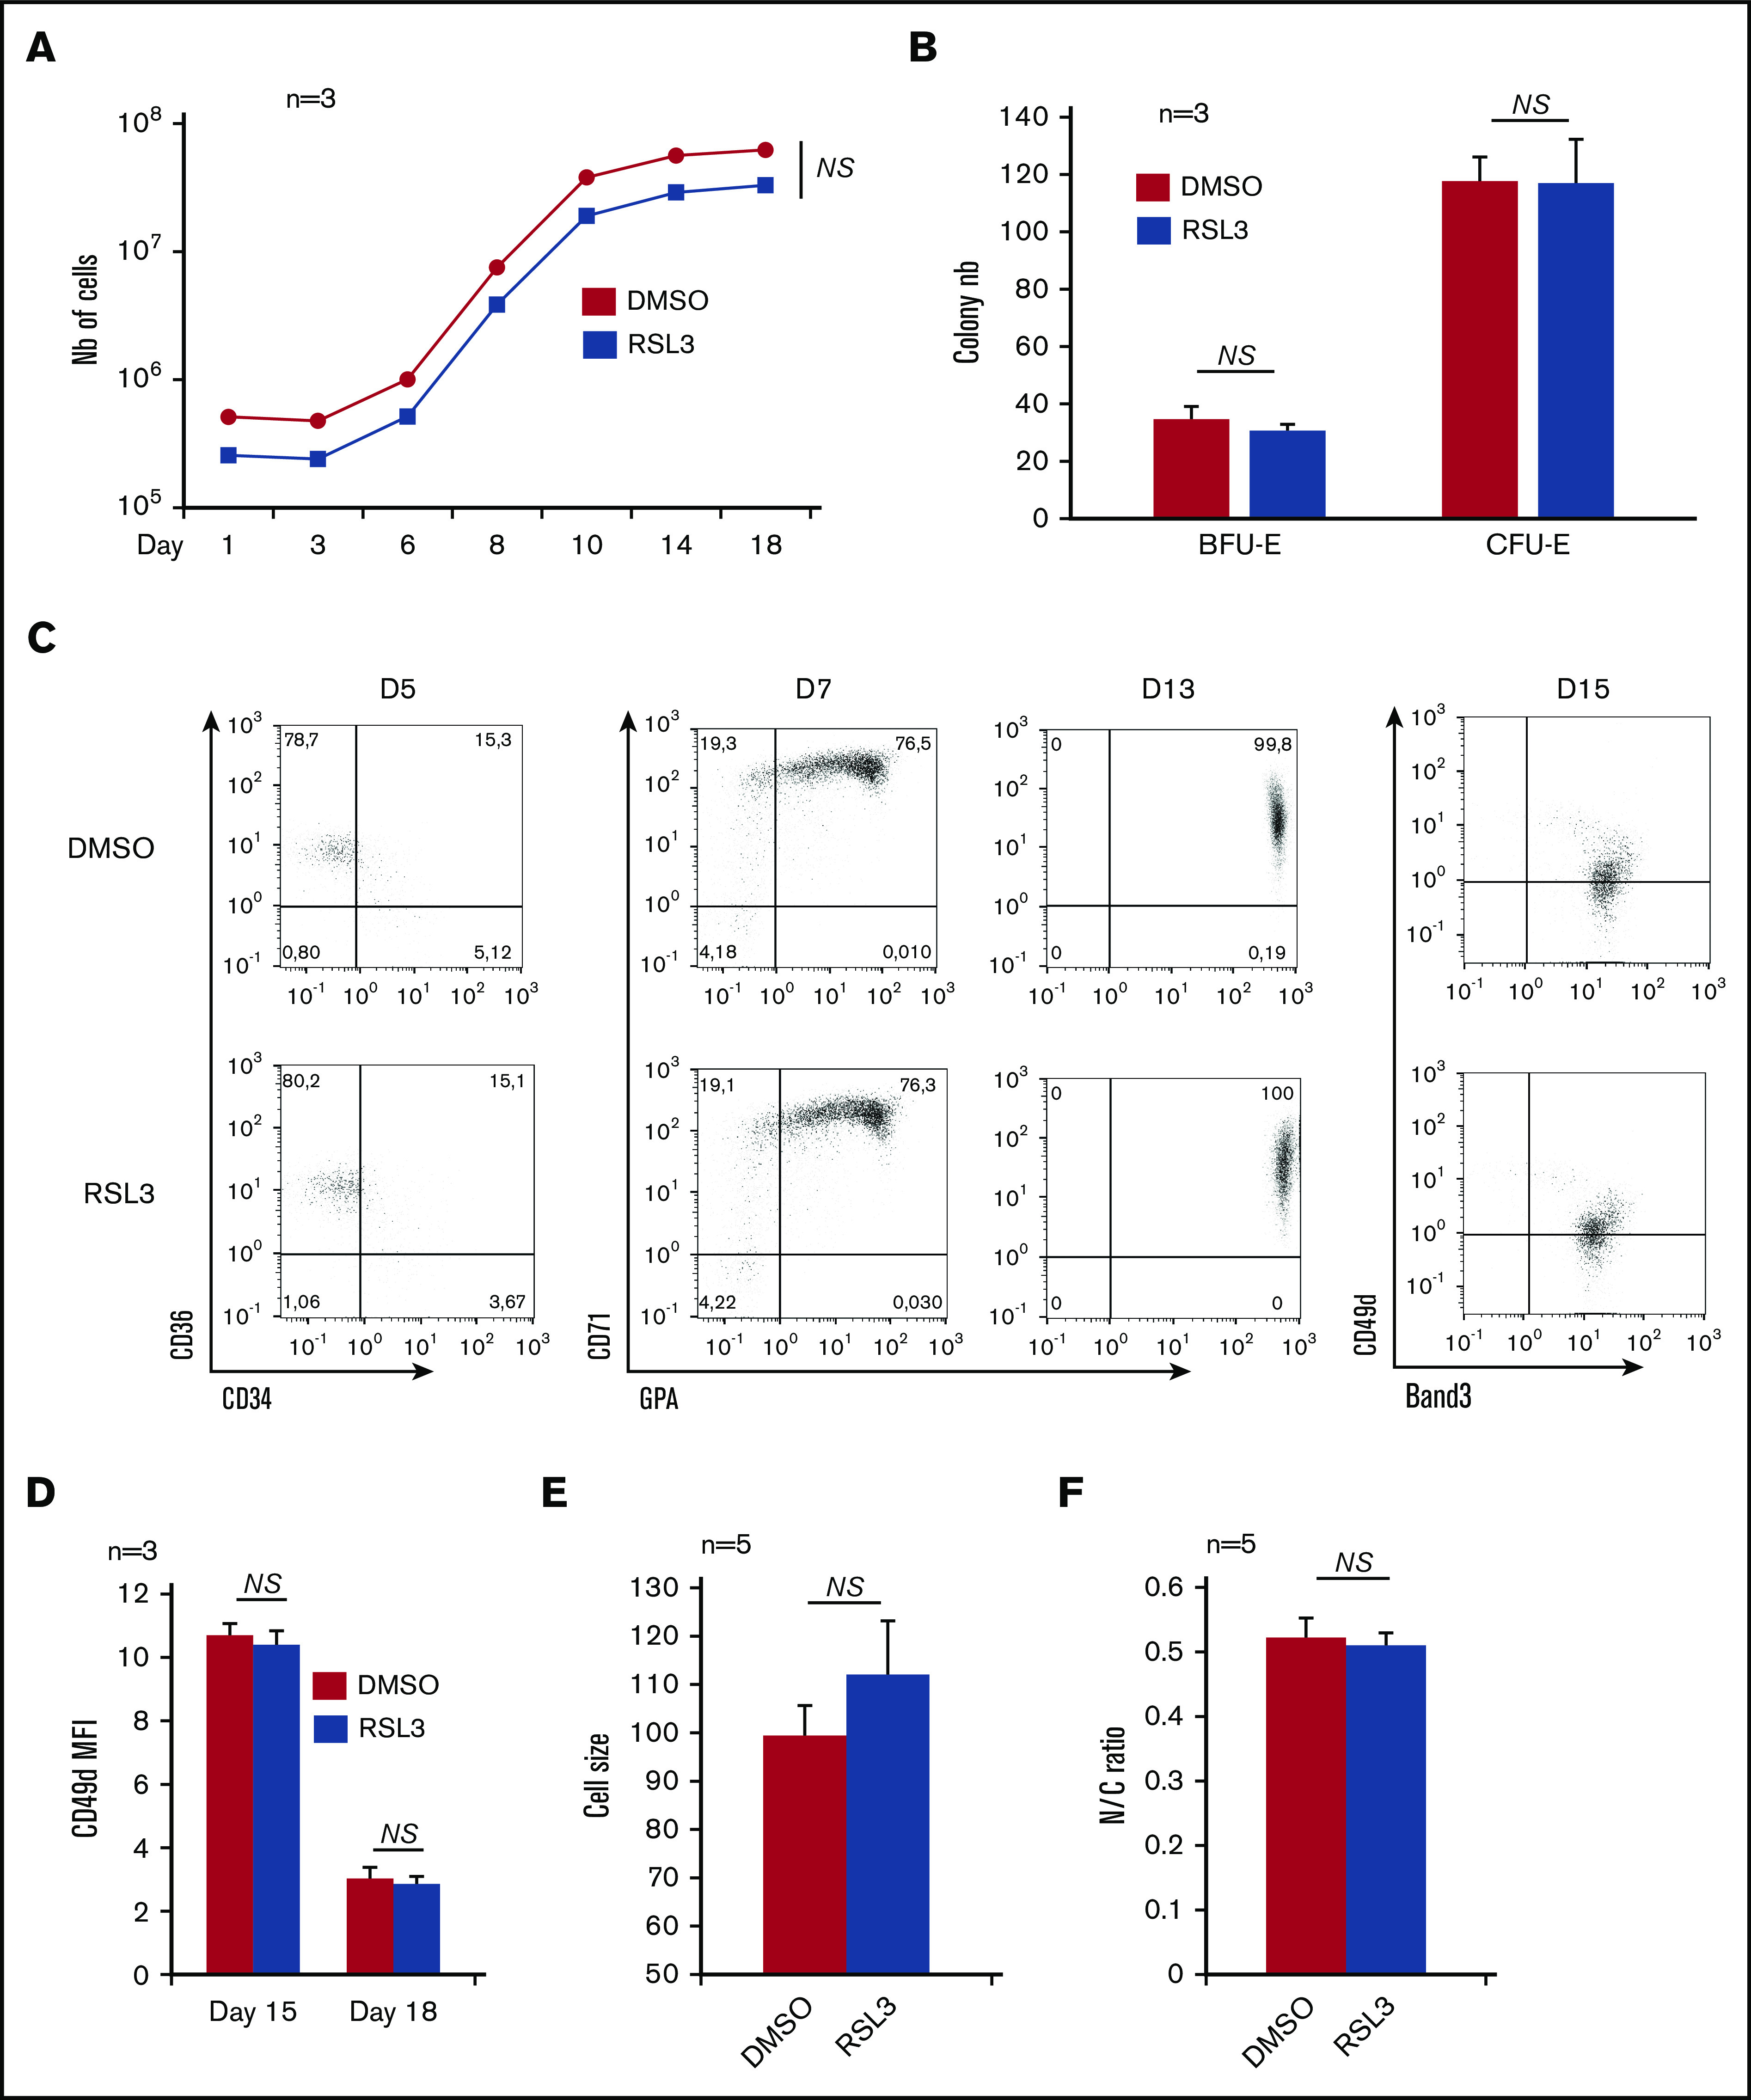
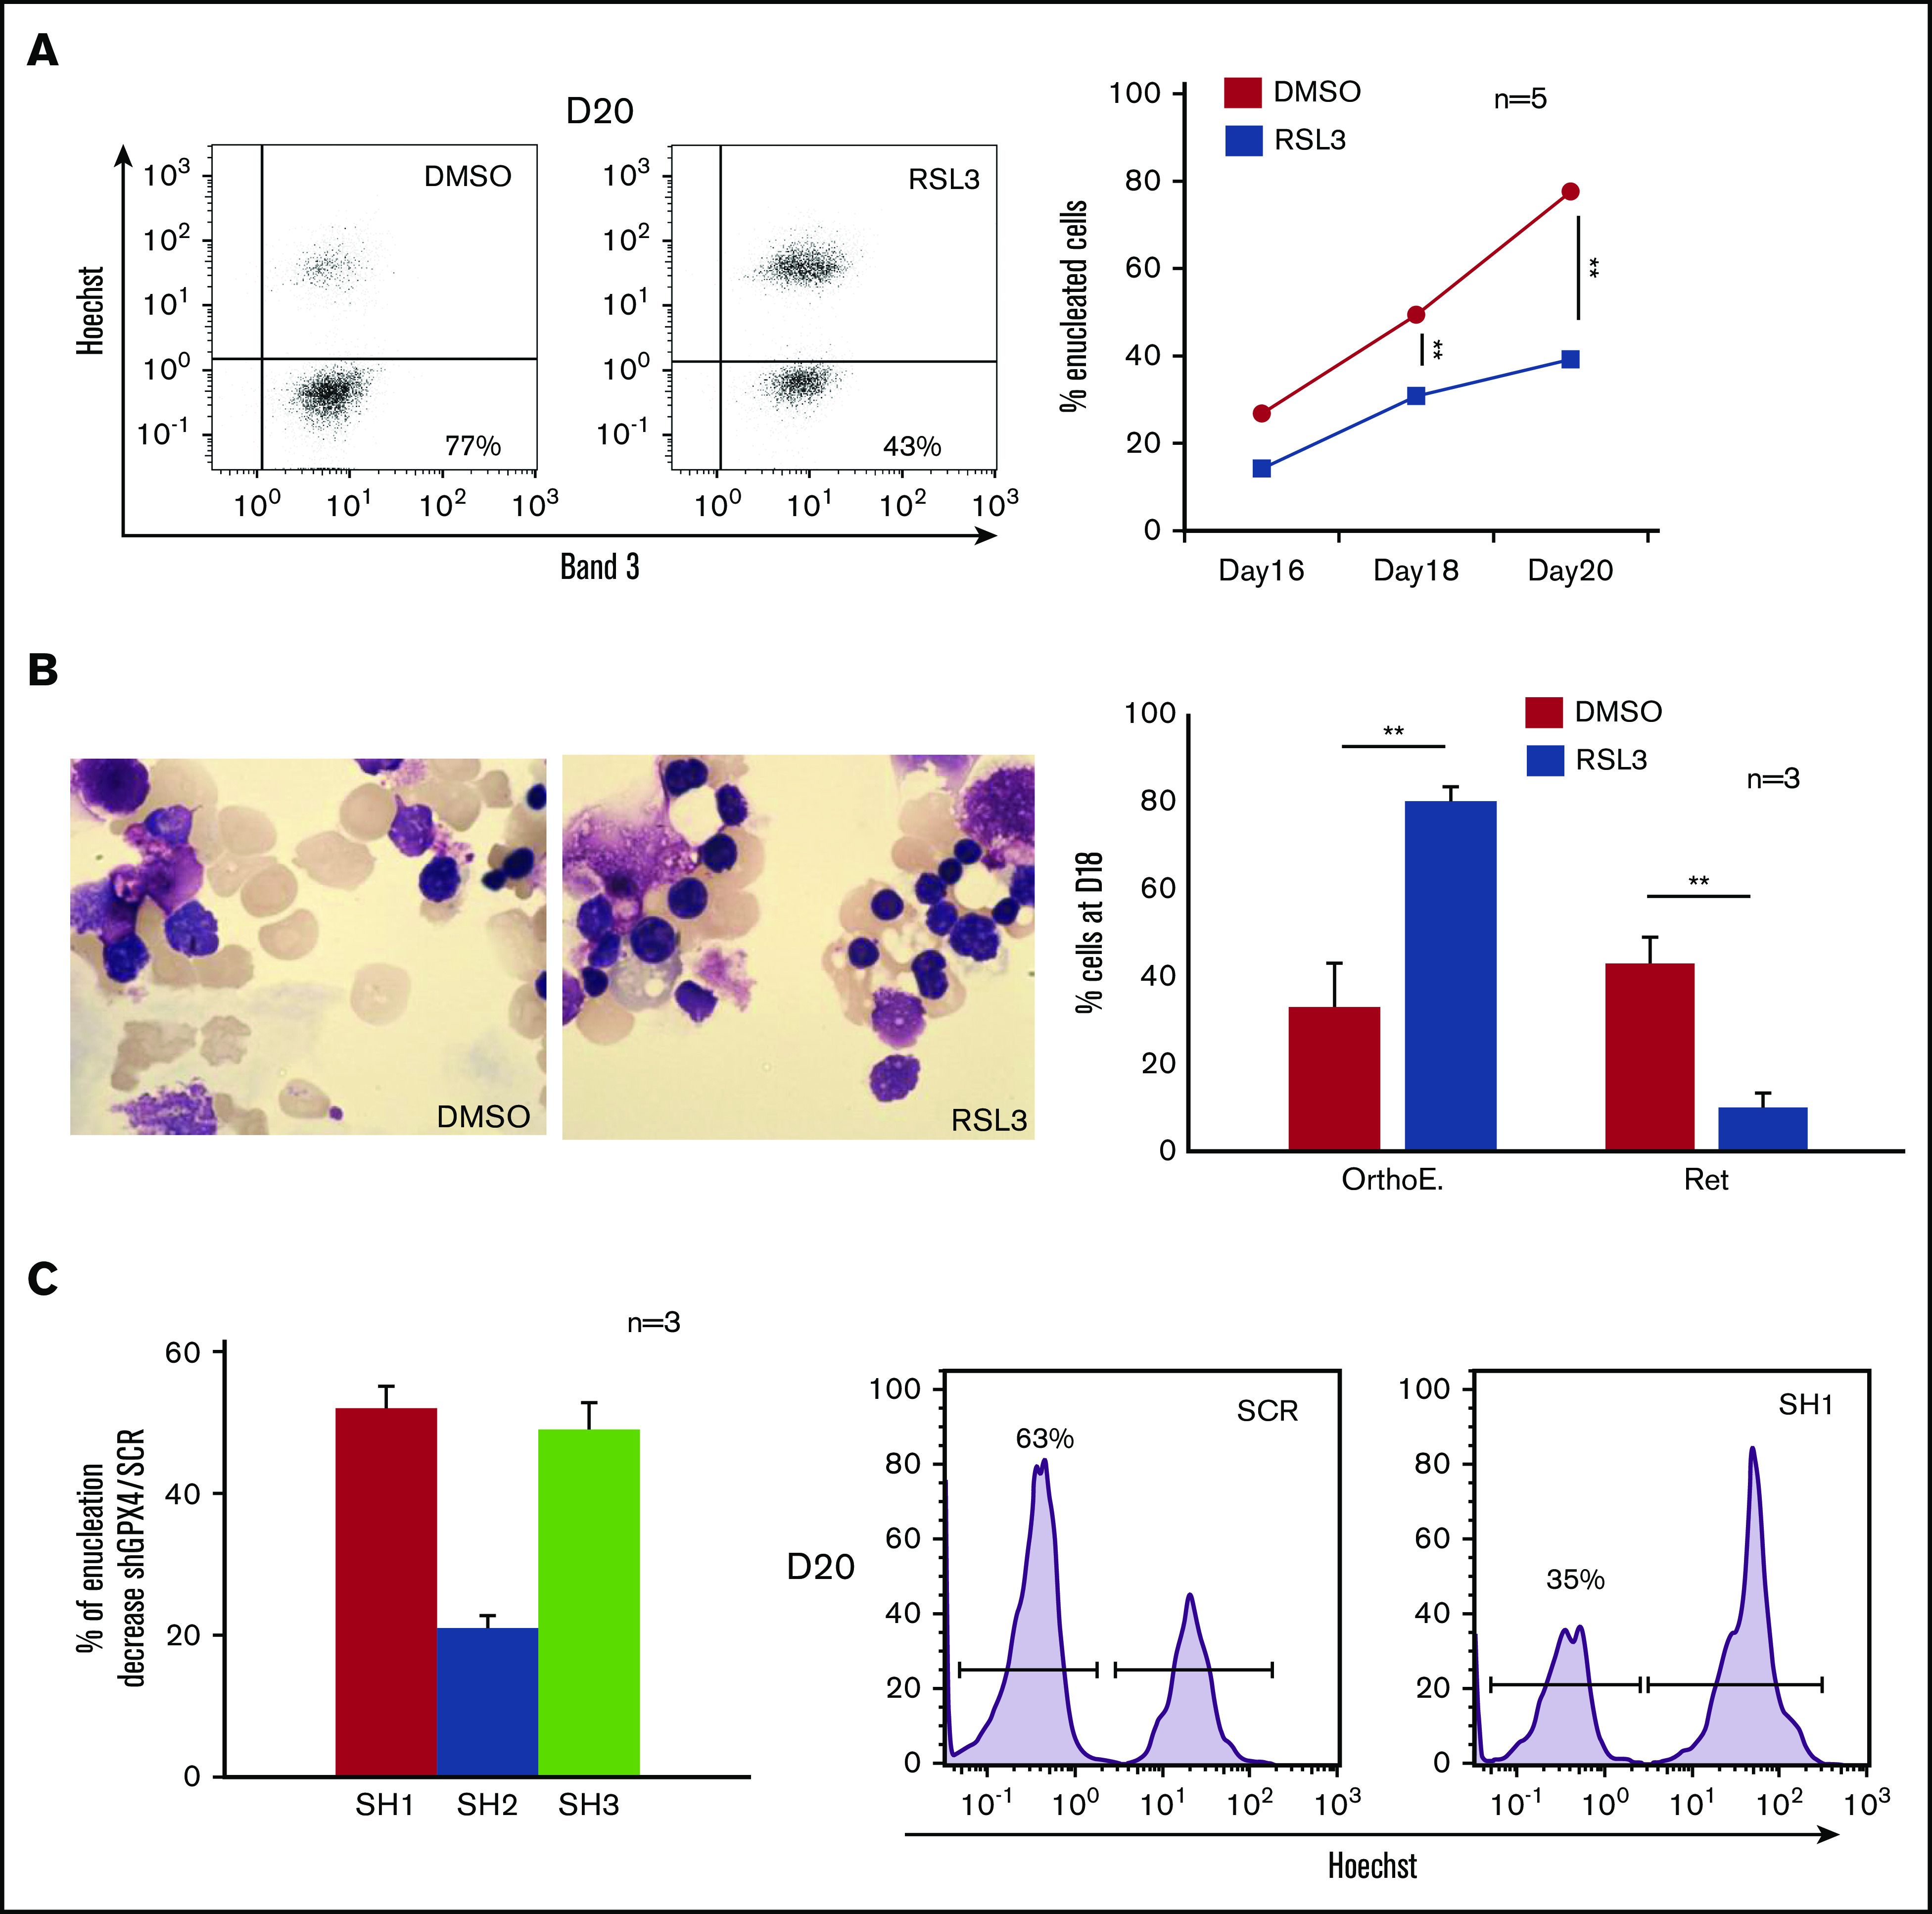
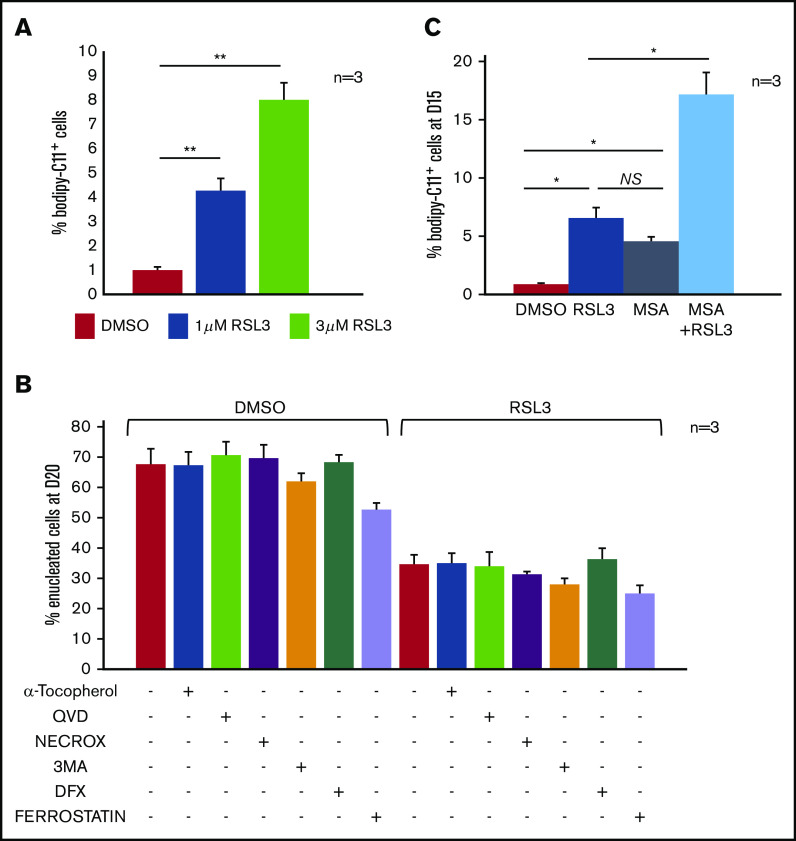
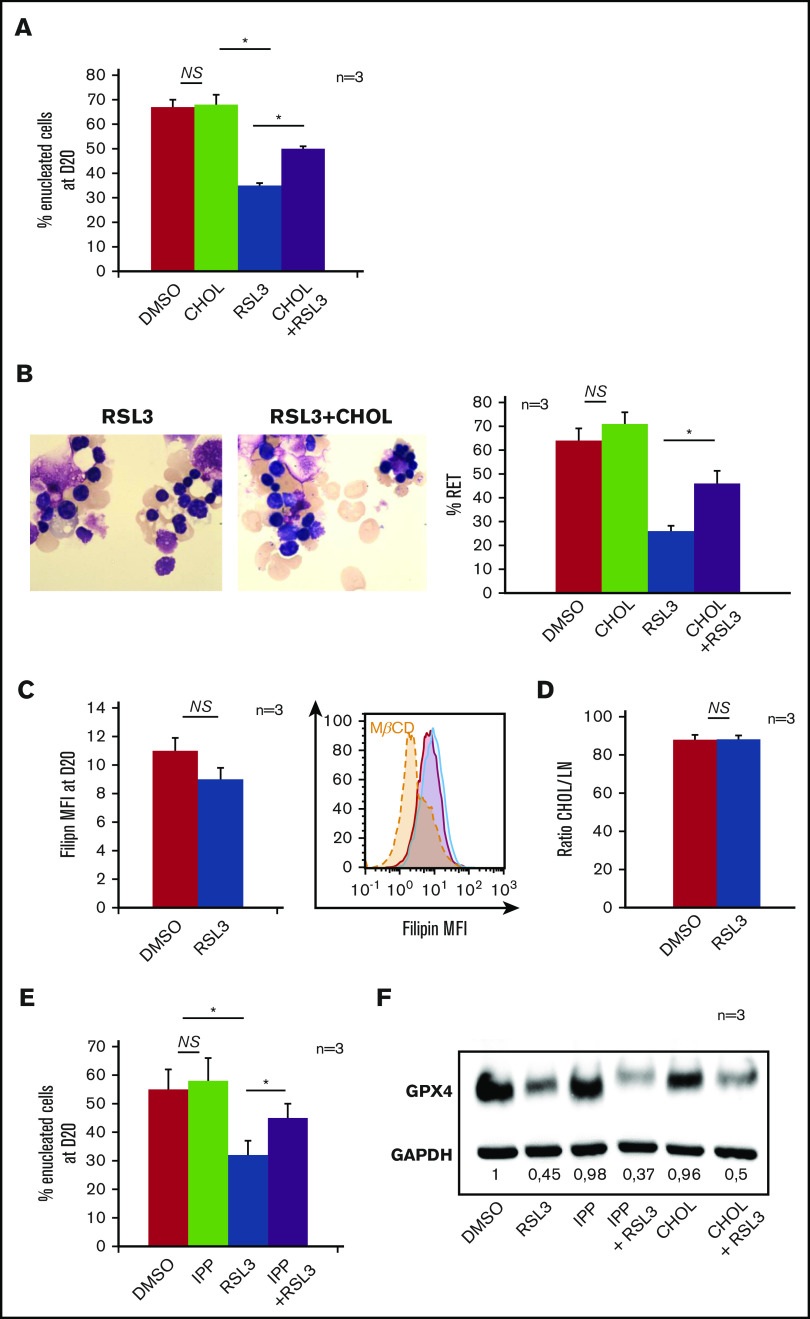
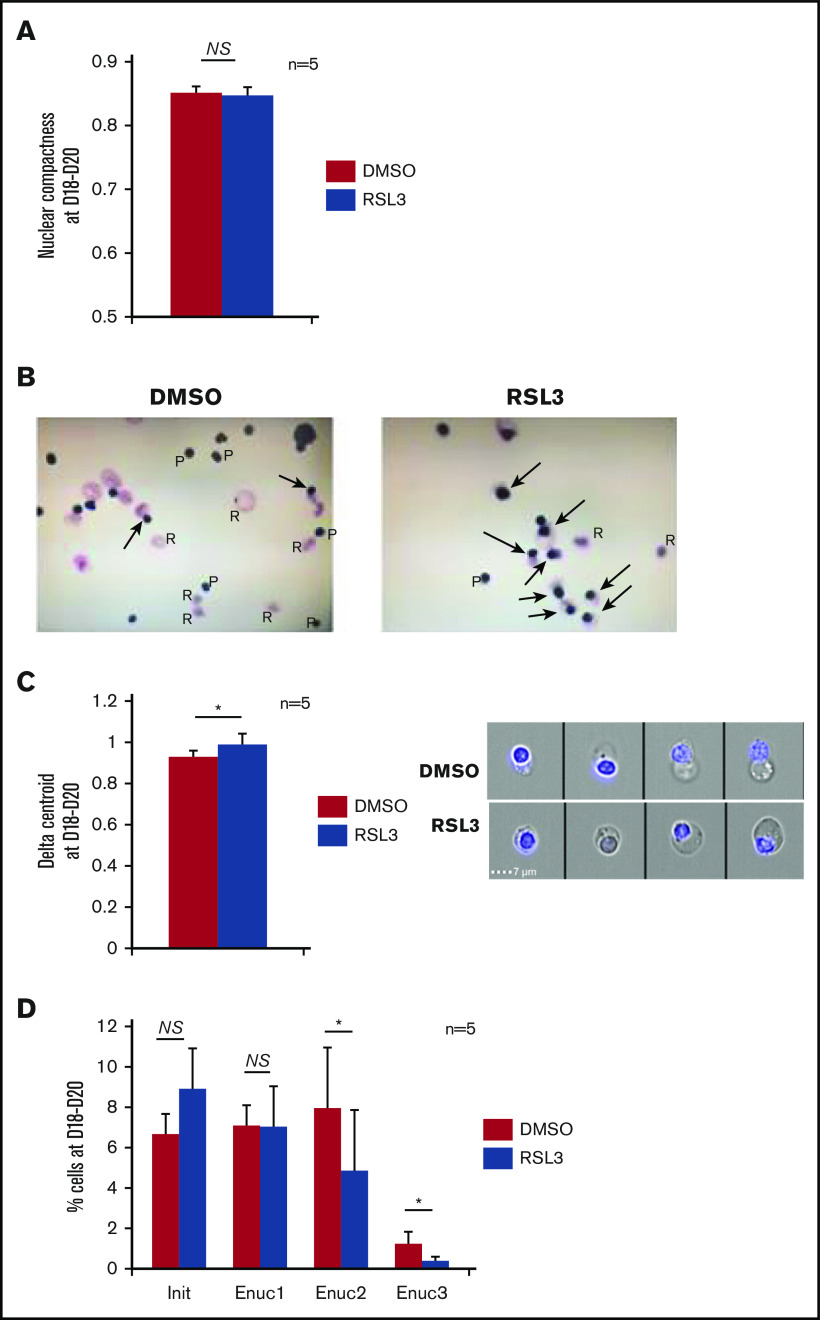
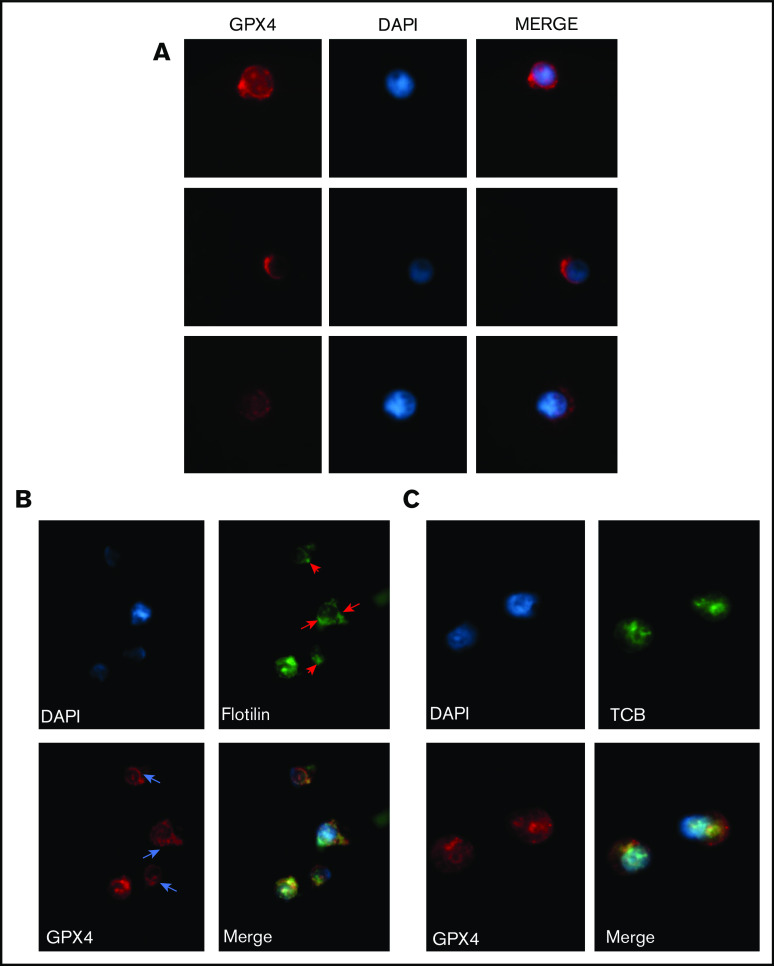
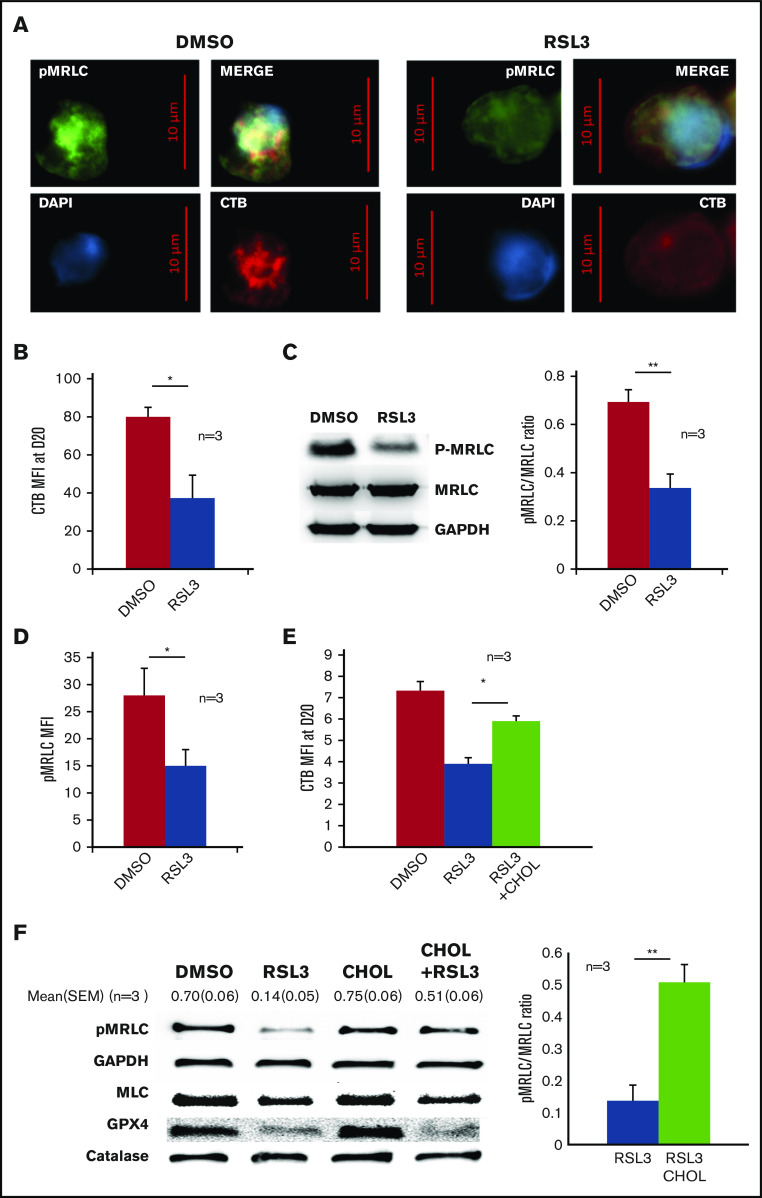
The selenoprotein glutathione peroxidase 4 (GPX4), the only member of the glutathione peroxidase family able to directly reduce cell membrane-oxidized fatty acids and cholesterol, was recently identified as the central regulator of ferroptosis. GPX4 knockdown in mouse hematopoietic cells leads to hemolytic anemia and to increased spleen erythroid progenitor death. The role of GPX4 during human erythropoiesis is unknown. Using in vitro erythroid differentiation, we show here that GPX4-irreversible inhibition by 1S,3R-RSL3 (RSL3) and its short hairpin RNA-mediated knockdown strongly impaired enucleation in a ferroptosis-independent manner not restored by tocopherol or iron chelators. During enucleation, GPX4 localized with lipid rafts at the cleavage furrows between reticulocytes and pyrenocytes. Its inhibition impacted enucleation after nuclear condensation and polarization and was associated with a defect in lipid raft clustering (cholera toxin staining) and myosin-regulatory light-chain phosphorylation. Because selenoprotein translation and cholesterol synthesis share a common precursor, we investigated whether the enucleation defect could represent a compensatory mechanism favoring GPX4 synthesis at the expense of cholesterol, known to be abundant in lipid rafts. Lipidomics and filipin staining failed to show any quantitative difference in cholesterol content after RSL3 exposure. However, addition of cholesterol increased cholera toxin staining and myosin-regulatory light-chain phosphorylation, and improved enucleation despite GPX4 knockdown. In summary, we identified GPX4 as a new actor of human erythroid enucleation, independent of its function in ferroptosis control. We described its involvement in lipid raft organization required for contractile ring assembly and cytokinesis, leading in fine to nucleus extrusion.


Conflict of interest statement

Conflict-of-interest disclosure: The authors declare no competing financial interests.

Figures

None
Graphical abstract
Figure 1.
Figure 1.
Effects of GPX4 inhibition on human in vitro erythropoiesis from CD34+cells to orthochromatic erythroblasts. (A) Effect of GPX4 inhibitor, RSL3 at 1 µM, vs DMSO on cell counts from day 1 to day 18 during in vitro erythroid differentiation from peripheral blood CD34+ cells. Dead cells were excluded using trypan blue staining (n = 3). (B) Effect of GPX4 inhibitor, RSL3 at 1 µM, vs DMSO on clonogenic activity of erythroid progenitors. No differences in BFU-E and CFU-E counts were noticed (n = 3). (C) FCM dot plots assessing erythroid differentiation at early day 5 (CD34/CD36), intermediate day 7 and day 13 (CD71/GPA), and late day 15 (CD49d/Band 3) stages, in DMSO and 1 µM RSL3 conditions. Dot plots were obtained from 1 representative experiment (n = 3). (D-F) Comparative assessment of 3 features of orthochromatic erythroblast maturation between 1 µM RSL3 and DMSO-treated cells: mean fluorescence intensity (MFI) of CD49d assessed by FCM showing its kinetics of decrease between day 15 and day 18 (n = 3) (D), IFC analysis of cell size (E) and nucleocytoplasmic ratio (F), at day 18 to day 20 (depending on the kinetics of differentiation) (n = 5). None of these parameters were statistically different between DMSO and RSL3 conditions. A trend toward a higher cell size after RSL3 exposure was observed, but below significance threshold (P = .09). Statistical significance determined by Student t test. Error bars are SEM. NS, nonsignificant.
Figure 2.
Figure 2.
Enucleation impairment induced by GPX4 inhibition and gene silencing. (A, left) Representative Band 3/Hoechst dot plots obtained at day 20 in GPA+ control and 1 µM RSL3-treated cells using FCM (n = 5). (A, right) Curves showing quantification of enucleated GPA+/Hoechst cells (%) from day 16 to day 20 in 1 µM RSL3 and control treatments (n = 5). Percentage of enucleated cells. DMSO vs RSL3: day 18, 49% ± 4% vs 31% ± 3%, P < .01; day 20, 78% ± 5% vs 39% ± 5%, P < .01. (B, left) May-Grünwald-Giemsa (MGG) staining (magnification ×100) of DMSO or 1 µM RSL3-treated cells. Images shown were taken at day 18 and were representative of 3 independent experiments. (B, right) Cytological count after MGG staining of orthochromatic erythroblasts and reticulocytes (%) in 1 µM RSL3 and control conditions (n = 3). Percentage of RET. DMSO vs RSL3: 43% ± 6% vs 10% ± 3%, P < .01. (C, left) histogram representing the percentage of decrease in day 20 enucleation observed after transduction of 3 different shRNA against GPX4 (SH1, SH2, SH3) in comparison with control (ShSCR) (n = 3). Percentage of enucleation decrease in comparison with SCR. SH1: 52% ± 3%; SH2: 21% ± 2%; SH3: 49% ± 4%, SCR vs each SH: P < .01. (C, right) A representative histogram of Hoechst staining at day 20 in SCR and SH1-transduced cells. **P < .01. Error bars are SEM.
Figure 3.
Figure 3.
Enucleation defect induced by GPX4 inhibition was not related to ferroptosis in human primary erythroblasts. (A) FCM quantification of lipid ROS using 11C-BODIPY581/591 staining in primary erythroblasts treated with RSL3 at 2 concentrations (1 µM and 3 µM) during 12 hours. H2O2 was used as positive control inducing a shift >70% (not shown). RSL3 induced a dose-dependent, statistically significant but weak increase in the percentage of positive cells (n = 3). Percentage of 11C-BODIPY581/591+ cells. DMSO vs 1 µM RSL3: 1% ± 0.1% vs 4% ± 0.5%, P < .05; 1 µM RSL3 vs 3 µM RSL3: 4% ± 0.5% vs 8% ± 0.7%, P < .01. (B) Histogram showing quantification of enucleated GPA+/Hoechst cells (%) at day 20 in DMSO and 1 µM RSL3-treated cells, with and without ferroptosis inhibitors (100 µM α-tocopherol, 2 µM ferrostatin, 5 µM deferoxamine), 20 µM apoptosis inhibitor (QVD), 10 µM necroptosis inhibitor (Necrox), and 5 mM autophagy inhibitor (3MA). There was no statistically significant difference in the enucleation rate between DMSO and all of the different inhibitors tested (n = 3). (C) Induction of membrane lipid peroxidation assessed by FCM and 11C-BODIPY581/591 staining after inhibition of GPX4 using 1 µM RSL3 and inhibition of the GPX activity of PRDX6 using 40 µM MSA (n = 3). DMSO vs RSL3 and MSA, P < .05; RSL3 vs MSA, P: NS; RSL3 or MSA vs RSL3 + MSA, P < .05. *P < .05; **P < .01. Error bars are SEM.
Figure 4.
Figure 4.
Mevalonate pathway molecules partially reverted the enucleation defect induced by GPX4 inhibition. (A) FCM histogram showing quantification of enucleated day 20 GPA+/Hoechst cells treated with DMSO or 1 µM RSL3, with and without adding 10 μM cholesterol (CHOL) at day 14 in the culture medium (n = 3). Percentage of enucleated cells. RSL3 vs RSL3 + CHOL, 35% ± 1% vs 50% ± 1.6%, P < .01. (B, left) Day 20 MGG staining (magnification ×100) of DMSO, 10 µM CHOL, 1 µM RSL3 and RSL3 + CHOL conditions. (B, right) MGG staining count of orthochromatic erythroblasts and reticulocytes (%) (n = 3). Percentage of RET. RSL3 vs RSL3 + cholesterol: 26% ± 4% vs 46% ± 6%, P < .05. (C) Day 20 cholesterol quantification in RSL3- and DMSO-treated cells using filipin staining on FCM after cell fixation. Left, Filipin MFI DMSO vs 1 µM RSL3: 11 ± 0.9 vs 9 ± 0.2, n = 3, P = NS. Right, A representative histogram of 3 independent experiments; methyl-β-cyclodextrin (MBCD) was used as a control of cholesterol depletion. (D) Left, Histogram showing quantification of cholesterol/total neutral lipids ratio measured by the gas chromatography with flame-ionization detection method as described in “Methods” and normalized by protein quantity in day 20 erythroblasts (n = 3). Percentage of CHOL/NL DMSO vs 1 µM RSL3: 87.9% ± 2.6% vs 88.2% ± 2%, n = 3, P = NS. (E) Histogram showing FCM quantification of enucleated day 20 GPA+/Hoechst cells treated with DMSO or 1 µM RSL3, with and without 5 µM IPP, at day 20 (n = 3). IPP partially restored the enucleation defect induced by RSL3. Percentage of enucleated cells RSL3 vs RSL3 + IPP: 31% ± 5% vs 45% ± 5%, P < .05. (F) Representative immunoblot from 3 independent experiments showing that the 1 µM RSL3-related GPX4 knockdown at the protein level was not reverted by 10 µM cholesterol or 5 µM IPP. Numbers represent mean GPX4/GAPDH ratio of each condition relative to DMSO (n = 3). *P < .05. Error bars are SEM.
Figure 5.
Figure 5.
Enucleation impairment induced by GPX4 inhibition occurred after nucleus condensation and polarization. (A) IFC analysis of nuclear compactness in GPA+/Hoechst+ day 18 to day 20 erythroblasts (performed when enucleation reached 50% in controls) treated with DMSO or 1 µM RSL3 (n = 5). To measure nuclear compactness, we used the dedicated compactness feature from IDEAS software applied on the nuclear image channel 01 as identified by Hoechst staining. Briefly, it reveals the degree of how well the object is packed together: the higher the value, the more condensed is the object. (B) MGG staining (magnification ×40) showing nucleus polarization in DMSO and 1 µM RSL3 conditions in day 18 to day 20 erythroblasts (arrow shows polar nucleus in orthochromatic erythroblasts; pyrenocytes [P], reticulocytes [R]). (C) Left, IFC measuring δ centroid in GPA+/Hoechst+ erythroblasts treated with DMSO or 1 µM RSL3 (n = 5). δ centroid indicates the eccentricity level of the nucleus inside cell. Right, A representative IFC image showing OrthoE-polarized nucleus in DMSO and 1 µM RSL3 conditions. δ centroid DMSO vs RSL3: 0.93 ± 0.03 vs 0.99 ± 0.05, P < .05. (D) IFC analysis and quantification (%) of GPA+/Hoechst+ erythroblasts at different enucleation steps in DMSO or 1 µM RSL3 conditions (n = 5). Gates of the successive steps in nucleus polarization and extrusion are defined and detailed in supplemental Figure 6. Briefly, Init corresponded to initiation of polarization with loss of the central position. Enuc 1 to 3 corresponds to progressive increase of the nucleus δ centroid associated with a decrease in the Brightfield aspect ratio, Enuc 3 corresponding to extruding nuclei. Percentage of Enuc2. DMSO vs RSL3: 7.9% ± 3% vs 4.8% ± 3.6%, P < .05; % Enuc 3: 1.2% ± 0.6% vs 0.4 ± 0.2 ±: P < .05. *P < .05. Error bars are SEM.
Figure 6.
Figure 6.
GPX4 had a perinuclear distribution during enucleation and localized with lipid raft markers flotillin and cholera toxin b subunit. (A) Representative image of AlexaFluor 647–conjugated GPX4 immunolabeling and DAPI staining during erythroblast enucleation (n = 3). These images were taken at day 15 of differentiation at 60× original magnification used with oil immersion. (B-C) Representative image of DAPI staining and AlexaFluor 647–conjugated GPX4 and AlexaFluor 488–conjugated Flotillin-2 immunolabeling (B) or AlexaFluor 647–conjugated GPX4 and AlexaFluor 488–conjugated CTB immunolabeling (C) on day 15 at the beginning of enucleation at 60× magnification used with oil immersion (n = 3).
Figure 7.
Figure 7.
GPX4 inhibition led to disruption of lipid rafts at cleavage furrow and to decrease in myosin phosphorylation that was partially restored by cholesterol. (A) Representative image of DAPI, AlexaFluor 488–conjugated pMRLC, AlexaFluor 647–conjugated CTB staining using fluorescence microscopy in DMSO and 1 µM RSL3-treated cells at day 18 (n = 3). (B) Histogram showing the significant decrease in CTB MFI measured by FCM at day 20 in 1 µM RSL3-treated erythroblasts in comparison with DMSO (n = 3). Mean MFI: 80 ± 5 (DMSO) vs 37 ± 12 (RSL3), P < .05. (C, left) Representative pMRLC immunoblot of erythroblasts treated with DMSO or 1 µM RSL3 during the enucleation stage at day 18. (C, right) Quantification of the decrease in pMRLC induced by 1 µM RSL3 exposure, using the pMRLC/MRLC vs GAPDH ratio (n = 3): 0.69 ± 0.05 vs 0.34 ± 0.06; P < .001. (D) Histogram showing MFI of pMRLC, measured by FCM in fixed and permeabilized erythroblasts in DMSO and 1 µM RSL3 conditions, during the enucleation stage (n = 3). P < .05. (E) Addition of 10 µM cholesterol at day 14 corrected the CTB decrease induced by RSL3 exposure, as assessed by FCM (n = 3). Day 20 erythroblasts, CTB MFI RSL3 vs RSL3 + CHOL: 3.9 ± 0.3 vs 5.9 ± 0.2, P < .05. (F, left) Representative pMRLC and GPX4 immunoblot of erythroblasts treated with DMSO or 1 µM RSL3, with and without 10 µM cholesterol, during the enucleation stage (n = 3). Catalase, MRLC, and GAPDH were used as load controls. (B, right) Densitometric pMRLC/MRLC vs GAPDH ratio between RSL3 and RSL3 + CHOL from 3 independent experiments: 0.137 ± 0.05 vs 0.507 ± 0.06, P < .001. *P < .05; **P < .01. Error bars are SEM.

References

    1. Yant LJ, Ran Q, Rao L, et al. . The selenoprotein GPX4 is essential for mouse development and protects from radiation and oxidative damage insults. Free Radic Biol Med. 2003;34(4):496-502. - PubMed
    1. Forcina GC, Dixon SJ. GPX4 at the crossroads of lipid homeostasis and ferroptosis. Proteomics. 2019;19(18):e1800311. - PubMed
    1. Dixon SJ, Lemberg KM, Lamprecht MR, et al. . Ferroptosis: an iron-dependent form of nonapoptotic cell death. Cell. 2012;149(5):1060-1072. - PMC - PubMed
    1. Hirschhorn T, Stockwell BR. The development of the concept of ferroptosis. Free Radic Biol Med. 2019;133:130-143. - PMC - PubMed
    1. Yang WS, SriRamaratnam R, Welsch ME, et al. . Regulation of ferroptotic cancer cell death by GPX4. Cell. 2014;156(1-2):317-331. - PMC - PubMed

Publication types

Substances