. 2020 Dec 2;48(21):12016-12029.
doi: 10.1093/nar/gkaa1049.

RiboDiPA: a novel tool for differential pattern analysis in Ribo-seq data

Affiliations

RiboDiPA: a novel tool for differential pattern analysis in Ribo-seq data

Keren Li et al. Nucleic Acids Res. .

Abstract

Ribosome profiling, also known as Ribo-seq, has become a popular approach to investigate regulatory mechanisms of translation in a wide variety of biological contexts. Ribo-seq not only provides a measurement of translation efficiency based on the relative abundance of ribosomes bound to transcripts, but also has the capacity to reveal dynamic and local regulation at different stages of translation based on positional information of footprints across individual transcripts. While many computational tools exist for the analysis of Ribo-seq data, no method is currently available for rigorous testing of the pattern differences in ribosome footprints. In this work, we develop a novel approach together with an R package, RiboDiPA, for Differential Pattern Analysis of Ribo-seq data. RiboDiPA allows for quick identification of genes with statistically significant differences in ribosome occupancy patterns for model organisms ranging from yeast to mammals. We show that differential pattern analysis reveals information that is distinct and complimentary to existing methods that focus on translational efficiency analysis. Using both simulated Ribo-seq footprint data and three benchmark data sets, we illustrate that RiboDiPA can uncover meaningful pattern differences across multiple biological conditions on a global scale, and pinpoint characteristic ribosome occupancy patterns at single codon resolution.


Figures

Figure 1.
Figure 1.
RiboDiPA package workflow. Input for the RiboDiPA package are: (A) the Genome Transfer File (GTF) of the experimental organism and (B) Ribo-seq alignment files in BAM format with one file per replicate. All exons, 5′UTR(s), and 3′UTR(s) from the same gene are concatenated to form a total transcript. RPFs are parsed and the P-site position is calculated for each RPF. (C) Mapped P-site data representing the P-site frequency at each nucleotide position along the total transcript (left) and the binned P-site data with customizable bin width (right). (D) Flow of differential pattern analysis and output of RiboDiPA including P-value, q-value and T-value for each gene under testing. For users’ convenience, the package also provides more options for adjusted P-value and complementary measure.
Figure 2.
Figure 2.
Ribosome profiling data show examples of genes with differences in ribosome occupancy patterns, but similar abundance of RPFs. Plotted are the ribosome profiling data for two example genes from yeast (62), TCB3 (A) and ACB1 (B) with two replicates in unstressed conditions (blue) and under oxidative stress (red). Both TCB3 and ACB1 do not show a significant difference in the abundance of RPFs between conditions (via the DA test defined in text), but ACB1 shows clear pattern difference of ribosome occupancy across conditions, whereas TCB3 does not. For each panel, the distribution unbinned RPF counts mapped to P-site is shown on the left and the binned data on the right.
Figure 3.
Figure 3.
Differential pattern (DP) versus differential abundance (DA) analysis. The data shown compare WT unstressed yeast cells and WT cells responding to oxidative stress from (62). (A) Scatter plots of average Ribo-seq read counts in each condition for genes with DP and (B) without DP (at q-value ≤ 0.05). (C) Table for number of genes tested significant/insignificant in DP/DA analysis. Among 5746 genes analyzed, 5250 genes had no differential pattern (of which 5210 were DA negative), however 496 genes had a significant differential pattern (of which 478 were DA negative). Panels (D) and (E) present the P-site footprints before (left) or after (right) binning, with WT unstressed replicates in blue and WT oxidative stress in red. The large change in pattern in (E) is reflected in a larger T-value relative to (D), and shows that T-value can be used as a supplementary measure to identify genes with larger pattern differences beyond statistical significance measure P-value or q-value. Bins colored in black are those having significant adjusted P-value ≤0.05 in the DP test.
Figure 4.
Figure 4.
DP analysis shows global differences in translational activities between conditions. Plotted are (A) the empirical cumulative distribution function (ECDF) of P-value for DP analysis for five different comparisons of stress conditions from (62), and (B) the corresponding number of discoveries under different q-value threshold values for each comparison.
Figure 5.
Figure 5.
RiboDiPA for single-codon resolution DP analysis: eRF1 depletion (A) Comparison of WT unstressed yeast cells versus eRF1 depletion strain (unstressed) from (62) shows significant enrichment of P-sites at the –12 and –2 codon position in the eRF1d cells (stop codon defined as -1 position), while no significant differential pattern is present around the start codon. Plotted in the vertical axis is the number of genes that have adjusted P-value ≤0.05 at each given codon, with positive direction for enrichment in eRF1d, and negative direction for depletion. Panels (B) and (C) show two example genes, SUI3, an eIF2β homolog, and TEF2, an eEF1A homolog respectively. Wild type data is shown in blue, while eRF1d data is shown in red, with significantly different bins highlighted in black. (D) Distribution of stop codons for DP genes in eRF1d data and for all yeast genes respectively. (E) Analysis of the positions in the vicinity of the stop codon in eRF1d DP genes shows no enrichment for particular sequences. Sequences are represented as a pLogo plot, with a log-odds score of ±3.28 representing enrichment or depletion with P-value ≤0.05. (F) GO term analysis found that the term ‘formation of translation preinitiation complex (GO:0001731)’ was enriched in DP genes (red), with eight out of a possible thirteen genes in yeast represented. Gene names and homologs, if known, are listed. (G) The GO term ‘translation reinitiation (GO:0002188)’ was also enriched, with six out of six genes annotated in yeast represented.
Figure 6.
Figure 6.
RiboDiPA for single-codon resolution DP analysis: NEW1 deletion (A) Single-codon DP analysis of data from (63), comparing wild type yeast to a NEW1 deletion strain at 20°C. Counts of genes that show DP at a particular codon near the start or stop codon are plotted, with genes with a positive log fold change in the new1Δ condition relative to the WT condition in red, and negative log fold change in cyan. (B, C) Binned RPF counts mapped to P-sites in wild type (blue) and new1Δ (red), shown as a representative examples of genes affected by NEW1 deletion for Triose phosphate isomerase (TPI1) and Guanylate kinase (GUK1) respectively. Positions with significant changes in pattern are labeled in black. (D) For DP genes in the new1Δ condition, the amino acid position immediately upstream of the stop codon was strongly enriched for lysine, arginine, and asparagine, as visualized by pLogo analysis, compared to the same positions for all genes in yeast genome-wide. Sequences exceeding a log-odds score of ±3.60 represent enrichment or depletion with P-value ≤0.05. (E) pLogo analysis revealed no enrichment in particular amino acids for genes called by single-codon DP analysis in the eRF1 depletion condition.
Figure 7.
Figure 7.
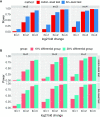
Simulation I results. (A) Power comparisons between binned and unbinned data (codon-level) in the simulation at nominal FDR level 0.05. (B) Power comparisons between groups of genes with 10formula image and 20formula image differential codons. The log2 fold change (lfc) of relative means between conditions of the true positive set was varied from 1 to 3, the number of biological replicates (m) was varied from 2 to 4. The presented results were averaged over ten repeated simulations.

Similar articles

Cited by

References

    1. Sokabe M., Fraser C.S.. Toward a kinetic understanding of eukaryotic translation. CSH Perspect. Biol. 2019; 11:a032706. - PMC - PubMed
    1. Dever T.E., Dinman J.D., Green R.. Translation elongation and recoding in eukaryotes. CSH Perspect. Biol. 2018; 10:a032649. - PMC - PubMed
    1. Tahmasebi S., Khoutorsky A., Mathews M.B., Sonenberg N.. Translation deregulation in human disease. Nat. Rev. Mol. Cell. Biol. 2018; 19:791–807. - PubMed
    1. Robichaud N., Sonenberg N., Ruggero D., Schneider R.J.. Translational control in cancer. CSH Perspect. Biol. 2019; 11:a032896. - PMC - PubMed
    1. Green R., Noller H.F.. Ribosomes and translation. Annu. Rev. Biochem. 1997; 66:679–716. - PubMed

Publication types