. 2020 Nov 25;183(5):1436-1456.e31.
doi: 10.1016/j.cell.2020.10.036. Epub 2020 Nov 18.

Proteogenomic Landscape of Breast Cancer Tumorigenesis and Targeted Therapy

Collaborators, Affiliations

Proteogenomic Landscape of Breast Cancer Tumorigenesis and Targeted Therapy

Karsten Krug et al. Cell. .

Abstract

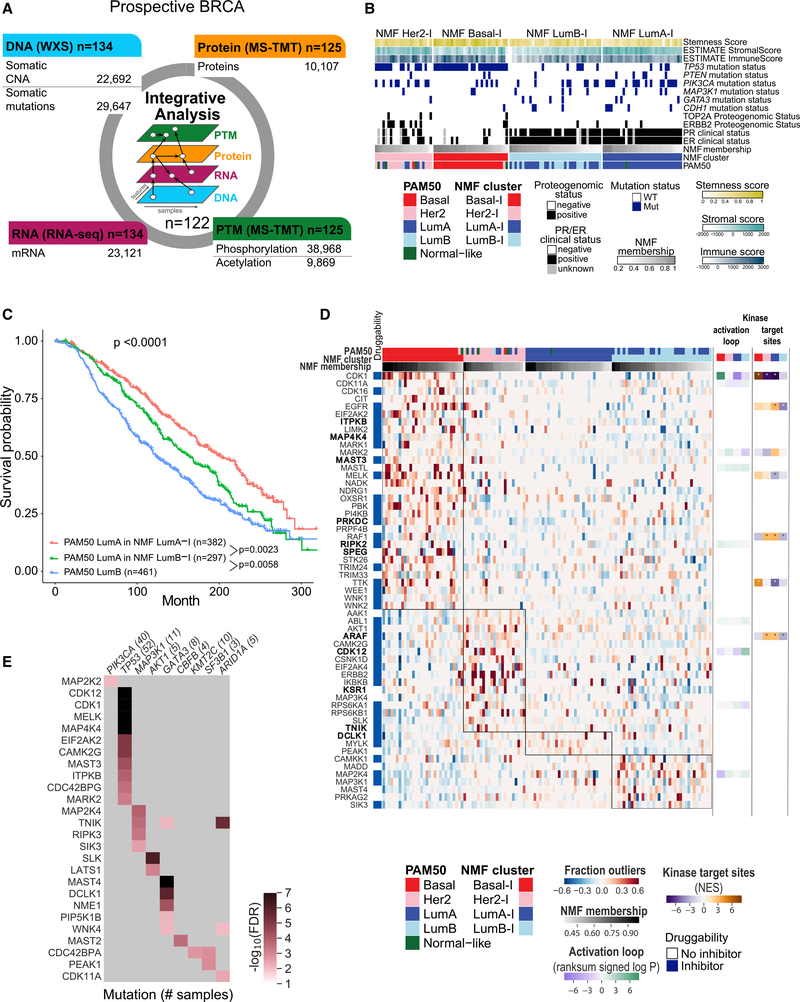
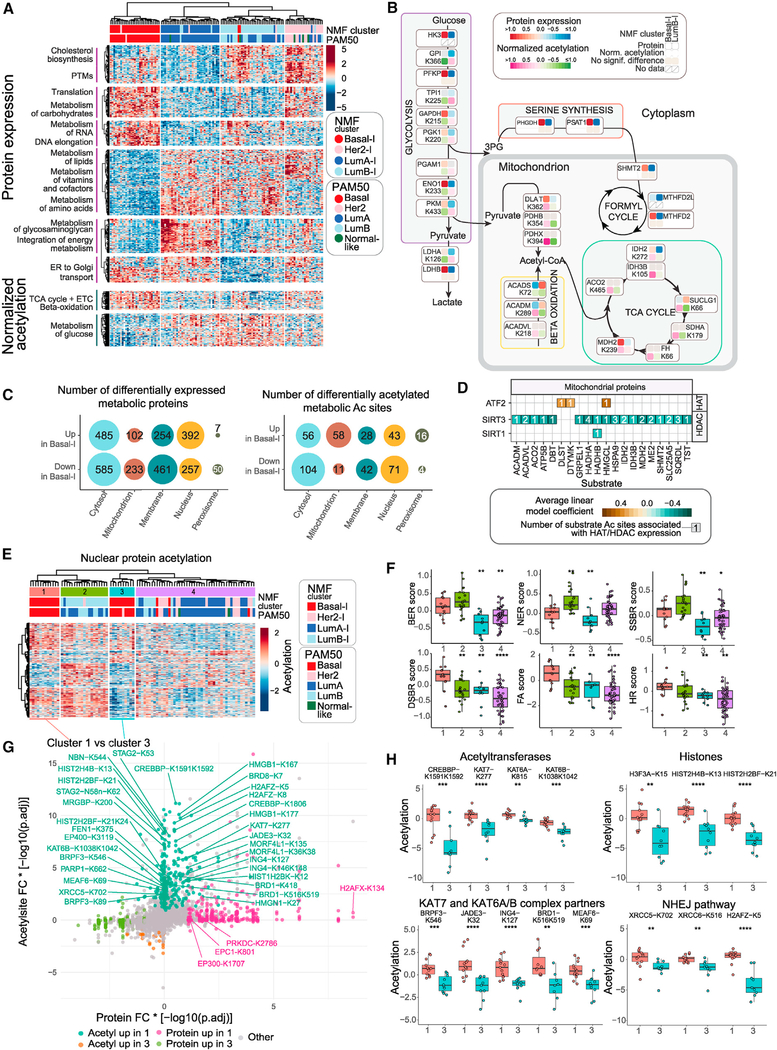
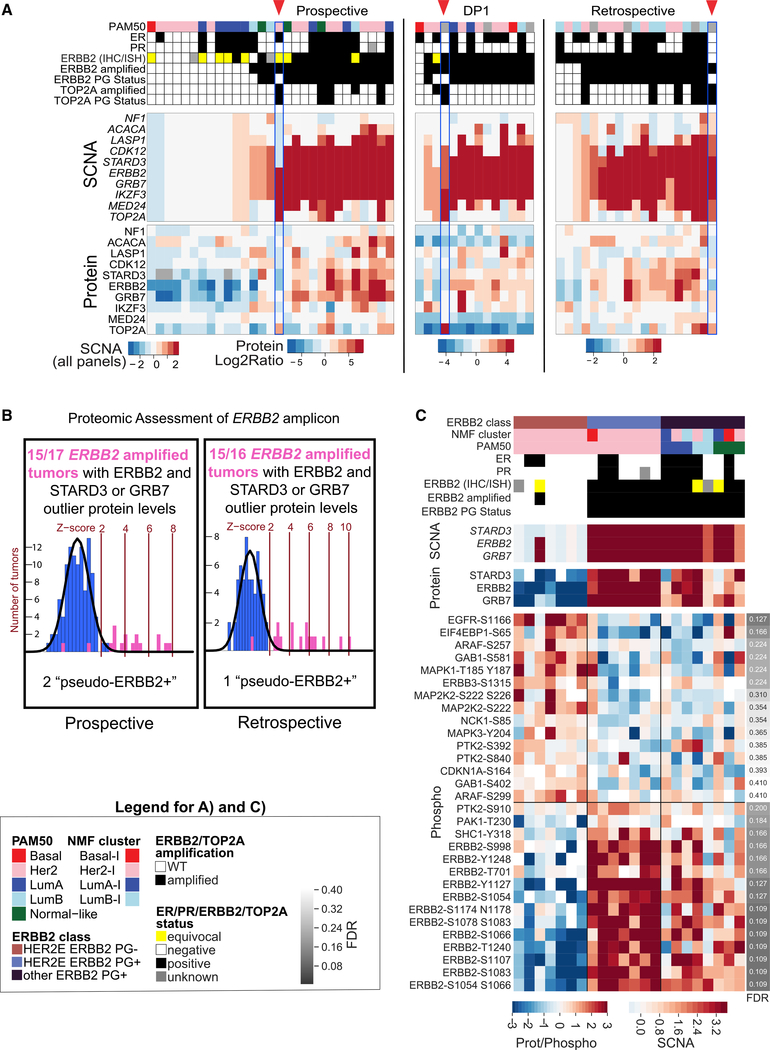
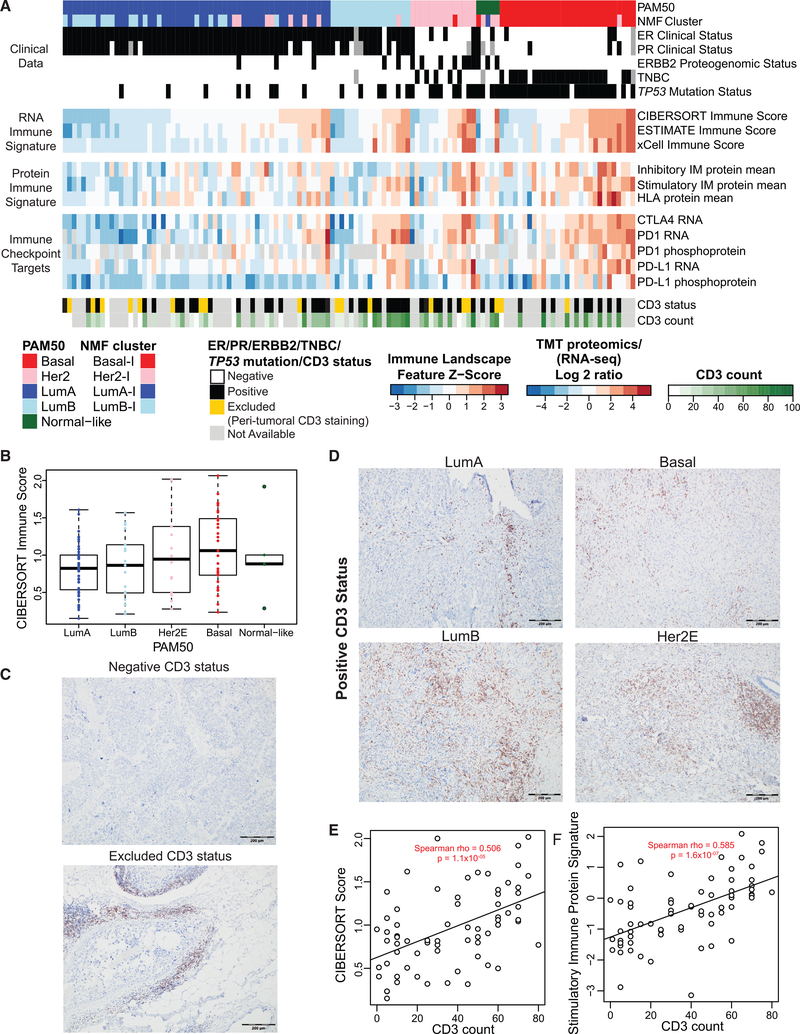
The integration of mass spectrometry-based proteomics with next-generation DNA and RNA sequencing profiles tumors more comprehensively. Here this "proteogenomics" approach was applied to 122 treatment-naive primary breast cancers accrued to preserve post-translational modifications, including protein phosphorylation and acetylation. Proteogenomics challenged standard breast cancer diagnoses, provided detailed analysis of the ERBB2 amplicon, defined tumor subsets that could benefit from immune checkpoint therapy, and allowed more accurate assessment of Rb status for prediction of CDK4/6 inhibitor responsiveness. Phosphoproteomics profiles uncovered novel associations between tumor suppressor loss and targetable kinases. Acetylproteome analysis highlighted acetylation on key nuclear proteins involved in the DNA damage response and revealed cross-talk between cytoplasmic and mitochondrial acetylation and metabolism. Our results underscore the potential of proteogenomics for clinical investigation of breast cancer through more accurate annotation of targetable pathways and biological features of this remarkably heterogeneous malignancy.

Keywords: CDK 4/6 inhibitors; CPTAC; acetylation; breast cancer; genomics; immune checkpoint therapy; mass spectrometry; phosphoproteomics; proteogenomics; proteomics.


Conflict of interest statement

Declaration of Interests M.J.E reports ownership and royalties associated with Bioclassifier LLC through sales by Nanostring LLC and Veracyte for the “Prosigna” breast cancer prognostic test. He also reports ad hoc consulting for AstraZeneca, Foundation Medicine, G1 Therapeutics, Novartis, Sermonix, Abbvie, Lilly and Pfizer. B.Z. has received research funding from Bristol-Myers Squibb. S.A.C. is a scientific advisory board member of Kymera, PTM BioLabs, and Seer and ad hoc consultant to Pfizer and Biogen.

Figures

Figure 1.
Figure 1.. Proteogenomics (PG) Landscape of BRCA
(A) Schematic overview of PG data acquired for this cohort. (B) Unsupervised multi-omics identified four molecular subtypes. Samples are ordered by cluster and membership score in decreasing order. (C) Kaplan-Meier curves showing survival outcome of PAM50 LumA samples in the METABRIC database that were assigned by a random forest mRNA-based classifier to the NMF LumA-I (red) or LumB-I subtypes (green) compared with PAM50 LumB samples (blue). The p values were derived from log rank tests. (D) Heatmap showing the fraction of outlier values in each sample per protein. Proteins shown are kinases highly phosphorylated in each NMF cluster with an FDR of less than 0.01 using BlackSheep. Kinases shown in bold were detected as outliers in the prior study. The top panel shows PAM50 and NMF cluster membership as well as NMF membership score. The left panel indicates whether an inhibitor can be found for a given kinase using the DGIdb (Drug Gene Interaction Database). The right panels depict the abundance of the kinase activation loop and kinase substrate enrichment. (E) Heatmap showing q values from BlackSheep for enrichment of phosphorylation outliers (y axis) in samples with the indicated mutated gene (x axis). Numbers in parentheses indicate the number of samples in each mutational subgroup. Kinases with an FDR of less than 0.01 are shown, and light gray cells indicate kinases that did not show enrichment (FDR ≥ 0.01). See also Figures S1–S3 and Tables S1, S2, S3, S4, and S5.
Figure 2.
Figure 2.. Proteogenomics (PG) Metabolic Profiling
(A) Heatmap showing unsupervised clustering of DE metabolic proteins across NMF clusters (Kruskal-Wallis test, FDR p < 5×10−05). The bottom heatmap shows DE normalized Ac values (normalized to protein abundance; Kruskal-Wallis test, FDR p < 0.005) with the same sample ordering as the top heatmap. (B) Pathway schematic showing DE metabolic proteins and normalized Ac sites (Wilcoxon test, FDR p < 0.05) mapped onto key metabolic pathways. (C) Bubble chart showing breakdown of upregulated and downregulated proteins and normalized Ac sites in NMF Basal-I compared with any other subtype by cell compartment. (D) Significant associations (linear model coefficient FDR p < 0.1) between protein expression of mitochondrial HDACs (histone deacetylases) and HATs (histone acetyltransferases) (columns) and Ac of mitochondrial metabolic proteins (rows). (E) Heatmap showing unsupervised clustering of nuclear protein acetylation, which was differentially expressed across NMF clusters (Kruskal-Wallis test, FDR p < 0.05). (F) Protein scores of DNA repair pathways across clusters defined in (E). Wilcoxon test p value significance is shown compared with cluster 1. *p < 0.05, **p < 0.01, ***p < 0.001, ****p < 0.0001. BER, base excision repair; NER, nucleotide excision repair; SSBR, single-strand break repair; DSBR, double-strand break repair; FA, Fanconi anemia; HR, homologous recombination. Boxplots show 1.5× the interquartile range for each group, centered on the median. (G) Scatterplot showing global differential protein expression and Ac analysis results in cluster 1 versus cluster 3, representing the two subgroups of NMF Basal-I. The x axis shows the protein median fold change multiplied by −log10(FDR p value). The y axis shows the Ac site median fold change multiplied by −log10(FDR p value). Ac or protein changes were considered significantly different if FDR p value < 0.05 and median fold change > 0.5. The “Ac up in cluster 1” group is defined by significantly different Ac sites for which the Ac median fold change is positive and the protein change is not significant. The “protein up in cluster 1” group is defined by significantly different proteins for which the protein median fold change is positive and the Ac change is not significant. (H) Significantly different Ac sites in cluster 1 versus cluster 3 are found in HATs, their complex partners, histone proteins, and the NHEJ pathway. Boxplots show 1.5× the interquartile range for each group, centered on the median. See also Figure S5 and Tables S2 and S6.
Figure 3.
Figure 3.. PG Classification of ERBB2 Tumors
(A) Proteogenomics analysis of the ERBB2 locus in this study (“Prospective”), biopsies from ERBB2+ BRCA tumors (“DP1”; Satpathy et al., 2020), and TCGA tumors (“Retrospective”; Mertins et al., 2016). The heatmap depicts clinical data (top panel), copy number alterations (center panel), and protein expression (bottom panel) of genes proximal to ERBB2 on chromosome 17q for samples that were PAM50 HER2E, clinical ERBB2+/equivocal by immunohistochemistry (IHC) and/or in situ hybridization (ISH), or ERBB2 PG+. PG amplification of TOP2A, a potential alternative driver in the locus, is indicated by red arrowheads. (B) Outlier analysis of ERBB2 and STARD3 or GRB7 confirms higher protein levels in most ERBB2-amplified samples (purple histogram) relative to the distribution of ERBB2 protein in non-amplified samples (blue histogram) in the prospective and retrospective datasets. Amplified samples with protein levels falling within the distribution of ERBB2 non-amplified samples are considered “pseudo-ERBB2+.” (C) Phosphopeptide levels for components of the KEGG ErbB signaling pathway in HER2-associated tumors (PAM50 HER2E and ERBB2 PG+). The top panel of the heatmap shows subtype classifications and clinical marker status for each of these samples, and the bottom panel indicates somatic copy number aberrations (SCNAs) for genes in the amplicon closely linked to ERBB2, followed by the corresponding protein levels. The bottom panel depicts abundances of phosphopeptides from the ERBB2 pathway. See also Figure S6 and Tables S1 and S2.
Figure 4.
Figure 4.. Immunological Landscape of BRCA
(A) Heatmap showing the wide range of expression levels for immune-related features in each PAM50 subtype. Z scores of RNA-based immune signatures from CIBERSORT, ESTIMATE, and xCell and for protein-derived signatures for immune modulator gene sets from Thorsson et al. (2019) are shown in the top two data panels. The third data panel shows log2 ratios for normalized RNA-seq and proteomics data (phosphoprotein is the median for all sites on a given protein) for FDA-approved immune checkpoint targets PD-L1, PD1, and CTLA4. The bottom panel shows CD3 IHC results for samples available for centralized IHC. Within each subtype, samples are ordered by increasing CIBERSORT immune score. (B) Distribution of CIBERSORT immune scores in each PAM50 subtype. Boxplots show 1.5× the interquartile range for each group, centered on the median. (C) Representative images for CD3 IHC for samples classified as CD3− (top) and CD3-excluded (bottom). (D) Images showing examples of CD3+ samples with elevated CIBERSORT scores in each PAM50 subtype. (E) Spearman-rank correlation of CD3+ cell counts with CIBERSORT score. (F) Spearman-rank correlation of CD3+ cell counts with stimulatory immune modulator protein scores. See also Figure S7 and Tables S2 and S6.
Figure 5.
Figure 5.. Association of APOBEC Mutations and DNA Damage Repair Pathway Levels with the Immune Microenvironment in Luminal Tumors
(A) Correlation of protein levels with PD-L1 mRNA in PAM50 basal (x axis) and luminal (LumA and LumB, y axis) samples. Signed log10 FDR-corrected p values of Spearman-rank correlations are plotted. Protein data for PD-L1 was sparse in this study, but we observed high correlation between PD-L1 RNA and protein in the DP1 study, indicating that the RNA is a suitable surrogate for protein (Figure S7C). (B) Although mutation load is correlated with the immune microenvironment in PAM50 luminal and basal BRCA, luminal samples with a high mutation load specifically show enrichment for APOBEC mutations. Luminal samples without APOBEC enrichment, luminal samples with APOBEC enrichment, basal samples (no APOBEC enrichment), PAM50 HER2E samples without APOBEC enrichment, and HER2E samples with APOBEC enrichment are ordered by increasing CIBERSORT scores. SBS13 and SBS2 are similarity scores for the whole-exome sequencing (WES)-derived mutation profile of a given sample with the corresponding COSMIC signature. APOBEC mutation fraction indicates the fraction of mutations that are APOBEC-associated mutations. APOBEC3G and APOBEC3B protein levels are also shown. (C) Nucleotide excision repair (NER), mRNA processing, and RNA splicing are negatively correlated with PD-L1 in PAM50 luminal but not basal BRCA. The bar graph shows normalized enrichment scores (NESs) for the top GO biological process gene sets correlated with PD-L1 mRNA in luminal samples (blue bars) together with the corresponding NES for basal samples (red bars) from the gene set enrichment analysis (GSEA) of signed log10 p values from (A). (D) The mean log2 TMT ratio for proteins from the GO BP NER pathway is negatively correlated (Spearman) with PD-L1 RNA expression in PAM50 luminal but not basal samples in the prospective (top) and retrospective (bottom) datasets. Scatterplots show the mean log2 TMT ratios on the y axis and log2 mRNA ratios (median-MAD-normalized data) on the x axis. Blue points show PAM50 luminal (LumA and LumB) samples, red points show PAM50 basal samples, and lines show the linear fit for each group. (E) Heatmaps showing pairwise Spearman-rank correlations within the PAM50 luminal (combined A and B) samples from the prospective (left) and retrospective (right) datasets for immune microenvironment features (CTLA4, PD1, and PD-L1 RNA and CIBERSORT and protein-based signatures from A), GO BP scores anti-correlated with PD-L1 in luminal tumors (C), specific DNA repair pathway scores, single- and double-strand break repair (SSBR and DSBR) scores, mutation load (not included for retrospective), APOBEC mutation signatures (SBS2 and SBS13), chromosomal instability (CIN, also not included for retrospective), and RNA processing/splicing. MMR, mismatch repair; BER, base excision repair; NER, nucleotide excison repair; TLS, translesion synthesis; HR, homologous recombination; FA, Fanconi anemia; DR, direct repair; NHEJ, non-homologous end joining; DDR, DNA damage response (primarily checkpoint proteins). Gene set-based scores are the mean protein levels of all genes in the set. See also Figure S7 and Tables S2, S6, and S7.
Figure 6.
Figure 6.. Rb Phosphorylation Status Indicates Potential Candidates for CDK4/6 Inhibitor Therapy in TNBC
(A) Heatmap of PG features related to regulation of cell cycle by the Rb protein. Samples are ordered by RNA-based multi-gene proliferation score (MGPS; Ellis et al., 2017) within HR+ (ER+ or PR+) / ERBB2 PG− and TNBC subtypes. Correlation of each feature with the MGPS in each subtype is indicated by the bar plots along the side. The pathway diagram on the left depicts how the features included in the heatmap regulate G1-S progression to promote E2F transcription. Red boxes for SCNAs indicate gene amplification, whereas blue boxes indicate gene deletions. Phosphoprotein levels are represented by the median log2 TMT ratio of all phosphosites for a given gene. Z scores of kinase target NESs from single sample post-translational modification-signature enrichment analysis (PTM-SEA), of single sample GSEA NES values using MSigDb Hallmark sets, and of the stemness and CIBERSORT (CS) immune scores are also shown. (B) Plot of Spearman correlations of kinase activity scores (kinase target PTM-SEA NES) for each Cyclin-dependent kinase (CDK) with MGPS, showing strong positive correlations between CDK4 and CDK6 with MGPS in hormone receptor+ (HR+) / ERBB2 PG− but not TNBC samples. Density plots of the distributions of the activity scores in each of the groups are shown below the corresponding point for each kinase. P values were derived from Wilcoxon rank-sum tests. (C) Loss of Rb drives proliferation in TNBC samples, whereas phosphorylation of Rb is strongly associated with proliferation in HR+/ERBB2− samples. A scatterplot of Rb phosphoprotein (median of all phosphosites) log2 TMT ratios versus MGPS shows strong negative correlation between phospho-Rb and proliferation in TNBC samples, whereas phospho-Rb is positively correlated in HR+ / ERBB2 PG− samples. Points are colored by subtype. Red, TNBC; blue, HR+ / ERBB2 PG−. (D) Response to palbociclib (AUC, area under the dose-response curve) in ER+ / HER2− (circles) and ER− / HER2− (triangles) BRCA cell lines from the Genomics of Drug Sensitivity to Cancer (GDSC) database (Iorio et al., 2016; Yang et al., 2013). ER− / HER2− cell lines with RB1 mutations/deletions are refractory to treatment (AUC), whereas ER− / HER2− cell lines with wild-type RB1 show similar sensitivity as ER+ / HER2− cell lines. Boxplots show 1.5× the interquartile range for each group, centered on the median. P value is from the Kruskal-Wallis test. (E) Rb protein levels are negatively correlated with response to palbociclib across all HER2− BRCA cell lines from the GDSC. A scatterplot shows log2 TMT ratios for Rb protein on the y axis and AUC on the x axis. Shown are cell lines from (D) with Rb protein data. Gray triangles, wild-type (WT) ER+ / HER2− cells; gray circles, WT ER− / HER2− cells; green circles, RB1 deletion or frameshift mutant ER− / HER2− cells; yellow circles, RB1 missense ER− / HER2− cells. A line shows the linear regression fit for Rb protein versus AUC. Spearman correlation rho and p values are also shown. See also Figure S7 and Tables S2, S6, and S7.

References

    1. Alhazzazi TY, Kamarajan P, Xu Y, Ai T, Chen L, Verdin E, and Kapila YL (2016). A Novel Sirtuin-3 Inhibitor, LC-0296, Inhibits Cell Survival and Proliferation, and Promotes Apoptosis of Head and Neck Cancer Cells. Anticancer Res. 36, 49–60. - PMC - PubMed
    1. Ali I, Conrad RJ, Verdin E, and Ott M (2018). Lysine Acetylation Goes Global: From Epigenetics to Metabolism and Therapeutics. Chem. Rev. 118, 1216–1252. - PMC - PubMed
    1. Angelova M, Charoentong P, Hackl H, Fischer ML, Snajder R, Krogsdam AM, Waldner MJ, Bindea G, Mlecnik B, Galon J, and Trajanoski Z (2015). Characterization of the immunophenotypes and antigenomes of colorectal cancers reveals distinct tumor escape mechanisms and novel targets for immunotherapy. Genome Biol. 16, 64. - PMC - PubMed
    1. Anurag M, Punturi N, Hoog J, Bainbridge MN, Ellis MJ, and Haricharan S (2018a). Comprehensive Profiling of DNA Repair Defects in Breast Cancer Identifies a Novel Class of Endocrine Therapy Resistance Drivers. Clin. Cancer Res. 24, 4887–4899. - PMC - PubMed
    1. Anurag M, Ellis MJ, and Haricharan S (2018b). DNA damage repair defects as a new class of endocrine treatment resistance driver. Oncotarget 9, 36252–36253. - PMC - PubMed

Publication types

MeSH terms