

Inferring Protein Sequence-Function Relationships with Large-Scale Positive-Unlabeled Learning
- PMID: 33212013
- PMCID: PMC7856229
- DOI: 10.1016/j.cels.2020.10.007
Inferring Protein Sequence-Function Relationships with Large-Scale Positive-Unlabeled Learning
Abstract
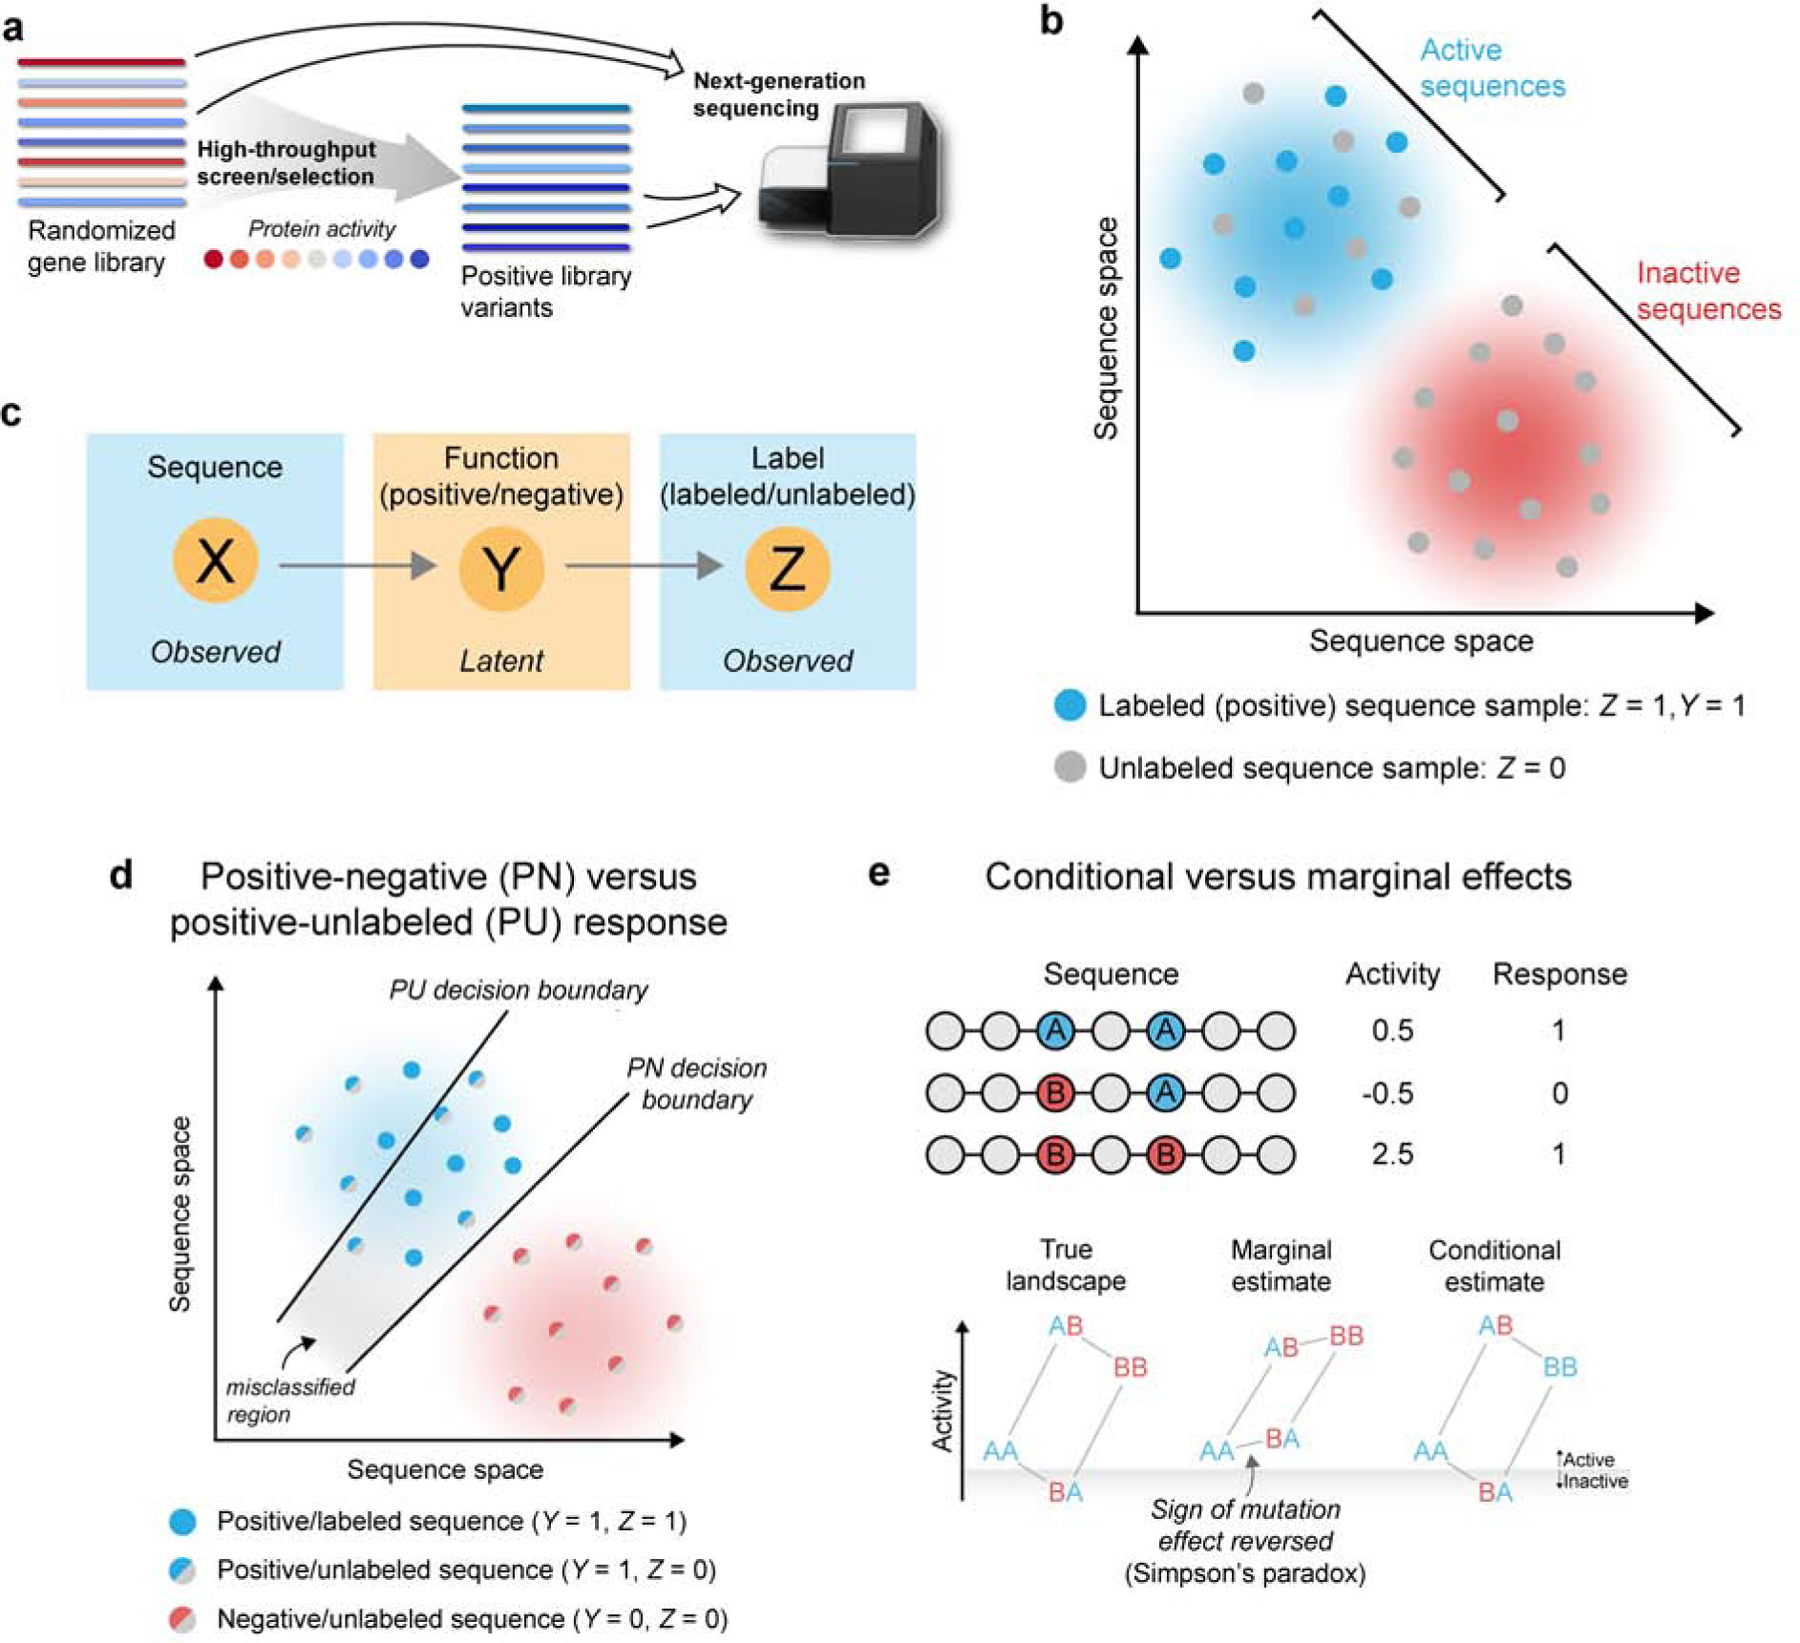
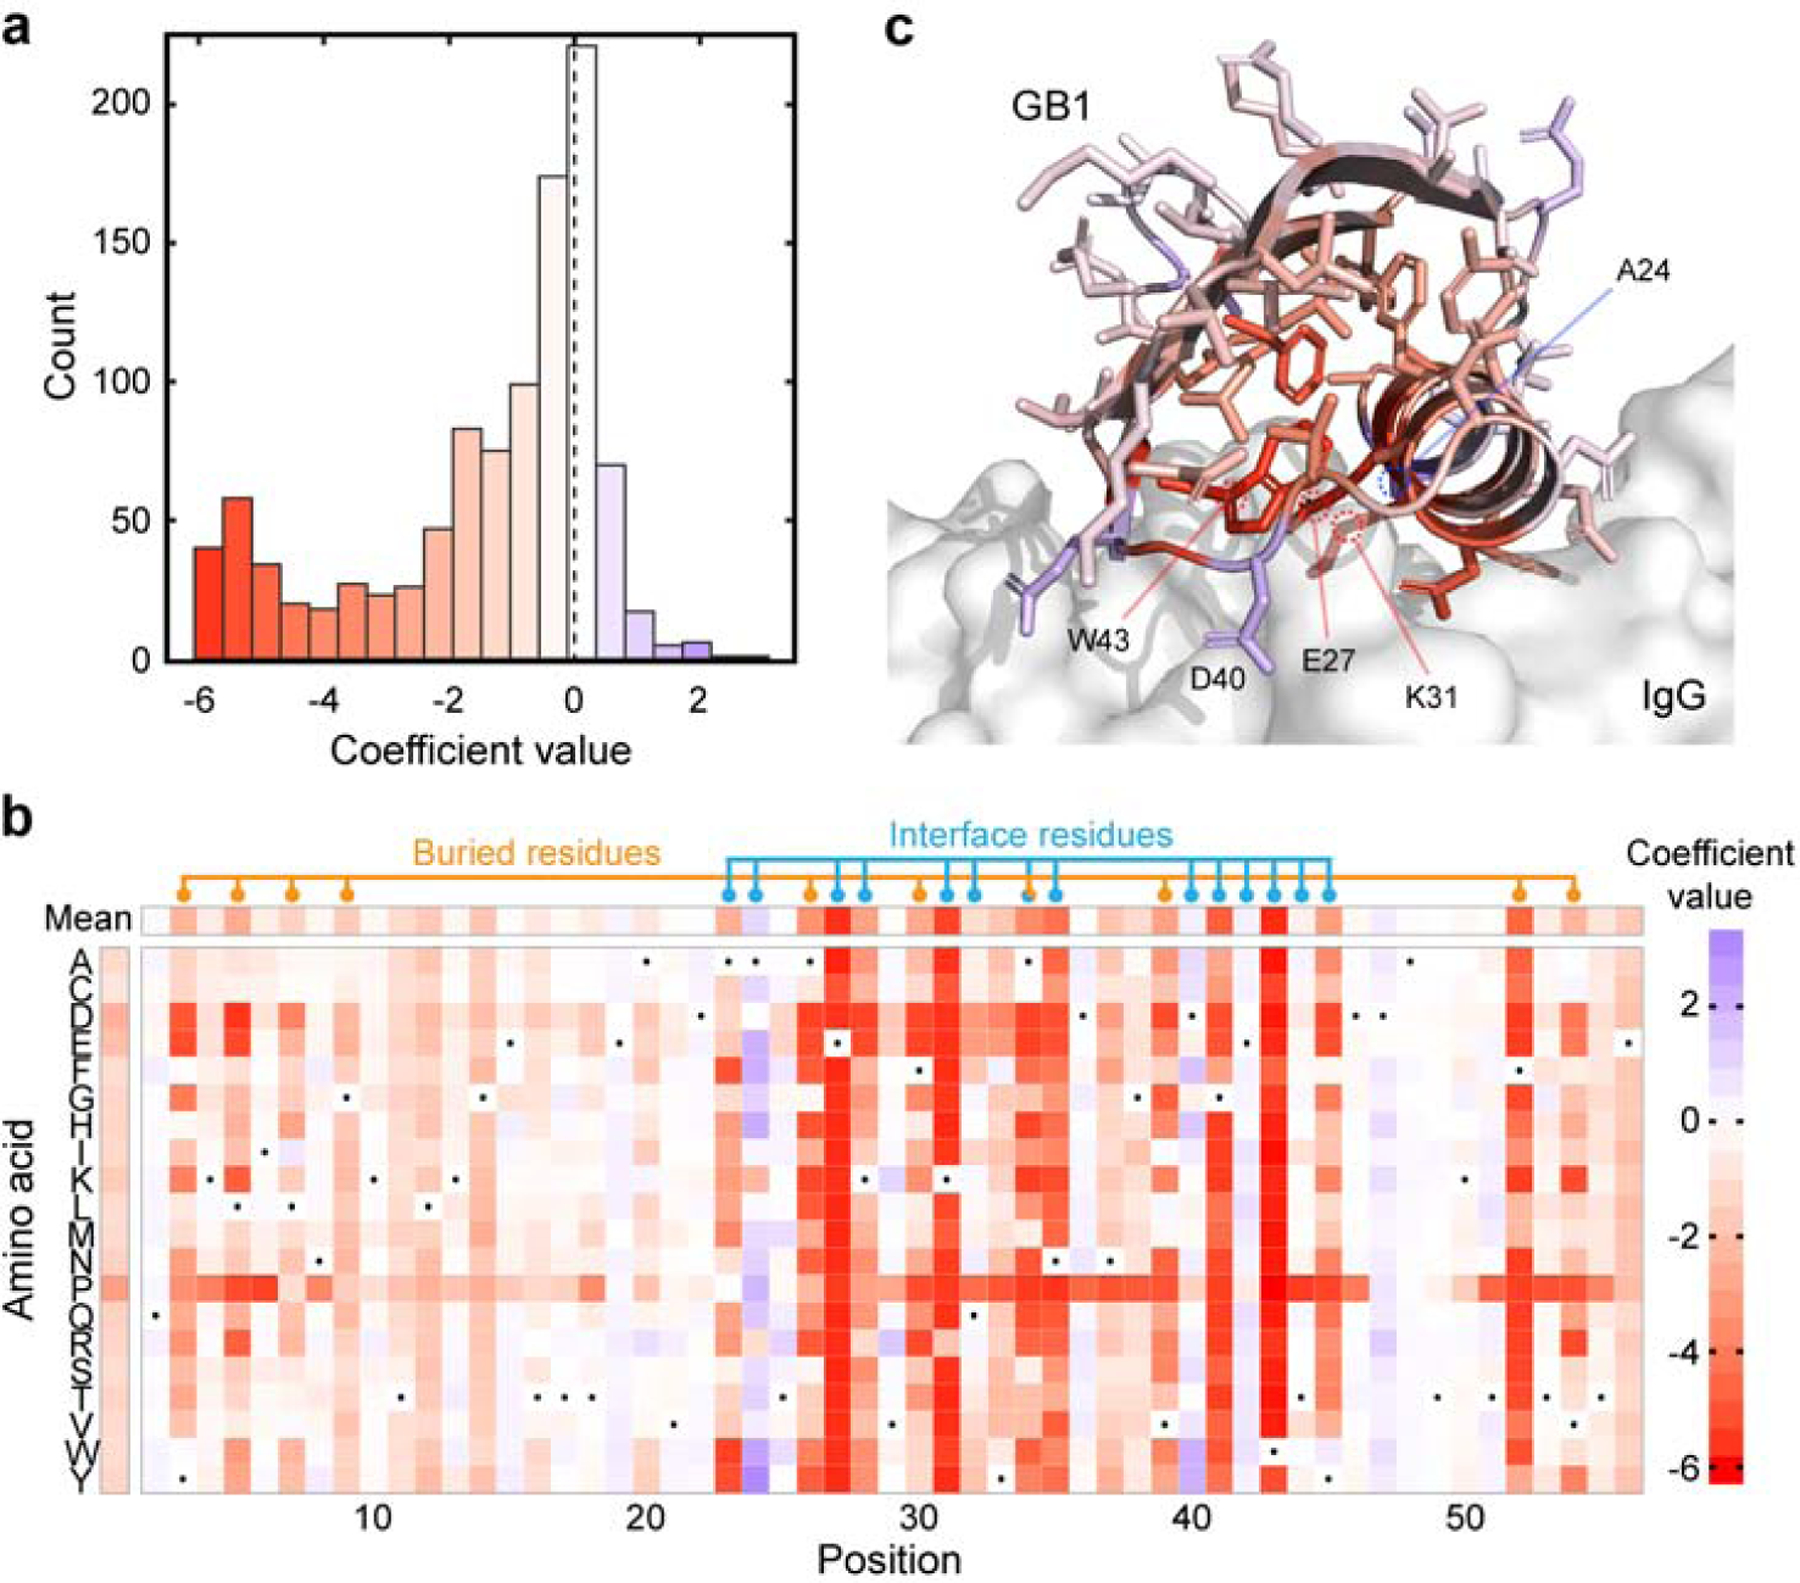
Machine learning can infer how protein sequence maps to function without requiring a detailed understanding of the underlying physical or biological mechanisms. It is challenging to apply existing supervised learning frameworks to large-scale experimental data generated by deep mutational scanning (DMS) and related methods. DMS data often contain high-dimensional and correlated sequence variables, experimental sampling error and bias, and the presence of missing data. Notably, most DMS data do not contain examples of negative sequences, making it challenging to directly estimate how sequence affects function. Here, we develop a positive-unlabeled (PU) learning framework to infer sequence-function relationships from large-scale DMS data. Our PU learning method displays excellent predictive performance across ten large-scale sequence-function datasets, representing proteins of different folds, functions, and library types. The estimated parameters pinpoint key residues that dictate protein structure and function. Finally, we apply our statistical sequence-function model to design highly stabilized enzymes.
Keywords: deep mutational scanning; positive-unlabeled learning; protein engineering; protein sequence function relationships; statistical learning; supervised learning.
Copyright © 2020 Elsevier Inc. All rights reserved.
Conflict of interest statement
Declaration of Interests The authors declare no competing interests.
Figures


Similar articles
-
Learning Peptide Properties with Positive Examples Only.bioRxiv [Preprint]. 2023 Jun 5:2023.06.01.543289. doi: 10.1101/2023.06.01.543289. bioRxiv. 2023. PMID: 37333233 Free PMC article. Preprint.
-
Learning peptide properties with positive examples only.Digit Discov. 2024 Apr 19;3(5):977-986. doi: 10.1039/d3dd00218g. eCollection 2024 May 15. Digit Discov. 2024. PMID: 38756224 Free PMC article.
-
Neural networks to learn protein sequence-function relationships from deep mutational scanning data.Proc Natl Acad Sci U S A. 2021 Nov 30;118(48):e2104878118. doi: 10.1073/pnas.2104878118. Proc Natl Acad Sci U S A. 2021. PMID: 34815338 Free PMC article.
-
Positive-unlabeled learning in bioinformatics and computational biology: a brief review.Brief Bioinform. 2022 Jan 17;23(1):bbab461. doi: 10.1093/bib/bbab461. Brief Bioinform. 2022. PMID: 34729589 Review.
-
Machine learning to navigate fitness landscapes for protein engineering.Curr Opin Biotechnol. 2022 Jun;75:102713. doi: 10.1016/j.copbio.2022.102713. Epub 2022 Apr 9. Curr Opin Biotechnol. 2022. PMID: 35413604 Free PMC article. Review.
Cited by
-
Discovery of human ACE2 variants with altered recognition by the SARS-CoV-2 spike protein.bioRxiv [Preprint]. 2020 Sep 17:2020.09.17.301861. doi: 10.1101/2020.09.17.301861. bioRxiv. 2020. Update in: PLoS One. 2021 May 12;16(5):e0251585. doi: 10.1371/journal.pone.0251585. PMID: 32995796 Free PMC article. Updated. Preprint.
-
MBE: model-based enrichment estimation and prediction for differential sequencing data.Genome Biol. 2023 Oct 2;24(1):218. doi: 10.1186/s13059-023-03058-w. Genome Biol. 2023. PMID: 37784130 Free PMC article.
-
QAFI: a novel method for quantitative estimation of missense variant impact using protein-specific predictors and ensemble learning.Hum Genet. 2025 Mar;144(2-3):191-208. doi: 10.1007/s00439-024-02692-z. Epub 2024 Jul 24. Hum Genet. 2025. PMID: 39048855 Free PMC article.
-
Deep neural networks for predicting the affinity landscape of protein-protein interactions.iScience. 2024 Aug 19;27(9):110772. doi: 10.1016/j.isci.2024.110772. eCollection 2024 Sep 20. iScience. 2024. PMID: 39310756 Free PMC article.
-
Design of synthetic human gut microbiome assembly and butyrate production.Nat Commun. 2021 May 31;12(1):3254. doi: 10.1038/s41467-021-22938-y. Nat Commun. 2021. PMID: 34059668 Free PMC article.
References
-
- Alford RF, Leaver-Fay A, Jeliazkov JR, O’Meara MJ, DiMaio FP, Park H, Shapovalov MV, Renfrew PD, Mulligan VK, Kappel K, Labonte JW, Pacella MS, Bonneau R, Bradley P, Dunbrack RL, Das R, Baker D, Kuhlman B, Kortemme T & Gray JJ (2017), ‘The Rosetta All-Atom Energy Function for Macromolecular Modeling and Design’, Journal of Chemical Theory and Computation 13(6), 3031–3048. - PMC - PubMed
-
- Alvizo O, Nguyen LJ, Savile CK, Bresson JA, Lakhapatri SL, Solis EOP, Fox RJ, Broering JM, Benoit MR, Zimmerman SA, Novick SJ, Liang J & Lalonde JJ (2014), ‘Directed evolution of an ultrastable carbonic anhydrase for highly efficient carbon capture from flue gas’, Proceedings of the National Academy of Sciences 111(46), 16436–16441. - PMC - PubMed
-
- Benjamini Y & Hochberg Y (1995), ‘Controlling the false discovery rate: A practical and powerful approach to multiple testing’, J. R. Stat. Soc. Series B Stat. Methodol 57(1), 289–300.
Publication types
MeSH terms
Substances
Grants and funding
LinkOut - more resources
Full Text Sources
Other Literature Sources
