. 2021 Jan:43:101116.
doi: 10.1016/j.molmet.2020.101116. Epub 2020 Nov 17.

Maternal obesity persistently alters cardiac progenitor gene expression and programs adult-onset heart disease susceptibility

Affiliations

Maternal obesity persistently alters cardiac progenitor gene expression and programs adult-onset heart disease susceptibility

Abdalla Ahmed et al. Mol Metab. 2021 Jan.

Abstract

Objective: Heart disease risk can be programmed by intrauterine exposure to obesity. Dysregulating key transcription factors in cardiac progenitors can cause subsequent adult-onset heart disease. In this study, we investigated the transcriptional pathways that are altered in the embryonic heart and linked to heart disease risk in offspring exposed to obesity during pregnancy.

Methods: Female mice were fed an obesogenic diet and mated with males fed a control diet. Heart function and genome-wide gene expression were analyzed in adult offspring born to obese and lean mice at baseline and in response to stress. Cross-referencing with genes dysregulated genome-wide in cardiac progenitors from embryos of obese mice and human fetal hearts revealed the transcriptional events associated with adult-onset heart disease susceptibility.

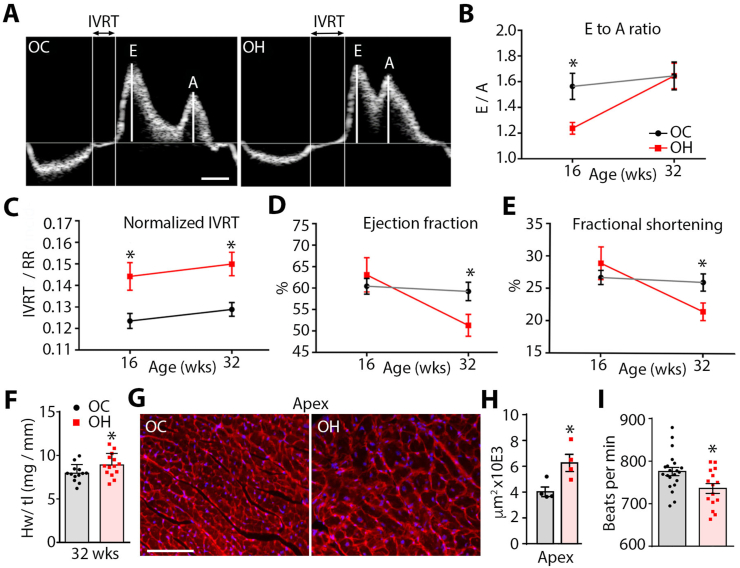
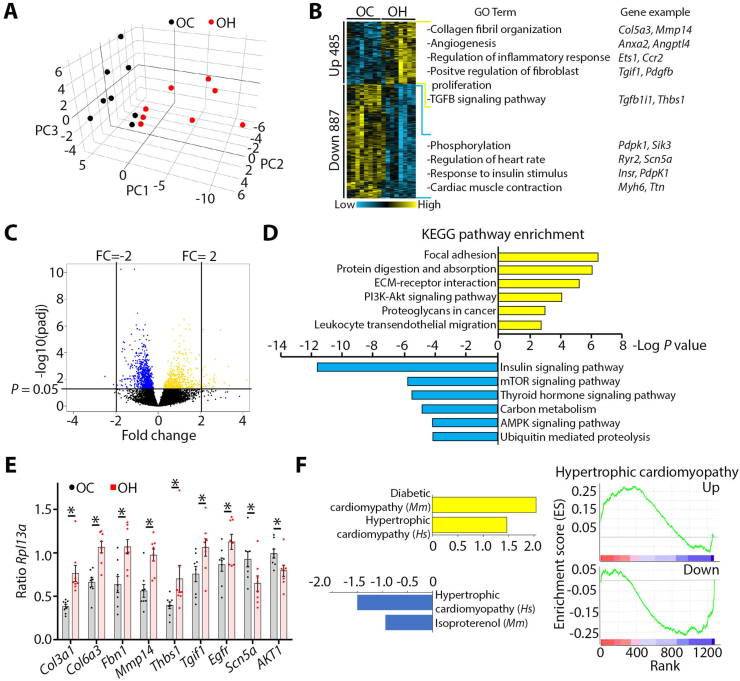
Results: We found that adult mice born to obese mothers develop mild heart dysfunction consistent with early stages of disease. Accordingly, hearts of these mice dysregulated genes controlling extracellular matrix remodeling, metabolism, and TGF-β signaling, known to control heart disease progression. These pathways were already dysregulated in cardiac progenitors in embryos of obese mice. Moreover, in response to cardiovascular stress, the heart of adults born to obese dams developed exacerbated myocardial remodeling and excessively activated regulators of cell-extracellular matrix interactions but failed to activate metabolic regulators. Expression of developmentally regulated genes was altered in cardiac progenitors of embryos of obese mice and human hearts of fetuses of obese donors. Accordingly, the levels of Nkx2-5, a key regulator of heart development, inversely correlated with maternal body weight in mice. Furthermore, Nkx2-5 target genes were dysregulated in cardiac progenitors and persistently in adult hearts born to obese mice and human hearts from pregnancies affected by obesity.

Conclusions: Obesity during pregnancy alters Nkx2-5-controlled transcription in differentiating cardiac progenitors and persistently in the adult heart, making the adult heart vulnerable to dysregulated stress responses.

Keywords: Cardiac progenitors; Fetal programming of heart disease; Gene expression; Heart disease susceptibility; Maternal obesity; Myocardial remodeling; Nkx2-5.


Figures

Image 1
Graphical abstract
Figure 1
Figure 1
Cardiac dysfunction progressed with age in male offspring born to obese mice. (A) Representative pulsed Doppler recording of blood flow across the mitral valve for a cardiac cycle in mice born to females fed a control (OC) or high-fat diet (OH) at 16 weeks. Isovolumetric relaxation time (IVRT) is indicated between the white lines. Peak velocities of early (E) and late/atrial (A) diastolic filling waves are highlighted. Scale bar = 20 msec. (B) Peak E to A ratios at 16 and 32 weeks. (C) IVRT normalized to the length of the cardiac cycle (RR). (D) Left ventricular ejection fraction of the OH and OC at 16 and 32 weeks. (E) Left ventricular fractional shortening of the OH and OC at 16 and 32 weeks. For B to E N = 7–8 mice per group at each time point. (F) Heart weight normalized to the tibia length ratio in the OH and OC. N = 13–14 mice per group. (G) Wheat germ agglutinin staining on sections of the apex of the heart. Scale bar represents 100 μm. (H) Cell surface area in sections of the heart apex. N = 4 mice per group. (I) Heart rate of the unanesthetized OH and OC. N = 21 and 15 mice per group. Student's t-test. Bars represent the mean ± SEM.
Figure 2
Figure 2
Higher maternal weight was associated with small but broad changes in transcriptional pathways controlling heart disease. (A) Principal component analysis (PCA) plot displaying separation of cardiac transcriptomes by maternal diet. (B) Heatmap clustering of differentially expressed genes between ventricles of the OH and OC at 32 weeks of age. Enriched GO terms and representative genes are shown on the right. (C) Volcano plot of all the detected genes. Significantly downregulated genes are in blue and upregulated in yellow. (D) KEGG pathways enriched in genes that were significantly up- and downregulated in mice born to obese mice. (E) qPCR on hearts of the OC and OH at 32 weeks. The genes analyzed are representative of the pathways identified in (B). N = 8 mice per group. (F) Gene set enrichment analysis of hearts affected by different diseases compared to genes up- and downregulated in our model. Positively and negatively enriched gene sets are on the left, enrichment plots of hypertrophic cardiomyopathy, one of the top enriched terms, are on the right. Bars represent the mean ± SEM.
Figure 3
Figure 3
Maternal weight and several cardiac phenotypes correlated with dysregulation of specific pathways in the heart. (A) Number of genes that significantly correlated with various maternal and offspring phenotypic parameters. Red dots represent the observed number of differentially expressed genes correlated with each phenotype (bootstrap P value < 0.05). Box plots depict 10,000 permutations of randomly selected genes. (B) Principal component analysis of transcriptomes separated by maternal weight at conception. (C) Gene network displaying all the differentially expressed genes in the top three enriched processes (ECM, heart rate regulation, and insulin signaling). Genes that correlated with maternal weight are highlighted. (D) Networks highlighting differentially expressed genes that correlate with heart weight and (E) isovolumetric relaxation time corrected to the time between heartbeats (IVRT/RR). no = genes whose expression did not change, up = genes upregulated, and down = genes downregulated in the OH compared to OL. Positive (+) and negative (−) correlations refer to a significant Pearson's correlation (adjusted P < 0.05) of gene expression levels and the respective phenotype after Benjamini and Hochberg correction for multiple tests. (F) Pearson's correlation between maternal weight at conception and IVRT/RR.
Figure 4
Figure 4
Male offspring of HD developed exacerbated pathological remodeling in response to isoproterenol infusion. (A) M mode echocardiogram of the left ventricle of mice born to females fed a control (OC) or high-fat diet (OH) that were treated with PBS or isoproterenol (ISO). Horizontal scale bar = 50 msec and vertical scale bar = 1 mm. (B) End systolic diameter. (C) End diastolic diameter. (D) End-diastolic volume. (E) Cardiac output. (F) Isovolumetric relaxation time normalized to the time between heartbeats (IVRT/RR). For B to F, N = 11, 6, 15, and 10 mice per group, respectively. One-way ANOVA. (G) Immunofluorescence against collagen type V alpha 1 (Col5a1) and actinin alpha 1 (Actn1). (H) Quantification of fibrosis area percentage. N = 3, 3, 7, and 5 mice per group, respectively. (I) Principal component (PC) analysis plot separated cardiac transcriptomes by treatment on PC1 and maternal diet on PC2. (J) GO term enrichment for the top 50 genes determining PC2. (K) qPCR of representative genes on PC2 in (I). Bars represent the mean ± SEM. N = 6–8 mice per group. (L) Unsupervised hierarchal clustering of genes that were differentially expressed between ventricles of the OH and OC treated with PBS or ISO at 10 weeks of age. Enriched GO terms and representative genes are shown on the right. (M) Expression profiles (magnitude of normalized count values) of gene clusters 1 and 8. Bars represent the mean ± SEM. One-way ANOVA with Tukey's multiple comparisons was used to determine the P values.
Figure 5
Figure 5
Maternal obesity induced dysregulation of Nkx2-5 target genes in cardiac progenitor cells and persistently in adult hearts. (A) Cardiac progenitor cells (CPs) were isolated by fluorescence-activated cell sorting (FACS) from embryos of dams carrying an Nkx2-5-eGFP transgene and that were fed a control (CD) or high-fat (HD) diet. CPs were used for RNA-seq. The heatmap represents the mRNA levels of 9 genes differentially expressed in CPs of embryos from the HD-fed mice. (B) Heatmap of genes dysregulated in CPs of embryos of the heaviest vs leanest mice. (C) KEGG pathways enriched in the dysregulated genes. (D) Venn diagram of genes dysregulated in CPs and adult (32 weeks) hearts and enriched ontologies in commonly dysregulated genes. (E) Motif enrichment analysis of genes dysregulated in CPs (top) and adult hearts (bottom). (F) qPCR of Nkx2-5 in CPs of embryos from the CD- and HD-fed mice. Each dot represents CPs from an individual embryo. Bars represent the mean ± SEM. N = 7 and 10, respectively. Student's t-test was used to determine the P values (G) Pearson's correlation analysis of Nkx2-5 mRNA in CPs vs maternal weight. Each dot represents pooled CPs from embryos from one litter. N = 5 and 7, respectively. (H) Number of genes with Nkx2-5-bound regions (determined using GREAT version 4.0.4 mm9 assembly) in CPs and (I) adult hearts. (J) Fraction of differentially expressed genes bound by Nkx2-5 compared to the fraction expected by chance for the overlaps in (H) and (I). Bars show 95% confidence intervals. Odds ratio and P value were obtained using Fisher's exact test. (K) Nkx2-5 ChIP-seq peaks proximal to differentially expressed genes in CPs and (L) adult hearts. Aggregate plots (top) show the mean ± SEM of signals in each category. Heatmaps show the Nkx2-5 signal centered on the TSS of genes lacking a promoter proximal peak. Up = upregulated, down = downregulated, and NS = not significantly changed. Only genes on the list used by GREAT were included in (H)–(L).
Figure 6
Figure 6
Nkx2-5 targeted genes abnormally expressed in human fetal hearts in response to exposure to obesity in utero. (A) Volcano plot of all the expressed genes in 8- to 9.4-week-old hearts. Genes that are significantly downregulated per unit increase in BMI are in green, and upregulated genes are in red. (B) Volcano plot of all the expressed genes in 15.3- to 16.6-week-old hearts. (C) Heatmap showing gene expression level of Early and Mid-Cor genes in human fetal hearts at different developmental stages. Normalized gene expression is shown on the right. (D) Volcano plot of all of the expressed genes in 8- to 9.4-week-old hearts of fetuses of morbidly obese vs healthy donors. Upregulated genes are in yellow and downregulated genes are in blue. (E) Network clustering showing gene sets (from GSEA) enriched in upregulated (red) and downregulated (blue) genes. (F) Fraction of differentially expressed genes in (D) bound by Nkx2-5 compared to the fraction expected by chance (red dotted line). Bars show 95% confidence intervals. Odds ratio and P value were obtained using Fisher's exact test. (G) Nkx2-5 ChIP-seq peaks proximal to differentially expressed genes in human hearts. (H) Percentage of differentially expressed genes that are bound by Nkx2-5.

References

    1. Ahmed A., Delgado-Olguin P. Embryonic programming of heart disease in response to obesity during pregnancy. Biochimica et Biophysica Acta - Molecular Basis of Disease. 2020;1866(2):165402. doi: 10.1016/j.bbadis.2019.01.028. - DOI - PubMed
    1. Reynolds R.M., Allan K.M., Raja E.a., Bhattacharya S., McNeill G., Hannaford P.C. Maternal obesity during pregnancy and premature mortality from cardiovascular event in adult offspring: follow-up of 1 323 275 person years. BMJ. 2013;347(August) doi: 10.1136/bmj.f4539. - DOI - PMC - PubMed
    1. Forsén T., Eriksson J.G., Tuomilehto J., Teramo K., Osmond C., Barker D.J. Mother's weight in pregnancy and coronary heart disease in a cohort of Finnish men: follow up study. BMJ (Clinical Research Ed.) 1997;315(7112):837–840. doi: 10.1136/bmj.315.7112.837. - DOI - PMC - PubMed
    1. Eriksson J.G., Sandboge S., Salonen M.K., Kajantie E., Osmond C. Long-term consequences of maternal overweight in pregnancy on offspring later health: findings from the Helsinki Birth Cohort Study. Annals of Medicine. 2014;3890(April):1–5. doi: 10.3109/07853890.2014.919728. - DOI - PubMed
    1. Asrani P., Pinto N., Puchalski M., Ou Z., Silver R.M., Zinkhan E.K. Maternal predictors of disparate outcomes in children with single ventricle congenital heart disease. Journal of the American Heart Association. 2020;9(12) - PMC - PubMed

Publication types