. 2021 Mar 3;29(3):1199-1213.
doi: 10.1016/j.ymthe.2020.11.019. Epub 2020 Nov 17.

Targeting Telomerase with an HLA Class II-Restricted TCR for Cancer Immunotherapy

Affiliations

Targeting Telomerase with an HLA Class II-Restricted TCR for Cancer Immunotherapy

Pierre Dillard et al. Mol Ther. .

Abstract

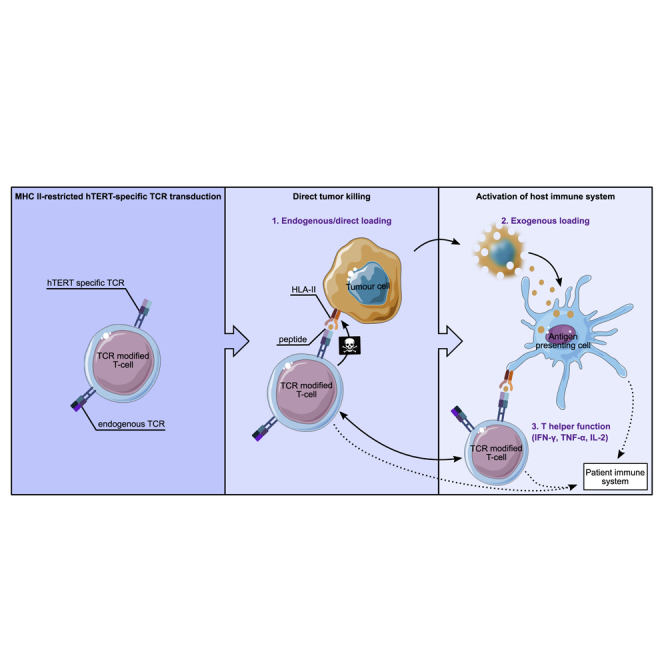
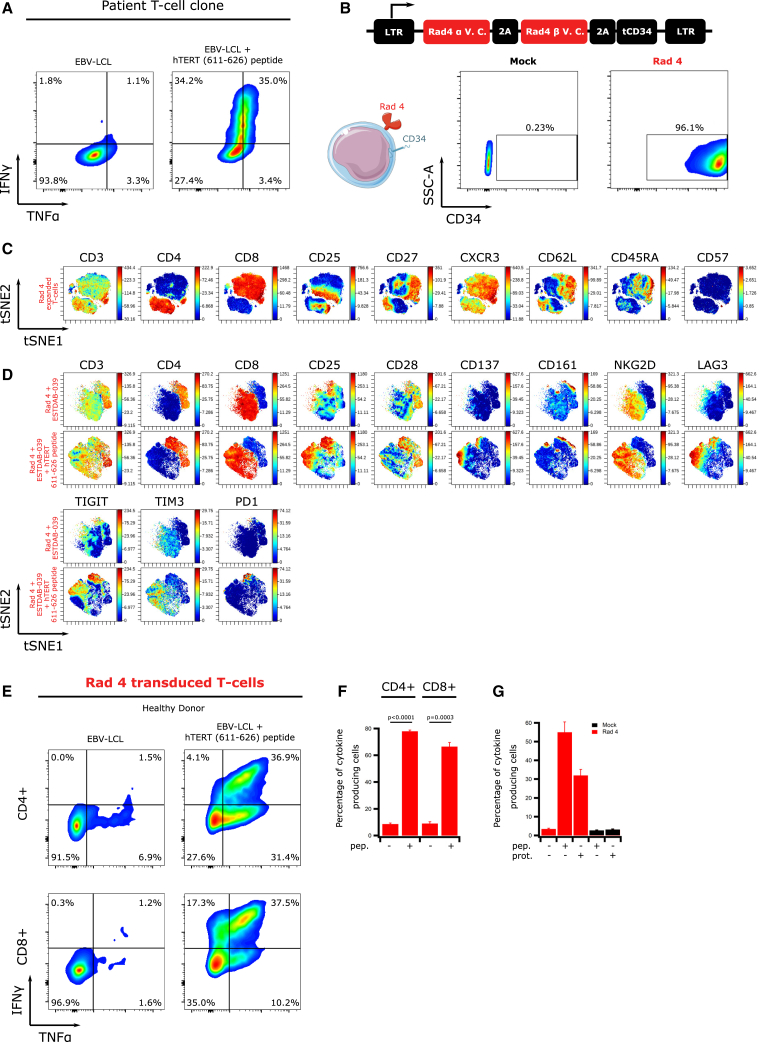
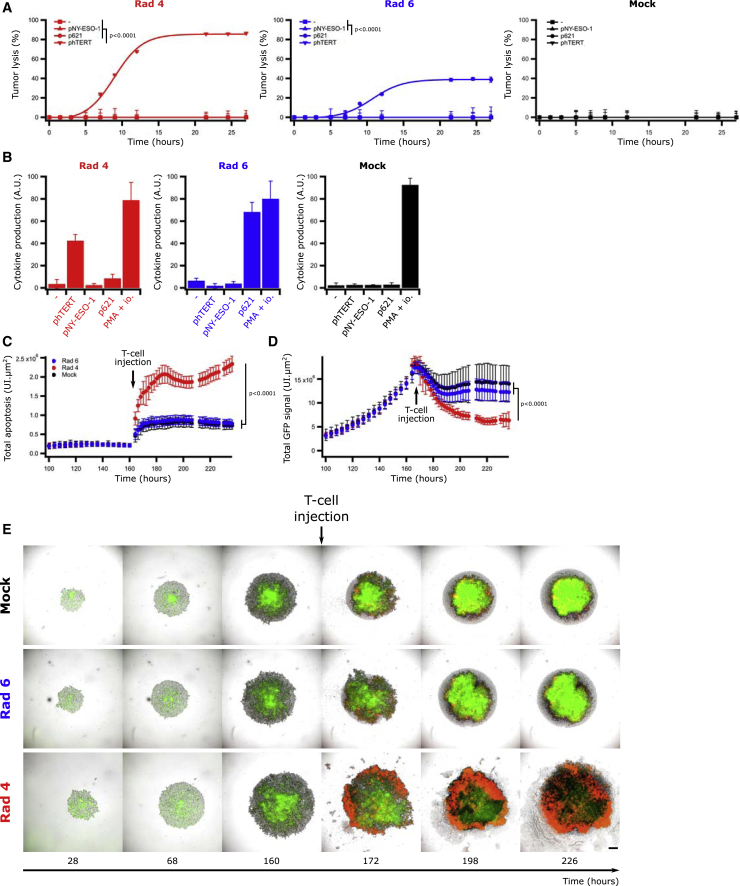
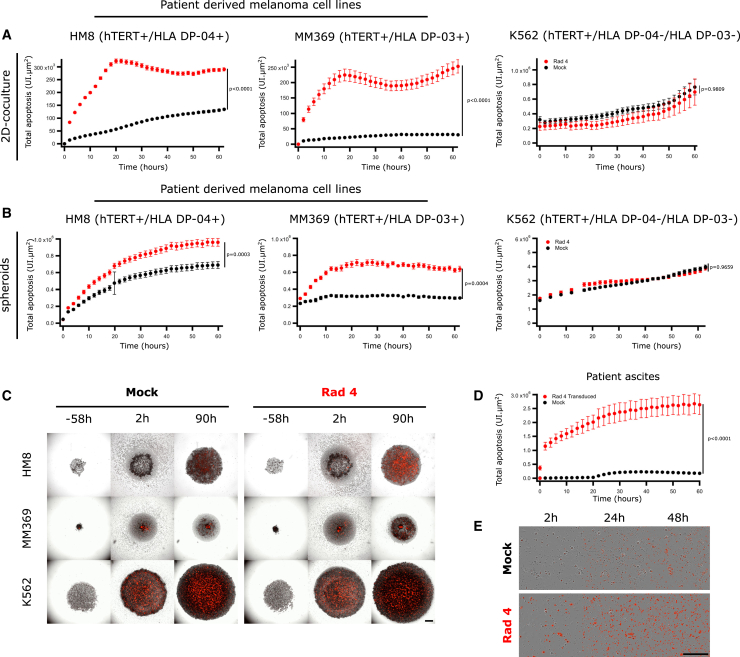
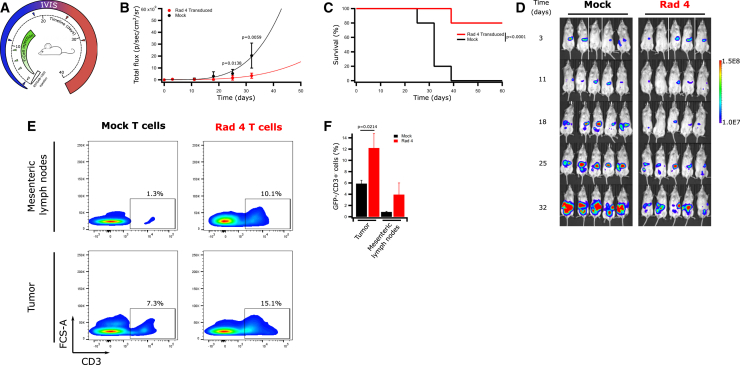
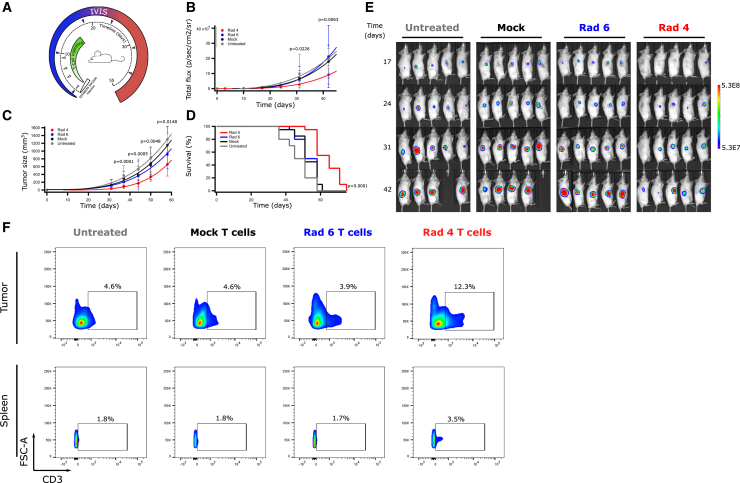
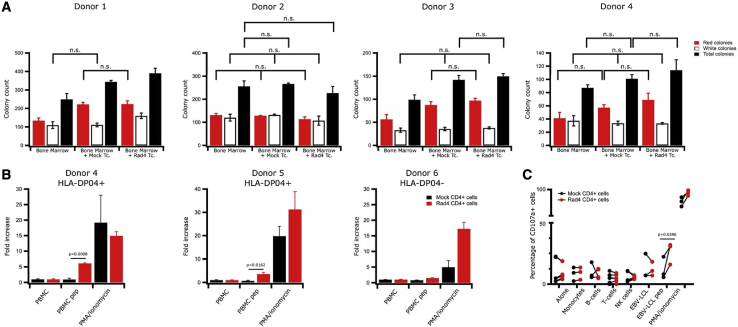
T cell receptor (TCR)-engineered T cell therapy is a promising cancer treatment approach. Human telomerase reverse transcriptase (hTERT) is overexpressed in the majority of tumors and a potential target for adoptive cell therapy. We isolated a novel hTERT-specific TCR sequence, named Radium-4, from a clinically responding pancreatic cancer patient vaccinated with a long hTERT peptide. Radium-4 TCR-redirected primary CD4+ and CD8+ T cells demonstrated in vitro efficacy, producing inflammatory cytokines and killing hTERT+ melanoma cells in both 2D and 3D settings, as well as malignant, patient-derived ascites cells. Importantly, T cells expressing Radium-4 TCR displayed no toxicity against bone marrow stem cells or mature hematopoietic cells. Notably, Radium-4 TCR+ T cells also significantly reduced tumor growth and improved survival in a xenograft mouse model. Since hTERT is a universal cancer antigen, and the very frequently expressed HLA class II molecules presenting the hTERT peptide to this TCR provide a very high (>75%) population coverage, this TCR represents an attractive candidate for immunotherapy of solid tumors.

Keywords: CD4 T cell; MHC class II; T cell receptor; immunotherapy; in vivo model; solid tumor; telomerase.


Conflict of interest statement

G.G., G.K., S.W., and E.M.I. are inventors on the patent WO2019166463. G.G. and G.K. are shareholders in Zelluna Immunotherapy AS. S.P. is currently employed by Zelluna Immunotherapy AS. All other authors declare no competing interests.

Figures

None
Graphical abstract
Figure 1
Figure 1
Radium-4 TCR Is Efficiently Expressed, Functional, and Specific (A) Intracellular IFN-γ and TNF-α production in the CD4+ patient T cell clone cocultured with HLA-DP04+ EBV-LCL, loaded or not with hTERT 611–626 peptide. Representative flow diagram from two independent experiments. (B) Schematic representation of the retroviral construct used for the transduction of Radium-4 TCR in primary T cells. Expression of Radium-4 TCR in primary T cells after retroviral transduction (leftpanels: mock transduced; right panels: TCR transduced) detected by flow cytometry using an anti-CD34 antibody. Data shown are representative flow diagrams from three independent experiments. (C) viSNE representation of phenotypic markers of expanded and transduced Radium-4 TCR T cells. (D) viSNE representation of the expression of extracellular activation markers and immune-checkpoint molecules of Radium-4 TCR T cells upon coincubation with ESTDAB-039 cells, preloaded or not with hTERT 611–626 peptide. (E) Intracellular IFN-γ and TNF-α production in CD4+ and CD8+ T cells retrovirally transduced with Radium-4 TCR and cocultured with EBV-LCL, loaded or not with hTERT 611–626 peptide. Representative flow diagram from three independent experiments. (F) Summary of intracellular IFN-γ and TNF-α production shown in (C). Bars represent mean ± SD. Statistical validation was realized between conditions in THE presence and absence of peptide. (G) Percentage of cytokine-producing Radium-4 TCR mRNA-electroporated T cells upon coculture with nonloaded APCs or loaded with hTERT 611–626 peptide or hTERT protein. Bars represent mean ± SD of quadruplicates.
Figure 2
Figure 2
Radium-4 TCR Promotes Specific Tumor Lysis (A) Lysis kinetics obtained by BLI assay of effector T cells transduced with Radium-4 TCR (red), Radium-6 (Rad6) TCR (blue), or mock-transduced T cells (black) cocultured with a HLA-DP04+ HLA-DR04+ EBV-LCL cell line, loaded or not with hTERT 611–626 peptide (phTERT), TGF-βRII frameshift mutated 127–145 peptide (p621), or NY-ESO-1 157–170 peptide (pNY-ESO-1). Representative graphs of two experiments. Data represent mean ± SD of triplicates. Statistics were calculated on the 22-h time point. (B) Corresponding intracellular IFN-γ and TNF-α production of the same effector T cells (CD4+ cells) cocultured in a similar fashion as described in (A). Bars represent mean ± SD of triplicates. (C) Measurements of the Annexin V signal restricted to phase/GFP+ detected objects of ESTDAB-1000 spheroids in the presence of Rad-4 TCR, Rad-6 TCR, or mock-transduced T cells. Data represent mean ± SD of 36-plicates. Pooled metrics of two independent experiments are shown. (D) Measurements of GFP signal of ESTDAB-1000 spheroids in the presence of Rad-4 TCR, Rad-6 TCR, or mock-transduced T cells. Data represent mean ± SD of 36-plicates. Pooled metrics of two experiments are shown. (E) Representative micrographs of ESTDAB-1000 spheroids in the presence of Radium-4 or Radium-6 TCR-transduced cells or mock T cells. Green and red signals come from ESTDAB-1000 GFP+ cells and Annexin V, respectively. Scale bar represents 250 μm.
Figure 3
Figure 3
Radium-4 TCR Recognizes Endogenous Antigen (A) Lysis kinetics obtained by measuring the Annexin V signal of effector T cells transduced with Radium-4 TCR cocultured with patient-derived melanoma cell lines (hTERT+/HLA-DP04+ or HLA-DP03+) or the K562 cell line (hTERT+/HLA-DP04). Pooled graphs of two experiments. Data represent mean ± SEM of dodecaplicates. (B) Lysis kinetics obtained by measuring the Annexin V signal of effector T cells transduced with Radium-4 TCR cocultured with spheroids of patient-derived melanoma cell lines (hTERT+/HLA-DP04+ or HLA-DP03+) or the K562 cell line (hTERT+/HLA-DP04). Pooled graphs of two experiments. Data represent mean ± SEM of hexaplicates. (C) Representative micrographs of HM8, MM369, and K562 spheroids in the presence of Radium-4 or mock T cells. Red signals come from Annexin V. Scale bar, 250 μm. (D) Annexin V signal after coculture of effector T cell patient ascites cells measured by live-cell imaging. Data represent mean ± SD of octoplicates. Statistics were calculated on the 10-h time point. (E) Representative micrographs of T cells and patient ascites coculture. Red signals come from Annexin V. Scale bar, 250 μm.
Figure 4
Figure 4
Transduced Radium-4 T Cells Control Tumor Load In Vivo upon Intraperitoneal (i.p.) Administration (A) NSG mice were engrafted with GFP/Luc+ ESTDAB-1000 tumors i.p., and 3 days after tumor inoculation, mice were randomized and received i.p. injections of mock or Radium-4 TCR-transduced T cells (n = 10 for each group) for a total of 4 injections. (B) ESTDAB-1000 tumor growth curves after mock or Radium-4 TCR-transduced T cell transfer. Data represent means ± SD of two independent experiments pooled. (C) Kaplan-Meier survival curves of mice shown in (D). Survival curves were analyzed with a Mantel-Cox (log-rank) test. (D) Micrographs obtained from In Vivo Imaging System (IVIS) of mice inoculated with ESTDAB-1000 and treated with mock or Radium-4 TCR-transduced T cells. (E) Percentage of GFP/CD3+ cells in single-cell suspensions made from tumor or mesenteric lymph node tissues extracted from mice treated with transduced Radium-4 or mock-transduced T cells. Representative flow diagrams from three independent animals. (F) Summary of the proportion of GFP/CD3+ cells shown in €. Bars represent mean ± SD. Statistical validation was realized between Radium-4 and mock conditions.
Figure 5
Figure 5
Transduced Radium-4 T Cells Control Tumor Load In Vivo upon Intravenous (i.v.) Administration (A) NSG mice were engrafted with GFP/Luc+ ESTDAB-1000 tumors subcutaneously, and 3 days after tumor inoculation, mice were randomized and received i.v. injections of mock-transduced, Radium-4 TCR-transduced, or Radium-6 TCR-transduced T cells or no treatment (n = 10 for each group; 5 for the untreated condition) with a total of 4 injections. (B and C) ESTDAB-1000 tumor growth curves after no treatment or mock, Radium-4 TCR, or Radium-6 TCR T cell transfer. Tumor load was measured by IVIS (B) or caliper (C). Data represent means ± SD of two independent experiments pooled. (D) Corresponding Kaplan-Meier survival curves. Survival curves were analyzed with a Mantel-Cox (log-rank) test. (E) Micrographs obtained from IVIS of mice inoculated with ESTDAB-1000 and left untreated or treated with mock-transduced T cells, Radium-6 TCR-transduced T cells, or Radium-4 TCR-transduced T cells. (F) Percentage of GFP/CD3+ cells in single-cell suspensions made from tumor or spleen tissues. Representative flow diagrams from three independent animals.
Figure 6
Figure 6
Redirected Radium-4 T Cells Do Not Recognize Hematopoietic Cells (A) Healthy donor bone marrow progenitor cells were cocultured with autologous T cells, either transfected with Radium-4 TCR mRNA or mock-transfected T cells for 6 h at an E:T ratio of 10:1. The cells were then plated in semisolid methylcellulose progenitor culture for 14 days and scored for the presence of colony-forming unit (CFU)-erythrocyte (E), red; CFU-granulocyte macrophages (GMs), white colonies; and in gray the total number of colonies. Data represent mean ± SD of triplicates. (B) Fold increase in cytokine production (IFN-γ, TNF-α) measured by flow cytometry upon coculture of stably transduced Radium-4 TCR T cells or mock-transduced T cells from three donors (two HLA-DP04+ and one HLA-D04) with their respective PBMCs. Data represent mean ± SD of triplicates. (C) Percentage of CD107a+-transduced T cells from three donors, as described in (B) cocultured with purified subpopulations of PBMC. PMA-ionomycin and hTERT 611–626 peptide-loaded HLA-DP04+ EBV-LCL stimulations were used as a positive control.

Similar articles

Cited by

References

    1. Maude S.L., Frey N., Shaw P.A., Aplenc R., Barrett D.M., Bunin N.J., Chew A., Gonzalez V.E., Zheng Z., Lacey S.F. Chimeric antigen receptor T cells for sustained remissions in leukemia. N. Engl. J. Med. 2014;371:1507–1517. - PMC - PubMed
    1. Lee D.W., Kochenderfer J.N., Stetler-Stevenson M., Cui Y.K., Delbrook C., Feldman S.A., Fry T.J., Orentas R., Sabatino M., Shah N.N. T cells expressing CD19 chimeric antigen receptors for acute lymphoblastic leukaemia in children and young adults: a phase 1 dose-escalation trial. Lancet. 2015;385:517–528. - PMC - PubMed
    1. Hinrichs C.S., Restifo N.P. Reassessing target antigens for adoptive T-cell therapy. Nat. Biotechnol. 2013;31:999–1008. - PMC - PubMed
    1. Zanetti M. A second chance for telomerase reverse transcriptase in anticancer immunotherapy. Nat. Rev. Clin. Oncol. 2017;14:115–128. - PubMed
    1. Harley C.B., Kim N.W., Prowse K.R., Weinrich S.L., Hirsch K.S., West M.D., Bacchetti S., Hirte H.W., Counter C.M., Greider C.W. Telomerase, cell immortality, and cancer. Cold Spring Harb. Symp. Quant. Biol. 1994;59:307–315. - PubMed

Publication types

Substances