

Patient-derived xenograft (PDX) models of colorectal carcinoma (CRC) as a platform for chemosensitivity and biomarker analysis in personalized medicine
- PMID: 33212364
- PMCID: PMC7680704
- DOI: 10.1016/j.neo.2020.11.005
Patient-derived xenograft (PDX) models of colorectal carcinoma (CRC) as a platform for chemosensitivity and biomarker analysis in personalized medicine
Abstract
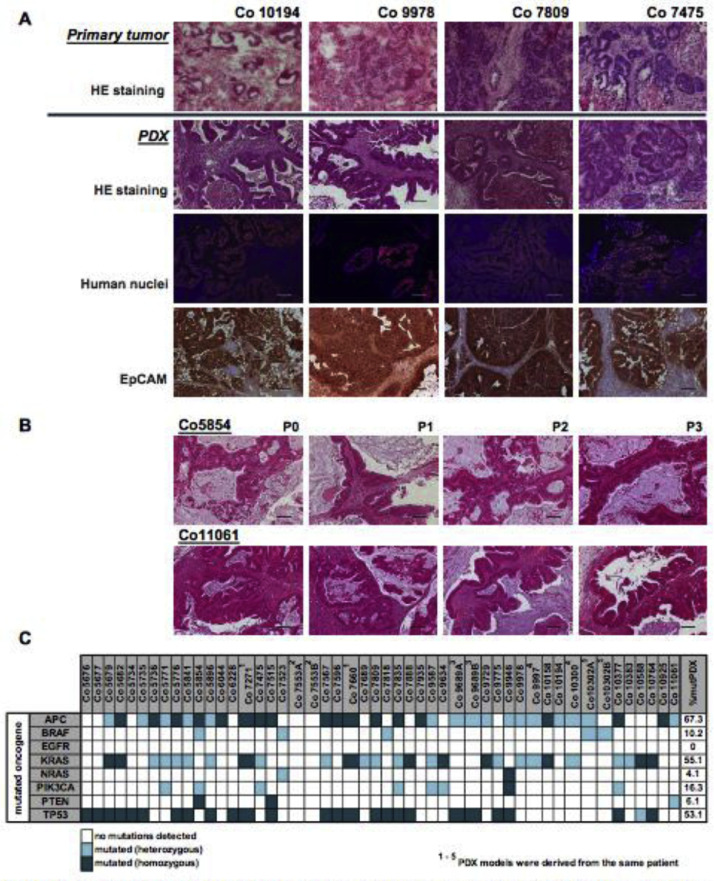
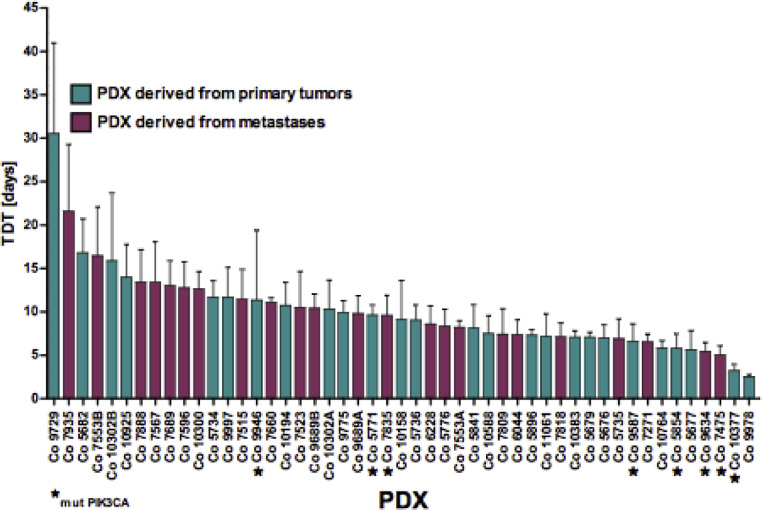
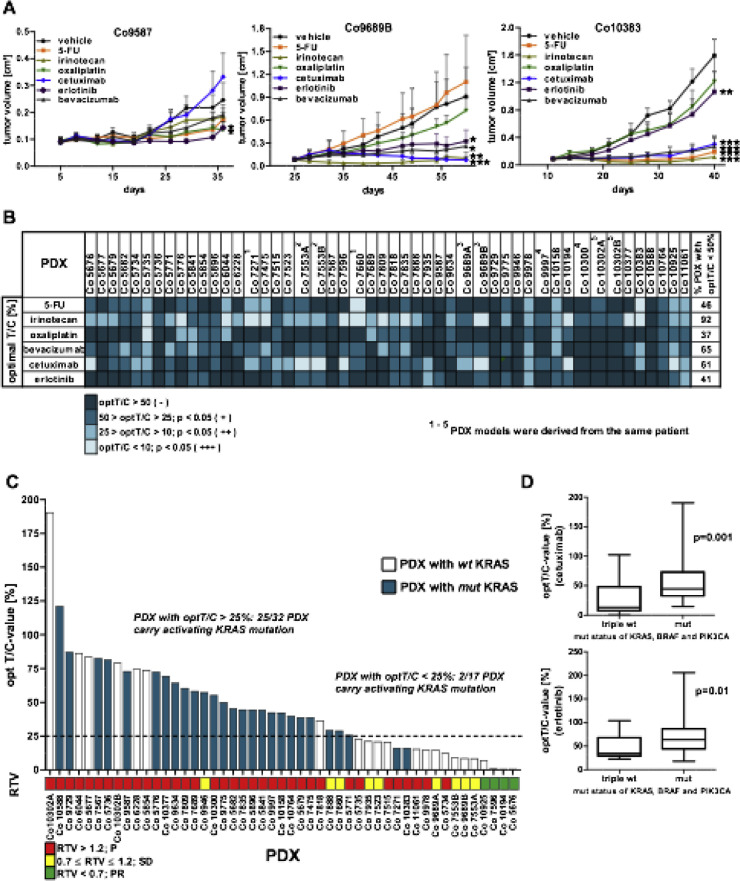
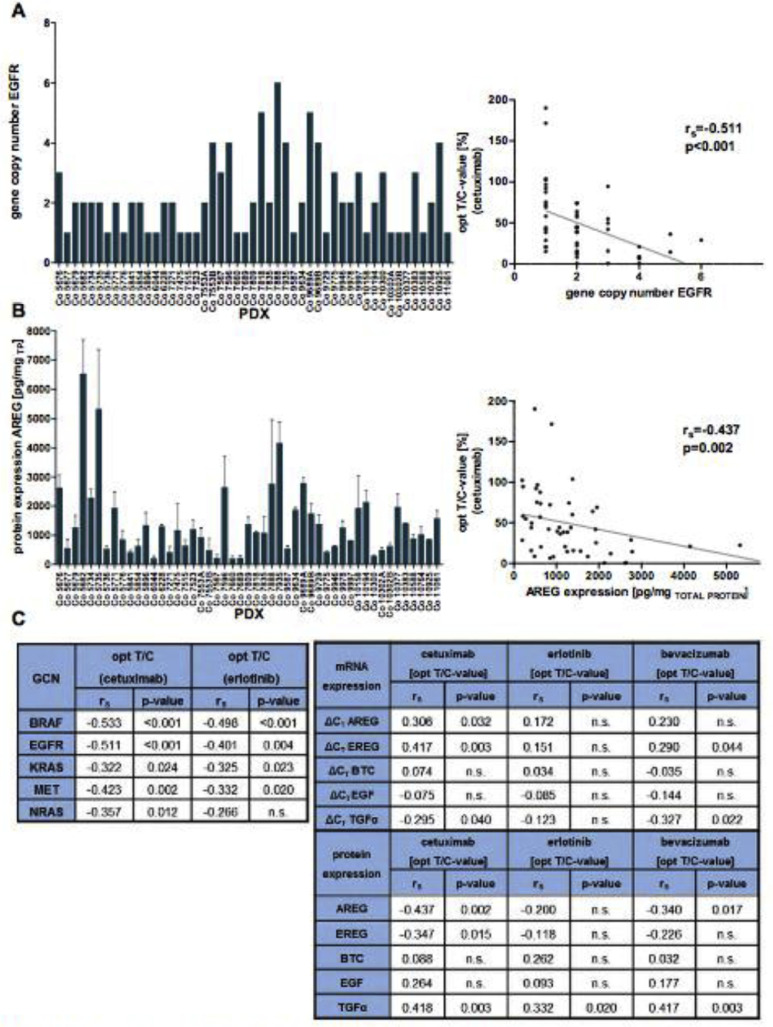
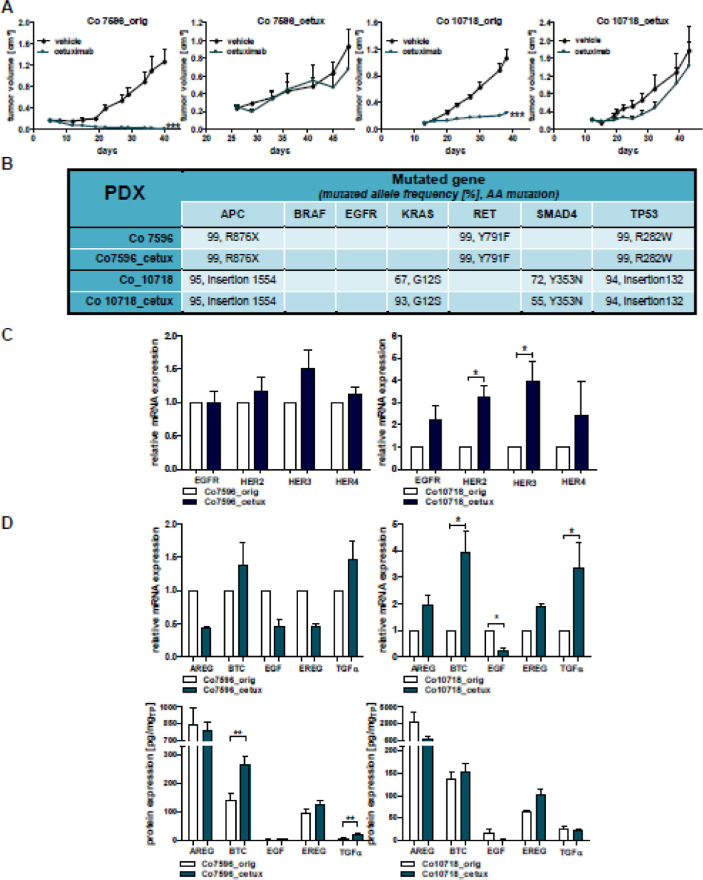
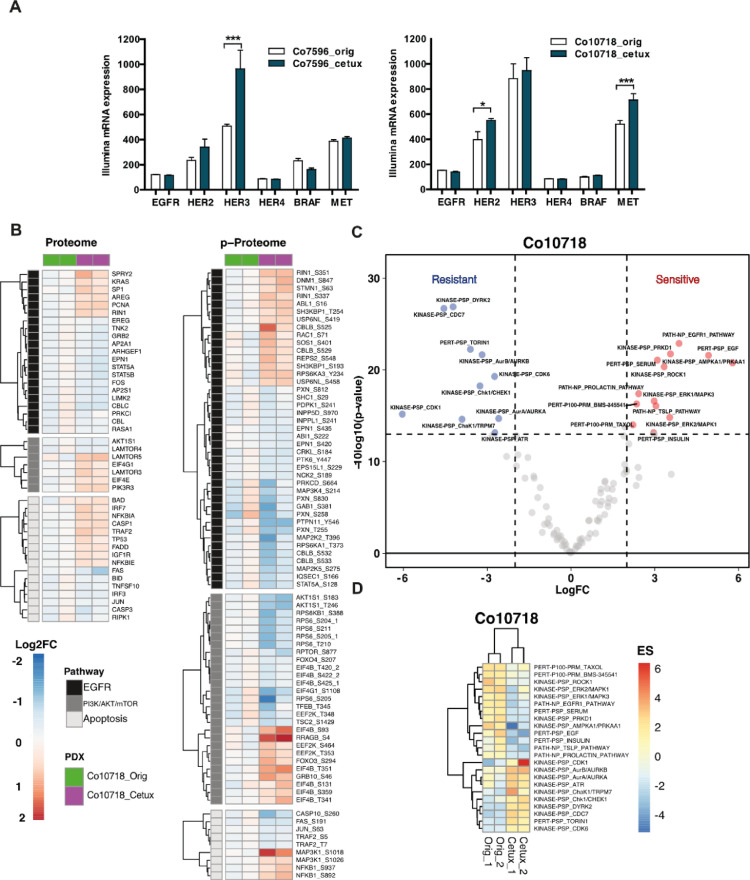
Patient-derived xenograft (PDX) tumor models represent a valuable platform for identifying new biomarkers and novel targets, to evaluate therapy response and resistance mechanisms. This study aimed at establishment, characterization and therapy testing of colorectal carcinoma-derived PDX. We generated 49 PDX and validated identity between patient tumor and corresponding PDX. Sensitivity of PDX toward conventional and targeted drugs revealed that 92% of PDX responded toward irinotecan, 45% toward 5-FU, 65% toward bevacizumab, and 61% toward cetuximab. Expression of epidermal growth factor receptor (EGFR) ligands correlated to the sensitivity toward cetuximab. Proto-oncogene B-RAF, EGFR, Kirsten rat sarcoma virus oncogene homolog gene copy number correlated positively with cetuximab and erlotinib sensitivity. The mutational analyses revealed an individual mutational profile of PDX and mainly identical profiles of PDX from primary tumor vs corresponding metastasis. Mutation in PIK3CA was a determinant of accelerated tumor doubling time. PDX with wildtype Kirsten rat sarcoma virus oncogene homolog, proto-oncogene B-RAF, and phosphatidylinositol-4,5-bisphosphate 3-kinaseM catalytic subunit alfa showed higher sensitivity toward cetuximab and erlotinib. To study the molecular mechanism of cetuximab resistance, cetuximab resistant PDX models were generated, and changes in HER2, HER3, betacellulin, transforming growth factor alfa were observed. Global proteome and phosphoproteome profiling showed a reduction in canonical EGFR-mediated signaling via PTPN11 (SHP2) and AKT1S1 (PRAS40) and an increase in anti-apoptotic signaling as a consequence of acquired cetuximab resistance. This demonstrates that PDX models provide a multitude of possibilities to identify and validate biomarkers, signaling pathways and resistance mechanisms for clinically relevant improvement in cancer therapy.
Keywords: Colorectal carcinoma; In vivo drug testing; Patient-derived xenograft models; Personalized medicine.
Copyright © 2020 The Authors. Published by Elsevier Inc. All rights reserved.
Figures
Similar articles
-
Secondary resistance to anti-EGFR therapy by transcriptional reprogramming in patient-derived colorectal cancer models.Genome Med. 2021 Jul 16;13(1):116. doi: 10.1186/s13073-021-00926-7. Genome Med. 2021. PMID: 34271981 Free PMC article.
-
Mouse PDX Trial Suggests Synergy of Concurrent Inhibition of RAF and EGFR in Colorectal Cancer with BRAF or KRAS Mutations.Clin Cancer Res. 2017 Sep 15;23(18):5547-5560. doi: 10.1158/1078-0432.CCR-16-3250. Epub 2017 Jun 13. Clin Cancer Res. 2017. PMID: 28611205
-
The genomic landscape of response to EGFR blockade in colorectal cancer.Nature. 2015 Oct 8;526(7572):263-7. doi: 10.1038/nature14969. Epub 2015 Sep 30. Nature. 2015. PMID: 26416732 Free PMC article.
-
Pharmacogenomics of intrinsic and acquired pharmacoresistance in colorectal cancer: Toward targeted personalized therapy.Drug Resist Updat. 2015 May;20:39-70. doi: 10.1016/j.drup.2015.05.003. Epub 2015 May 22. Drug Resist Updat. 2015. PMID: 26027741 Review.
-
Molecular Testing for the Treatment of Advanced Colorectal Cancer: An Overview.Methods Mol Biol. 2018;1765:281-297. doi: 10.1007/978-1-4939-7765-9_18. Methods Mol Biol. 2018. PMID: 29589315 Review.
Cited by
-
HDACi combination therapy with IDO1i remodels the tumor microenvironment and boosts antitumor efficacy in colorectal cancer with microsatellite stability.J Nanobiotechnology. 2024 Dec 16;22(1):753. doi: 10.1186/s12951-024-02936-0. J Nanobiotechnology. 2024. PMID: 39676171 Free PMC article.
-
Establishment and Thorough Characterization of Xenograft (PDX) Models Derived from Patients with Pancreatic Cancer for Molecular Analyses and Chemosensitivity Testing.Cancers (Basel). 2023 Dec 8;15(24):5753. doi: 10.3390/cancers15245753. Cancers (Basel). 2023. PMID: 38136299 Free PMC article.
-
Leveraging liquid biopsy to uncover resistance mechanisms and guide personalized immunotherapy.Transl Oncol. 2025 Sep;59:102445. doi: 10.1016/j.tranon.2025.102445. Epub 2025 Jun 24. Transl Oncol. 2025. PMID: 40561796 Free PMC article. Review.
-
Synergistic effect of PARP inhibitor and BRD4 inhibitor in multiple models of ovarian cancer.J Cell Mol Med. 2023 Mar;27(5):634-649. doi: 10.1111/jcmm.17683. Epub 2023 Feb 8. J Cell Mol Med. 2023. PMID: 36753396 Free PMC article.
-
Patient-derived xenograft model in colorectal cancer basic and translational research.Animal Model Exp Med. 2023 Feb;6(1):26-40. doi: 10.1002/ame2.12299. Epub 2022 Dec 21. Animal Model Exp Med. 2023. PMID: 36543756 Free PMC article. Review.
References
-
- Siegel R.L., Miller K.D., Goding Sauer A., Fedewa S.A., Butterly L.F., Anderson J.C., Cercek A., Smith R.A., Jemal A. Colorectal cancer statistics. CA Cancer J Clin. 2020;70:145–164. - PubMed
-
- Hanahan D., Weinberg R.A. Hallmarks of cancer: the next generation. Cell. 2011;144:646–674. - PubMed
-
- De Santis C.E., Lin C.C., Mariotto A.B., Siegel R.L., Stein K.D., Kramer J.L., Alteri R., Robbins A.S., Jemal A. Cancer treatment and survivorship statistics. CA Cancer J Clin. 2014;64:252–271. - PubMed
-
- Saltz L.B., Meropol N.J., Loehrer P.J.S., Needle M.N., Kopit J., Mayer R.J. Phase II trial of cetuximab in patients with refractory colorectal cancer that expresses the epidermal growth factor receptor. J Clin Oncol. 2004;22:1201–1208. - PubMed
Publication types
MeSH terms
Substances
LinkOut - more resources
Full Text Sources
Other Literature Sources
Medical
Research Materials
Miscellaneous
