. 2020 Nov 17;21(22):8669.
doi: 10.3390/ijms21228669.

The PI3K/AKT Pathway Is Activated by HGF in NT2D1 Non-Seminoma Cells and Has a Role in the Modulation of Their Malignant Behavior

Affiliations

The PI3K/AKT Pathway Is Activated by HGF in NT2D1 Non-Seminoma Cells and Has a Role in the Modulation of Their Malignant Behavior

Luisa Gesualdi et al. Int J Mol Sci. .

Abstract

Overactivation of the c-MET/HGF system is a feature of many cancers. We previously reported that type II testicular germ cell tumor (TGCT) cells express the c-MET receptor, forming non-seminomatous lesions that are more positive compared with seminomatous ones. Notably, we also demonstrated that NT2D1 non-seminomatous cells (derived from an embryonal carcinoma lesion) increase their proliferation, migration, and invasion in response to HGF. Herein, we report that HGF immunoreactivity is more evident in the microenvironment of embryonal carcinoma biopsies with respect to seminomatous ones, indicating a tumor-dependent modulation of the testicular niche. PI3K/AKT is one of the signaling pathways triggered by HGF through the c-MET activation cascade. Herein, we demonstrated that phospho-AKT increases in NT2D1 cells after HGF stimulation. Moreover, we found that this pathway is involved in HGF-dependent NT2D1 cell proliferation, migration, and invasion, since the co-administration of the PI3K inhibitor LY294002 together with HGF abrogates these responses. Notably, the inhibition of endogenous PI3K affects collective cell migration but does not influence proliferation or chemotactic activity. Surprisingly, LY294002 administered without the co-administration of HGF increases cell invasion at levels comparable to the HGF-administered samples. This paradoxical result highlights the role of the testicular microenvironment in the modulation of cellular responses and stimulates the study of the testicular secretome in cancer lesions.

Keywords: HGF; PI3K; PI3K inhibitors; TGCTs; c-MET; cancer therapy.


Conflict of interest statement

The authors declare no conflict of interest.

Figures

Figure 1
Figure 1
Representative images of HGF immunoreactivity (A,D) in seminoma (SE) and embryonal carcinoma (EC) samples (D), and their peritumoral areas (A). Representative intensity profiles of immunohistochemical experiments are shown in panel (B) (peritumoral areas) and (E) tumoral lesions. (C) Graphical representation of the quantification of HGF immunostaining in epithelial and stromal parts of SE and EC peritumoral areas. (F) Graphical representation of the quantification of HGF immunostaining in SE and EC samples. Four different SE histological samples and two EC histological samples were examined. Bar: 100 µm. * p < 0.005; ** p < 0.001.
Figure 1
Figure 1
Representative images of HGF immunoreactivity (A,D) in seminoma (SE) and embryonal carcinoma (EC) samples (D), and their peritumoral areas (A). Representative intensity profiles of immunohistochemical experiments are shown in panel (B) (peritumoral areas) and (E) tumoral lesions. (C) Graphical representation of the quantification of HGF immunostaining in epithelial and stromal parts of SE and EC peritumoral areas. (F) Graphical representation of the quantification of HGF immunostaining in SE and EC samples. Four different SE histological samples and two EC histological samples were examined. Bar: 100 µm. * p < 0.005; ** p < 0.001.
Figure 2
Figure 2
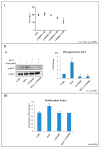
(I) Cell death Flow Cytometry nalysis. Graphical representation of the percentage of live cells obtained by culturing NT2D1 cells with different concentrations of LY294002 for 48 h (* p < 0.01; # p < 0.001). (II) Western blot analyses of p-AKT and total AKT in NT2D1 cell lines cultured in basal conditions (CTRL), with 5 µM LY294002, with 40 ng/mL HGF, and with LY294002 + HGF. On the left: representative images of p-AKT and total AKT bands, obtained by using stain-free technology (Bio-Rad Laboratories Inc., Hercules, CA, USA), are shown. On the right: the densitometric analysis of pAKT/AKT bands is reported (*; # p < 0.05). (III) Graphical representation of the number of NT2D1 cells cultured for 48 h in control conditions, with HGF, with LY294002, or their combination. Cells cultured with HGF had a high proliferative rate (* p < 0.001). Results were expressed in fold change, with the control considered as 1 (±standard error of the mean (SEM)).
Figure 3
Figure 3
Scanning electron microscopy analysis. Representative images of NT2D1 cells cultured for 24 h in control conditions, or treated with HGF, LY294002, or their combination. Scale bar: 10 μm.
Figure 4
Figure 4
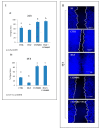
Effect of LY294002 on cell NT2D1 cell migration. (I) Quantitative analysis of chemoattracted NT2D1 cells. The values were calculated as “fold change” (±S.E.M.) compared to the control, which was considered as 1. The use of LY294002 in combination with HGF abrogates the migratory effect induced by HGF. (II) Representative images of NT2D1 cell migration. Images were recorded at 40× magnification. (III) Table illustrating the number of migrating cells/filter (* p < 0.001). At least three independent experiments were performed in triplicate.
Figure 5
Figure 5
Effect of LY294002 on NT2D1 cell invasion. (I) Quantitative analysis of invading cells. Results are expressed as fold change (±S.E.M.) and the control condition is considered as 1 (b vs. a; p < 0.05). (II) Representative phase contrast images of invading cells under different culture conditions. Images were recovered at 10× magnification. (III) Table illustrating the number of invading cells/filter in all experimental conditions. At least three independent experiments were performed in triplicate.
Figure 6
Figure 6
Effect of LY294002 on NT2D1 cell collective migration. (I) Quantitative analysis of wound closure after 24 h (a) and 48 h (b). Data are expressed as the mean percentage of residual open area compared with the respective T0 condition. At 24 h, the decrease of open area in HGF-treated cells was not statistically significant compared with the control condition, but the closure was almost complete at 48 h (a vs. b, p < 0.001). LY294002 in combination with HGF at 24 h (b vs. a, p < 0.01) and 48 h (c vs. b, p < 0.001) abrogated the migratory effect induced by HGF. LY294002 alone was also able to inhibit the collective migration of the cells when cultured for 24 h (b vs. a, p < 0.05) and 48 h (c vs. a, p < 0.001). (II) Representative images of nuclei in the wound healing assay, recovered immediately after insert removal (T0) and 48 h after wounding. Images were photographed at 10× magnification (scale bar: 300 µm). At least three independent experiments were performed in triplicate.
Figure 7
Figure 7
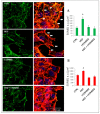
Left panel: representative double-fluorescence confocal images of vinculin immunostaining (green signal) and F-actin (red signal) to identify focal adhesion (FA) organization in NT2D1 cells during the wound healing experiment. Left: vinculin immunostaining (green signal); right: merged picture of vinculin with F-actin (red signal). White arrows indicate FAs. Scale bar: 37.5 µm. Right panel: (A) quantitative analysis of total vinculin carried out by Leica confocal software SUM(I). (B) Quantitative analysis of total F-actin carried out by Leica confocal software SUM(I). (* p < 0.05); a.u. = arbitrary units.
Figure 8
Figure 8
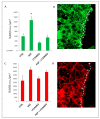
(A) Quantitative analysis of vinculin at the leading edge of cell migration carried out by confocal microscopy. (* p < 0.05) (B) Representative image of vinculin immunofluorescence (green), in which the region that has been considered for vinculin quantification has been highlighted (dashed lines; (SUM(I)/µm2). (C) Quantitative analysis of F-actin at the leading edge of cell migration carried out by confocal microscopy. (D) Representative image of F-actin staining (red) in the highlighted region (dashed lines) has been considered for F-actin quantification (SUM(I)/µm2).

Comment in

Similar articles

Cited by

References

    1. Nason G.J., Chung P., Warde P., Huddart R., Albers P., Kollmannsberger C., Booth C.M., Hansen A.R., Bedard P.L., Einhorn L., et al. Controversies in the management of clinical stage 1 testis cancer. Can. Urol. Assoc. J. 2020 doi: 10.5489/cuaj.6722. - DOI - PMC - PubMed
    1. Lutke Holzik M.F., Sijmons R.H., Hoekstra-Weebers J.E., Sleijfer D.T., Hoekstra H.J. Clinical and genetic aspects of testicular germ cell tumours. Hered. Cancer Clin. Pract. 2008;6:3–14. doi: 10.1186/1897-4287-6-1-3. - DOI - PMC - PubMed
    1. Lobo J., Jeronimo C., Henrique R. Cisplatin Resistance in testicular germ cell tumors: Current challenges from various perspectives. Cancers. 2020;12:1601. doi: 10.3390/cancers12061601. - DOI - PMC - PubMed
    1. Pichler R., Leonhartsberger N., Stohr B., Horninger W., Steiner H. Two cycles of cisplatin-based chemotherapy for low-volume stage II seminoma: Results of a retrospective, single-center case series. Chemotherapy. 2012;58:405–410. doi: 10.1159/000345701. - DOI - PubMed
    1. Inoue Y., Nakamura T., Nakanishi H., Oishi M., Hongo F., Okihara K., Mizutani S., Kuroda J., Ukimura O. Therapy-related acute myeloid leukemia and myelodysplastic syndrome among refractory germ cell tumor patients. Int. J. Urol. 2018;25:678–683. doi: 10.1111/iju.13597. - DOI - PubMed

MeSH terms

Substances