

Kinome Array Profiling of Patient-Derived Pancreatic Ductal Adenocarcinoma Identifies Differentially Active Protein Tyrosine Kinases
- PMID: 33213062
- PMCID: PMC7698519
- DOI: 10.3390/ijms21228679
Kinome Array Profiling of Patient-Derived Pancreatic Ductal Adenocarcinoma Identifies Differentially Active Protein Tyrosine Kinases
Abstract
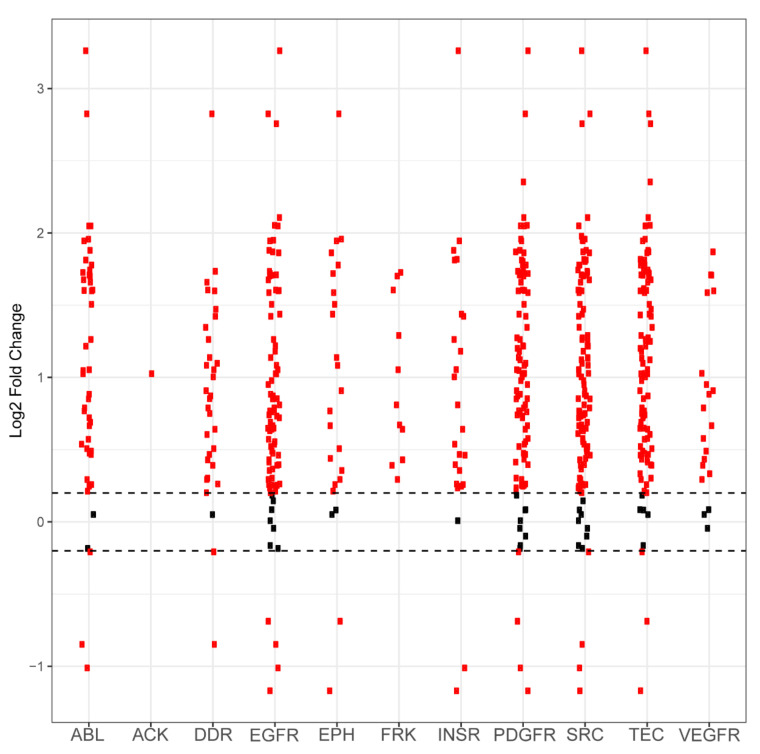
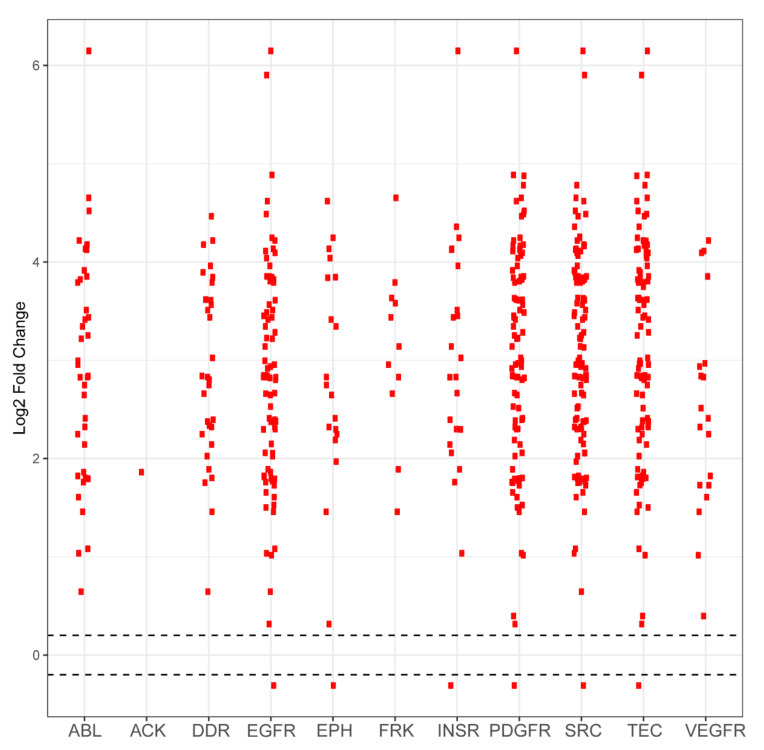
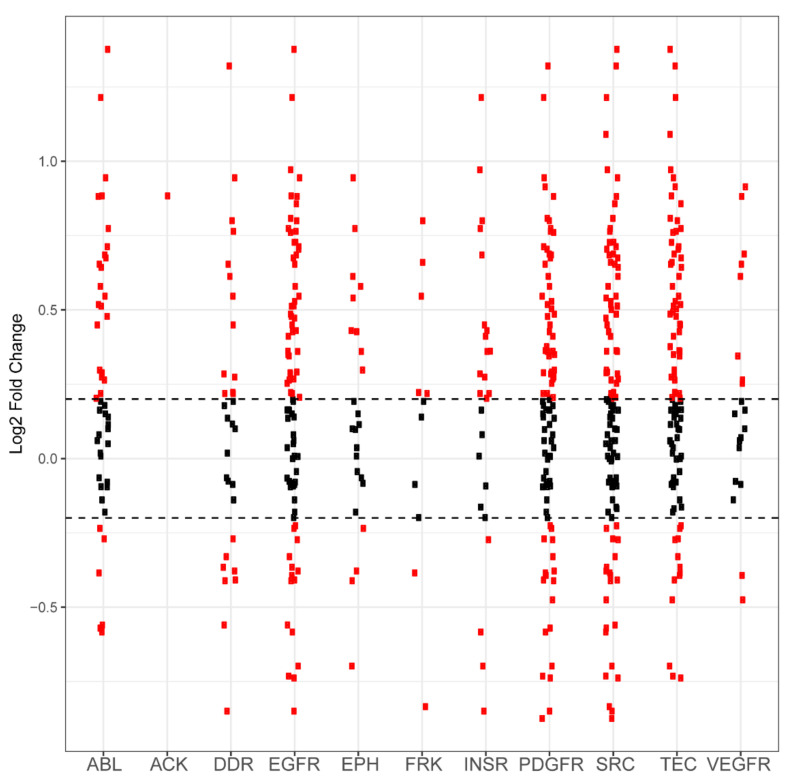
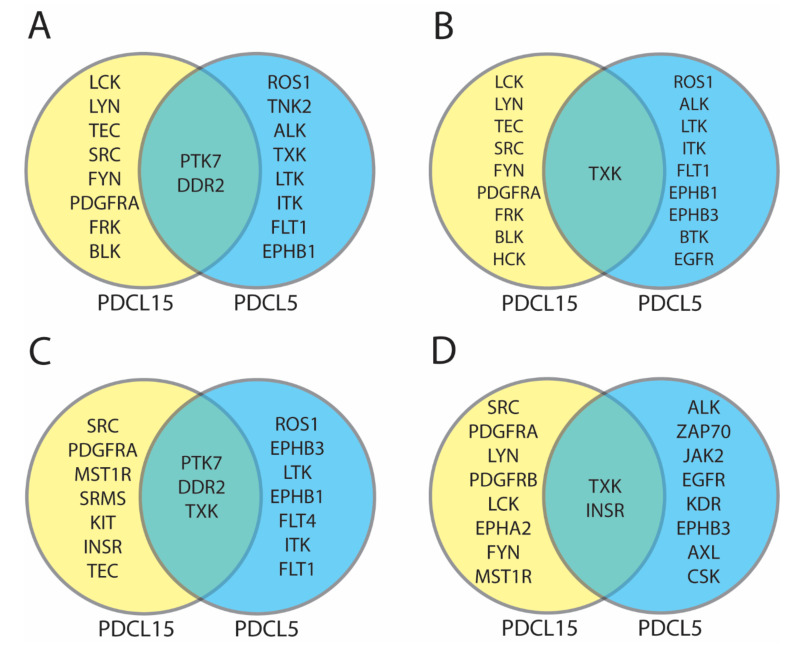
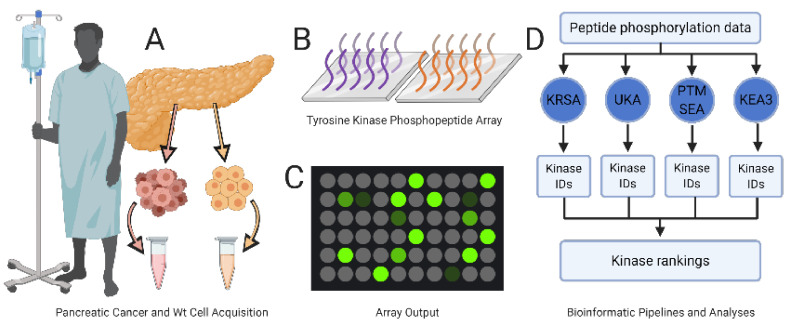
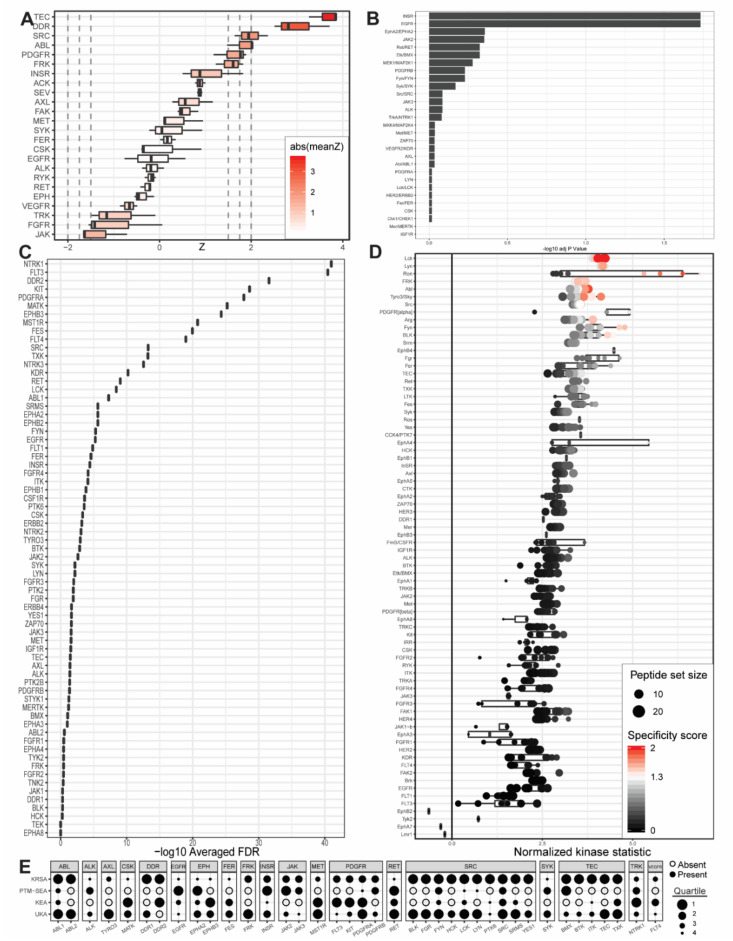
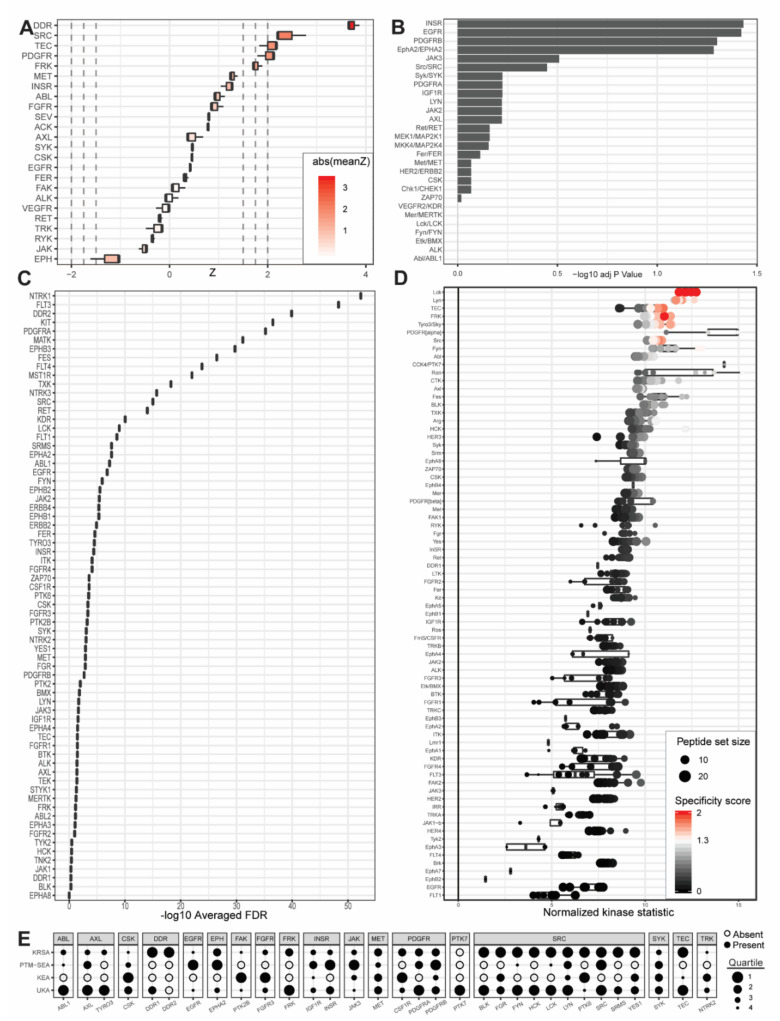
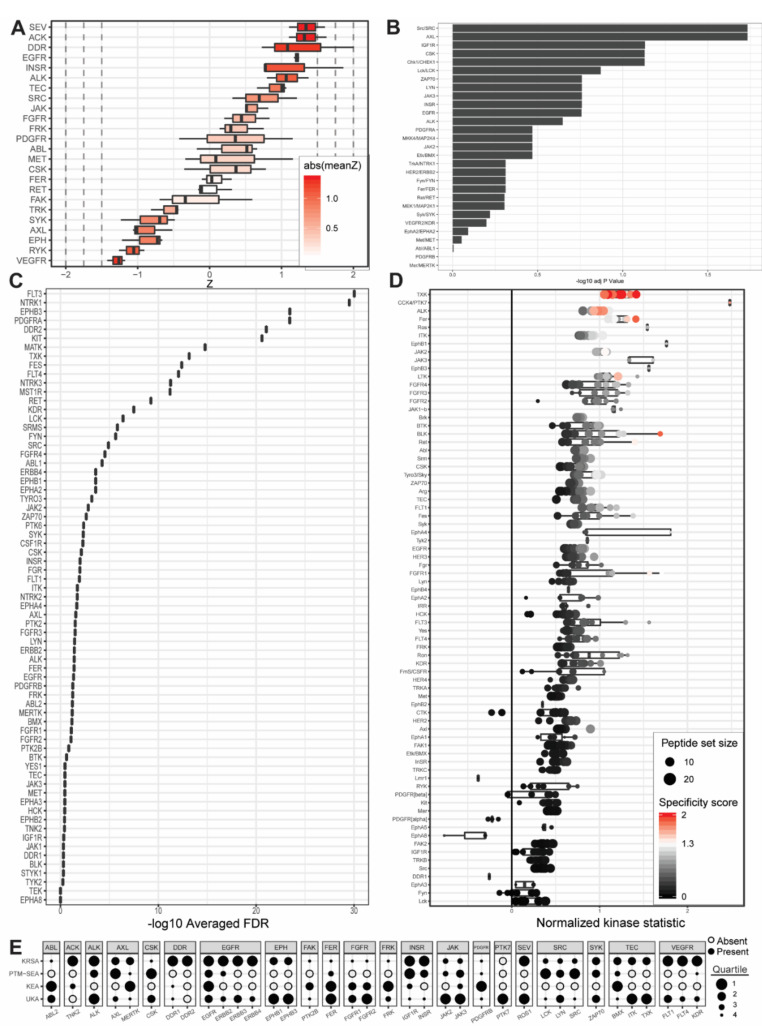
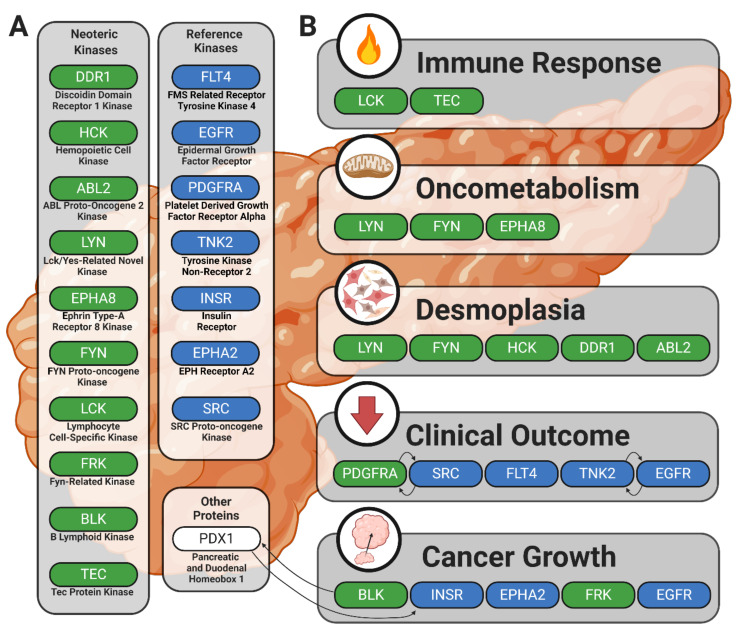
Pancreatic cancer remains one of the most difficult malignancies to treat. Minimal improvements in patient outcomes and persistently abysmal patient survival rates underscore the great need for new treatment strategies. Currently, there is intense interest in therapeutic strategies that target tyrosine protein kinases. Here, we employed kinome arrays and bioinformatic pipelines capable of identifying differentially active protein tyrosine kinases in different patient-derived pancreatic ductal adenocarcinoma (PDAC) cell lines and wild-type pancreatic tissue to investigate the unique kinomic networks of PDAC samples and posit novel target kinases for pancreatic cancer therapy. Consistent with previously described reports, the resultant peptide-based kinome array profiles identified increased protein tyrosine kinase activity in pancreatic cancer for the following kinases: epidermal growth factor receptor (EGFR), fms related receptor tyrosine kinase 4/vascular endothelial growth factor receptor 3 (FLT4/VEGFR-3), insulin receptor (INSR), ephrin receptor A2 (EPHA2), platelet derived growth factor receptor alpha (PDGFRA), SRC proto-oncogene kinase (SRC), and tyrosine kinase non receptor 2 (TNK2). Furthermore, this study identified increased activity for protein tyrosine kinases with limited prior evidence of differential activity in pancreatic cancer. These protein tyrosine kinases include B lymphoid kinase (BLK), Fyn-related kinase (FRK), Lck/Yes-related novel kinase (LYN), FYN proto-oncogene kinase (FYN), lymphocyte cell-specific kinase (LCK), tec protein kinase (TEC), hemopoietic cell kinase (HCK), ABL proto-oncogene 2 kinase (ABL2), discoidin domain receptor 1 kinase (DDR1), and ephrin receptor A8 kinase (EPHA8). Together, these results support the utility of peptide array kinomic analyses in the generation of potential candidate kinases for future pancreatic cancer therapeutic development.
Keywords: cancer metabolism; desmoplasia; fibrosis; inflammation; kinase inhibitors; kinase signatures; kinomic networks; pancreatic cancer; peptide array; transcription factors.
Conflict of interest statement
T.T. and F.N. are employed by PamGene International B.V. The remaining authors have declared that no conflicts of interests exist.
Figures
Similar articles
-
Emerging Kinase Therapeutic Targets in Pancreatic Ductal Adenocarcinoma and Pancreatic Cancer Desmoplasia.Int J Mol Sci. 2020 Nov 21;21(22):8823. doi: 10.3390/ijms21228823. Int J Mol Sci. 2020. PMID: 33233470 Free PMC article. Review.
-
The KRAS-regulated kinome identifies WEE1 and ERK coinhibition as a potential therapeutic strategy in KRAS-mutant pancreatic cancer.J Biol Chem. 2021 Nov;297(5):101335. doi: 10.1016/j.jbc.2021.101335. Epub 2021 Oct 22. J Biol Chem. 2021. PMID: 34688654 Free PMC article.
-
The kinase Mirk/Dyrk1B mediates cell survival in pancreatic ductal adenocarcinoma.Cancer Res. 2006 Apr 15;66(8):4149-58. doi: 10.1158/0008-5472.CAN-05-3089. Cancer Res. 2006. PMID: 16618736
-
The inhibition of SRC family kinase suppresses pancreatic cancer cell proliferation, migration, and invasion.Pancreas. 2014 Jul;43(5):768-76. doi: 10.1097/MPA.0000000000000103. Pancreas. 2014. PMID: 24763074
-
Inhibition of SRC family kinases and receptor tyrosine kinases by dasatinib: possible combinations in solid tumors.Clin Cancer Res. 2011 Sep 1;17(17):5546-52. doi: 10.1158/1078-0432.CCR-10-2616. Epub 2011 Jun 13. Clin Cancer Res. 2011. PMID: 21670084 Review.
Cited by
-
Emerging strategies and translational advancements of DDR1 in oncology.Discov Oncol. 2025 Mar 30;16(1):428. doi: 10.1007/s12672-025-02107-z. Discov Oncol. 2025. PMID: 40159417 Free PMC article. Review.
-
The active kinome: The modern view of how active protein kinase networks fit in biological research.Curr Opin Pharmacol. 2022 Feb;62:117-129. doi: 10.1016/j.coph.2021.11.007. Epub 2021 Dec 27. Curr Opin Pharmacol. 2022. PMID: 34968947 Free PMC article. Review.
-
Mapping the Protein Kinome: Current Strategy and Future Direction.Cells. 2023 Mar 17;12(6):925. doi: 10.3390/cells12060925. Cells. 2023. PMID: 36980266 Free PMC article. Review.
-
Suppressing Hepatic UGT1A1 Increases Plasma Bilirubin, Lowers Plasma Urobilin, Reorganizes Kinase Signaling Pathways and Lipid Species and Improves Fatty Liver Disease.Biomolecules. 2023 Jan 29;13(2):252. doi: 10.3390/biom13020252. Biomolecules. 2023. PMID: 36830621 Free PMC article.
-
Pancreatic Lineage Specifier PDX1 Increases Adhesion and Decreases Motility of Cancer Cells.Cancers (Basel). 2021 Aug 30;13(17):4390. doi: 10.3390/cancers13174390. Cancers (Basel). 2021. PMID: 34503200 Free PMC article.
References
-
- Jagade J., Amrutkar M., Katariya D., Wankhade A., Kale A., Undale V. Role of protein kinases in signal transduction and their inhibitors. [(accessed on 9 January 2020)];Pharmacologyonline. 2010 Available online: https://www.researchgate.net/profile/Manoj_Amrutkar/publication/23055866....
MeSH terms
Substances
Grants and funding
LinkOut - more resources
Full Text Sources
Medical
Research Materials
Miscellaneous
