

Contrasting genetic variation and positive selection followed the divergence of NBS-encoding genes in Asian and European pears
- PMID: 33213380
- PMCID: PMC7678159
- DOI: 10.1186/s12864-020-07226-1
Contrasting genetic variation and positive selection followed the divergence of NBS-encoding genes in Asian and European pears
Abstract
Background: The NBS disease-related gene family coordinates the inherent immune system in plants in response to pathogen infections. Previous studies have identified NBS-encoding genes in Pyrus bretschneideri ('Dangshansuli', an Asian pear) and Pyrus communis ('Bartlett', a European pear) genomes, but the patterns of genetic variation and selection pressure on these genes during pear domestication have remained unsolved.
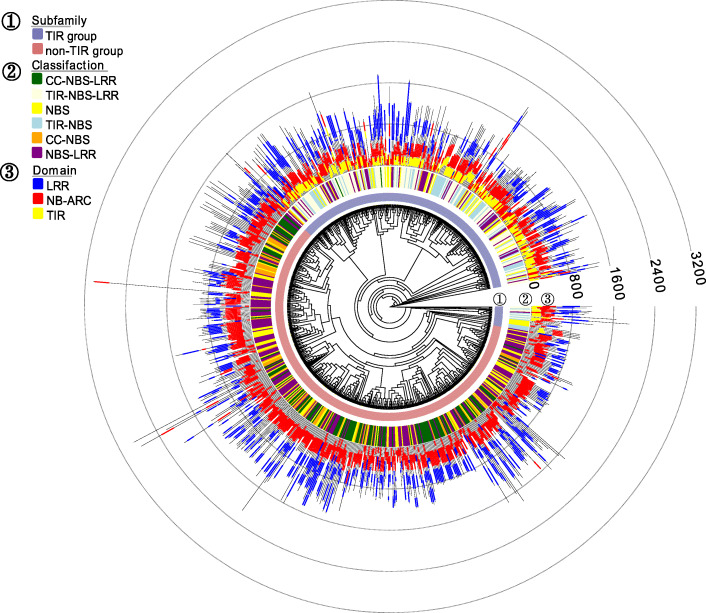
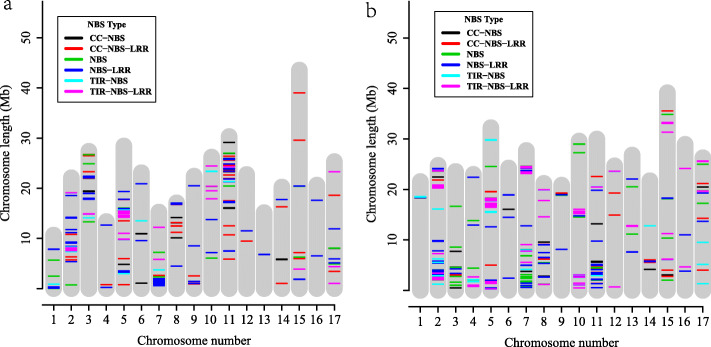
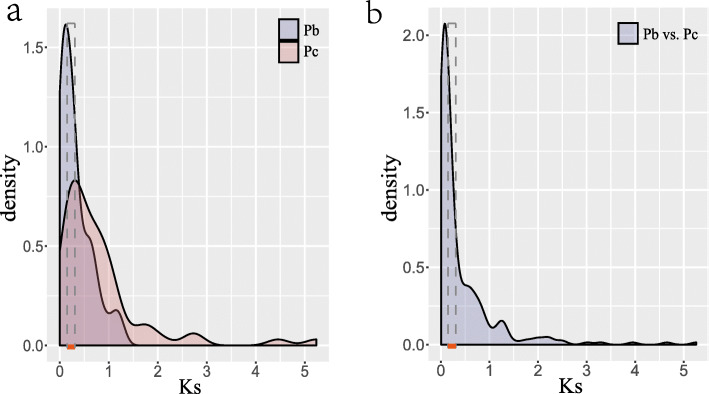
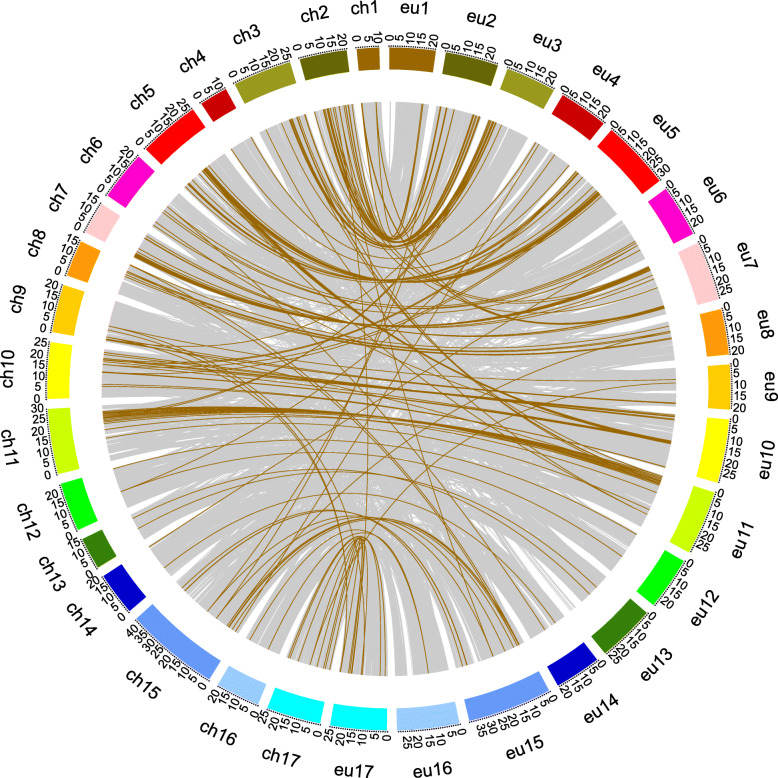
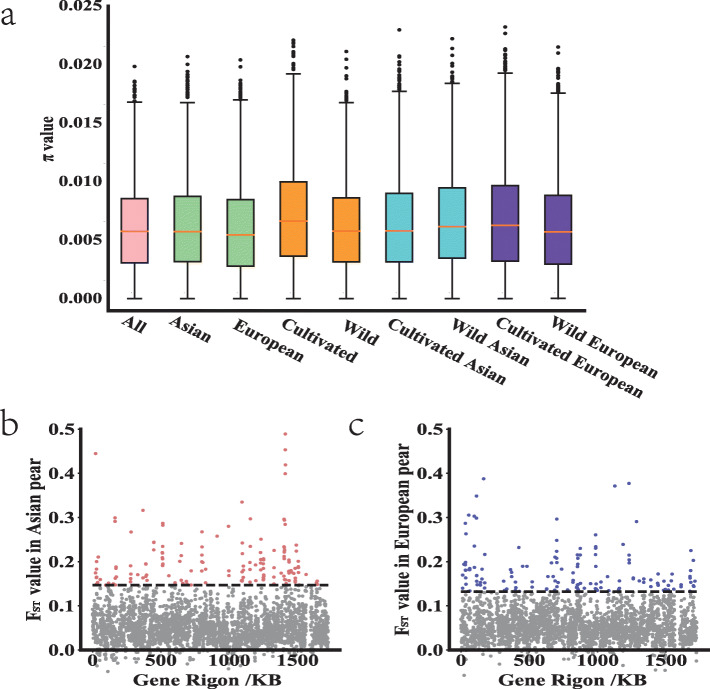
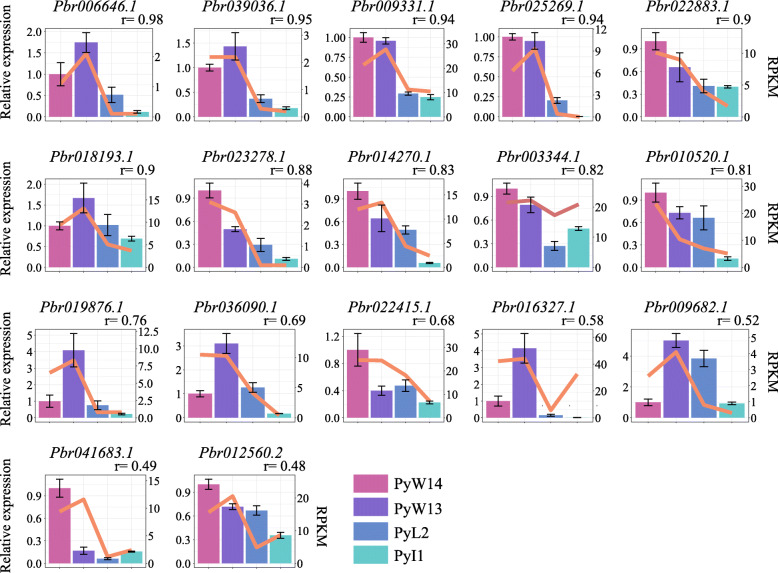
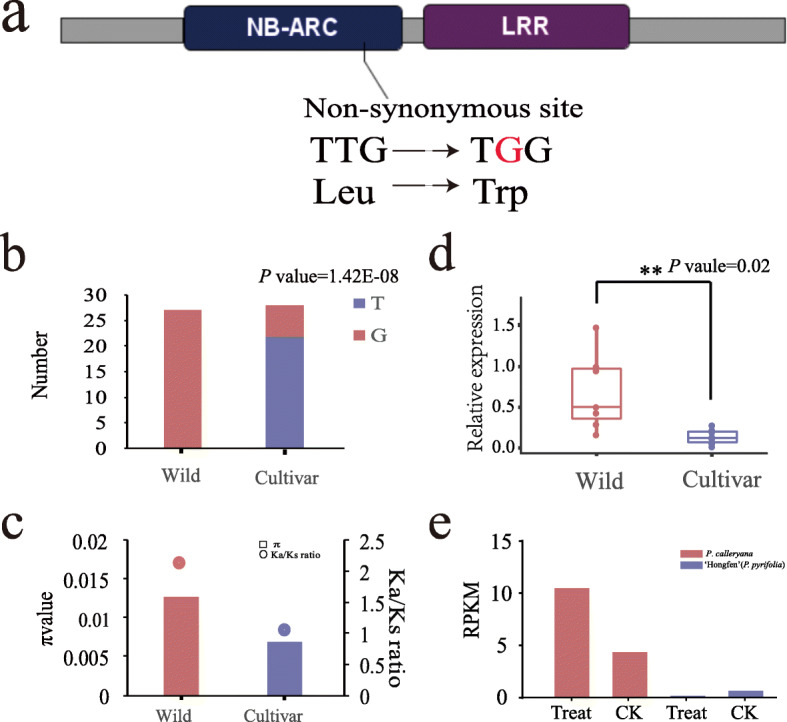
Results: In this study, 338 and 412 NBS-encoding genes were identified from Asian and European pear genomes. This difference between the two pear species was the result of proximal duplications. About 15.79% orthologous gene pairs had Ka/Ks ratio more than one, indicating two pear species undergo strong positive selection after the divergence of Asian and European pear. We identified 21 and 15 NBS-encoding genes under fire blight and black spot disease-related QTL, respectively, suggesting their importance in disease resistance. Domestication caused decreased nucleotide diversity across NBS genes in Asian cultivars (cultivated 6.23E-03; wild 6.47E-03), but opposite trend (cultivated 6.48E-03; wild 5.91E-03) appeared in European pears. Many NBS-encoding coding regions showed Ka/Ks ratio of greater than 1, indicating the role of positive selection in shaping diversity of NBS-encoding genes in pear. Furthermore, we detected 295 and 122 significantly different SNPs between wild and domesticated accessions in Asian and European pear populations. Two NBS genes (Pbr025269.1 and Pbr019876.1) with significantly different SNPs showed >5x upregulation between wild and cultivated pear accessions, and > 2x upregulation in Pyrus calleryana after inoculation with Alternaria alternata. We propose that positively selected and significantly different SNPs of an NBS-encoding gene (Pbr025269.1) regulate gene expression differences in the wild and cultivated groups, which may affect resistance in pear against A. alternata.
Conclusion: Proximal duplication mainly led to the different number of NBS-encoding genes in P. bretschneideri and P. communis genomes. The patterns of genetic diversity and positive selection pressure differed between Asian and European pear populations, most likely due to their independent domestication events. This analysis helps us understand the evolution, diversity, and selection pressure in the NBS-encoding gene family in Asian and European populations, and provides opportunities to study mechanisms of disease resistance in pear.
Keywords: Expansion; NBS; Nucleotide diversity; Pear; Positive selection.
Conflict of interest statement
The authors declare that they have no competing interests.
Figures
Similar articles
-
Diversification and independent domestication of Asian and European pears.Genome Biol. 2018 Jun 11;19(1):77. doi: 10.1186/s13059-018-1452-y. Genome Biol. 2018. PMID: 29890997 Free PMC article.
-
Integrated high-density consensus genetic map of Pyrus and anchoring of the 'Bartlett' v1.0 (Pyrus communis) genome.DNA Res. 2017 Jun 1;24(3):289-301. doi: 10.1093/dnares/dsw063. DNA Res. 2017. PMID: 28130382 Free PMC article.
-
Haplotype-resolved, gap-free genome assemblies provide insights into the divergence between Asian and European pears.Nat Genet. 2025 Aug;57(8):2040-2051. doi: 10.1038/s41588-025-02273-4. Epub 2025 Aug 6. Nat Genet. 2025. PMID: 40770574 Free PMC article.
-
Advances in Asian pear research: active ingredients, health benefits, processing trends and challenges.Crit Rev Food Sci Nutr. 2025 Jun 9:1-19. doi: 10.1080/10408398.2025.2508852. Online ahead of print. Crit Rev Food Sci Nutr. 2025. PMID: 40485471 Review.
-
Review of fruit cork spot disorder of Asian pear (Pyrus spp.).Front Plant Sci. 2023 Jun 29;14:1211451. doi: 10.3389/fpls.2023.1211451. eCollection 2023. Front Plant Sci. 2023. PMID: 37457360 Free PMC article. Review.
Cited by
-
Genome-wide identification of PME genes, evolution and expression analyses in soybean (Glycine max L.).BMC Plant Biol. 2021 Dec 6;21(1):578. doi: 10.1186/s12870-021-03355-1. BMC Plant Biol. 2021. PMID: 34872520 Free PMC article.
-
PearMODB: a multiomics database for pear (Pyrus) genomics, genetics and breeding study.Database (Oxford). 2023 Jul 6;2023:baad050. doi: 10.1093/database/baad050. Database (Oxford). 2023. PMID: 37410918 Free PMC article.
-
Functional characterization of NBS-LRR genes reveals an NBS-LRR gene that mediates resistance against Fusarium wilt.BMC Biol. 2024 Feb 27;22(1):45. doi: 10.1186/s12915-024-01836-x. BMC Biol. 2024. PMID: 38408951 Free PMC article.
-
Complete chloroplast genome features of the model heavy metal hyperaccumulator Arabis paniculata Franch and its phylogenetic relationships with other Brassicaceae species.Physiol Mol Biol Plants. 2022 Apr;28(4):775-789. doi: 10.1007/s12298-022-01151-1. Epub 2022 Apr 4. Physiol Mol Biol Plants. 2022. PMID: 35592481 Free PMC article.
-
Pear genetics: Recent advances, new prospects, and a roadmap for the future.Hortic Res. 2022 Jan 5;9:uhab040. doi: 10.1093/hr/uhab040. Hortic Res. 2022. PMID: 35031796 Free PMC article.
References
-
- Rubtsov GA. Geographical Distribution of the Genus Pyrus and Trends and Factors in Its Evolution. Am Nat. 1944;78(777):358–366. doi: 10.1086/281206. - DOI
MeSH terms
Supplementary concepts
Grants and funding
LinkOut - more resources
Full Text Sources
Research Materials
Miscellaneous
