. 2020 Nov 19;15(1):70.
doi: 10.1186/s13024-020-00418-z.

An in vitro bioengineered model of the human arterial neurovascular unit to study neurodegenerative diseases

Affiliations

An in vitro bioengineered model of the human arterial neurovascular unit to study neurodegenerative diseases

Jerome Robert et al. Mol Neurodegener. .

Abstract

Introduction: The neurovascular unit (NVU) - the interaction between the neurons and the cerebrovasculature - is increasingly important to interrogate through human-based experimental models. Although advanced models of cerebral capillaries have been developed in the last decade, there is currently no in vitro 3-dimensional (3D) perfusible model of the human cortical arterial NVU.

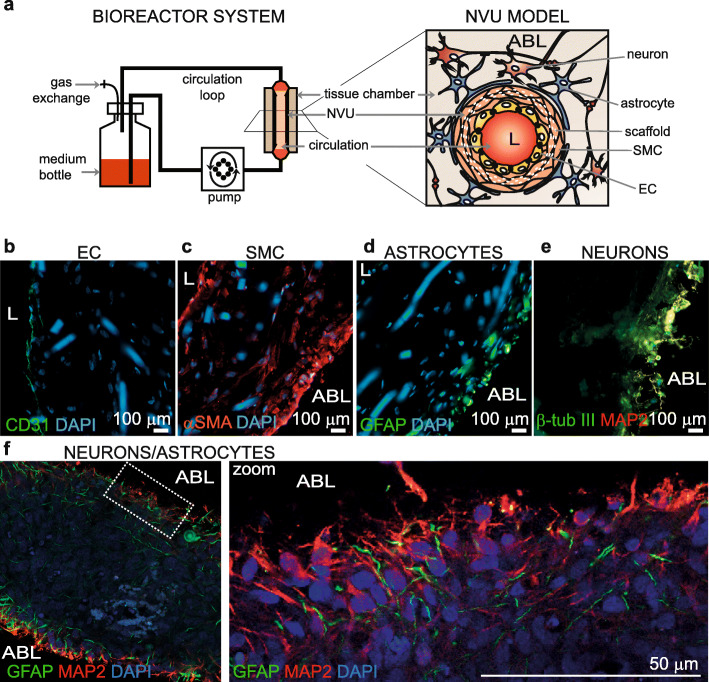
Method: We used a tissue-engineering technique to develop a scaffold-directed, perfusible, 3D human NVU that is cultured in native-like flow conditions that mimics the anatomy and physiology of cortical penetrating arteries.

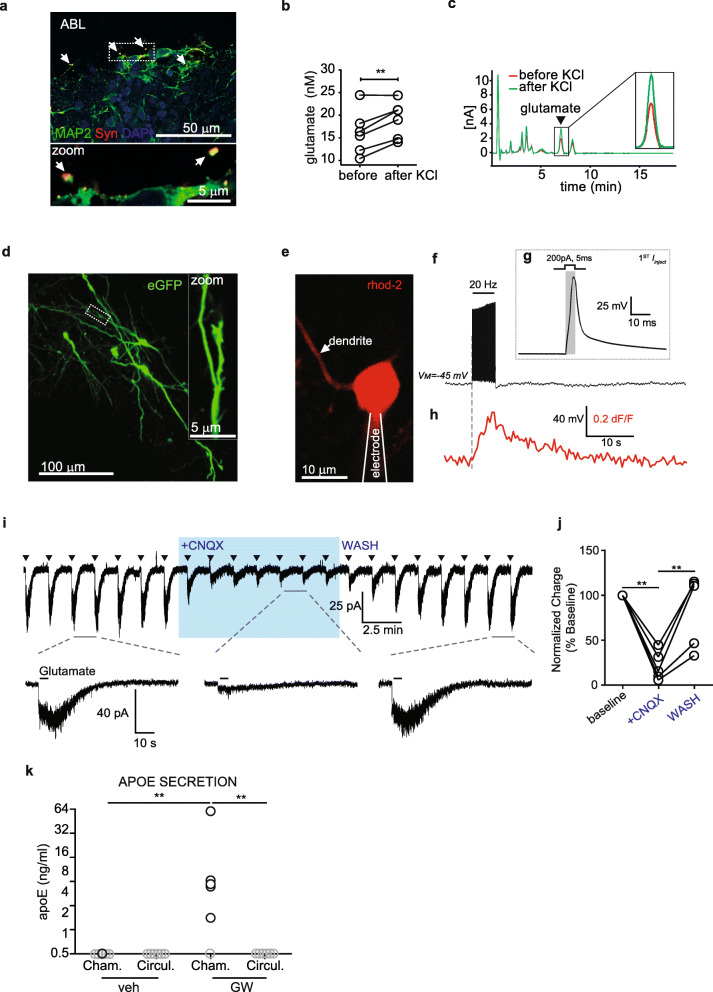
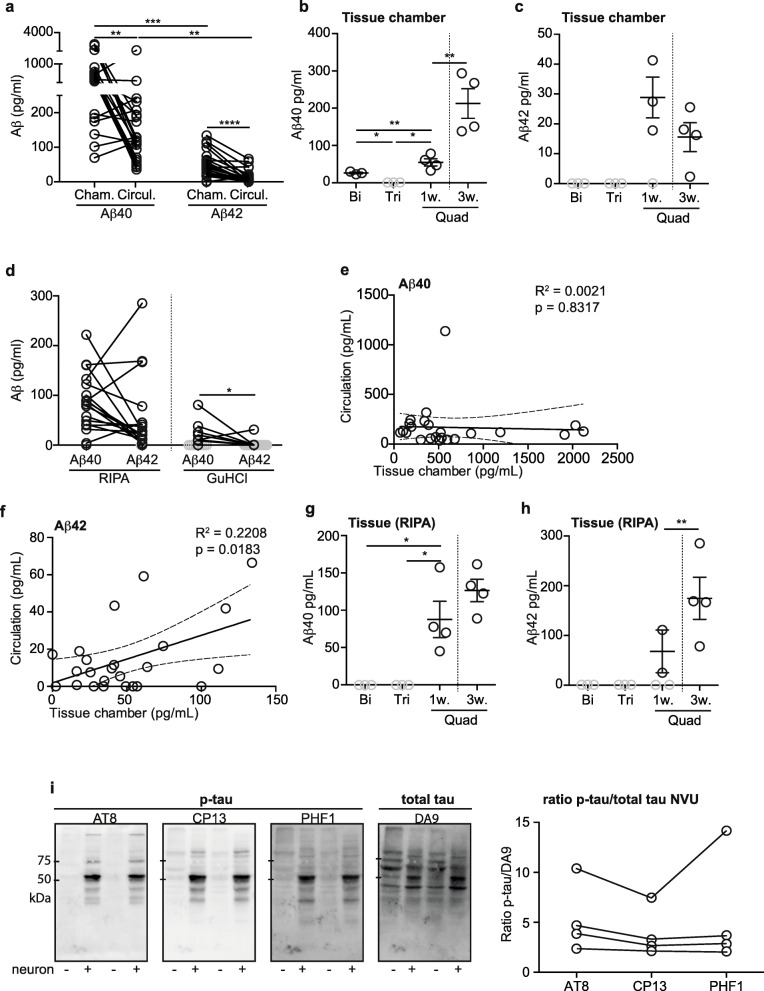
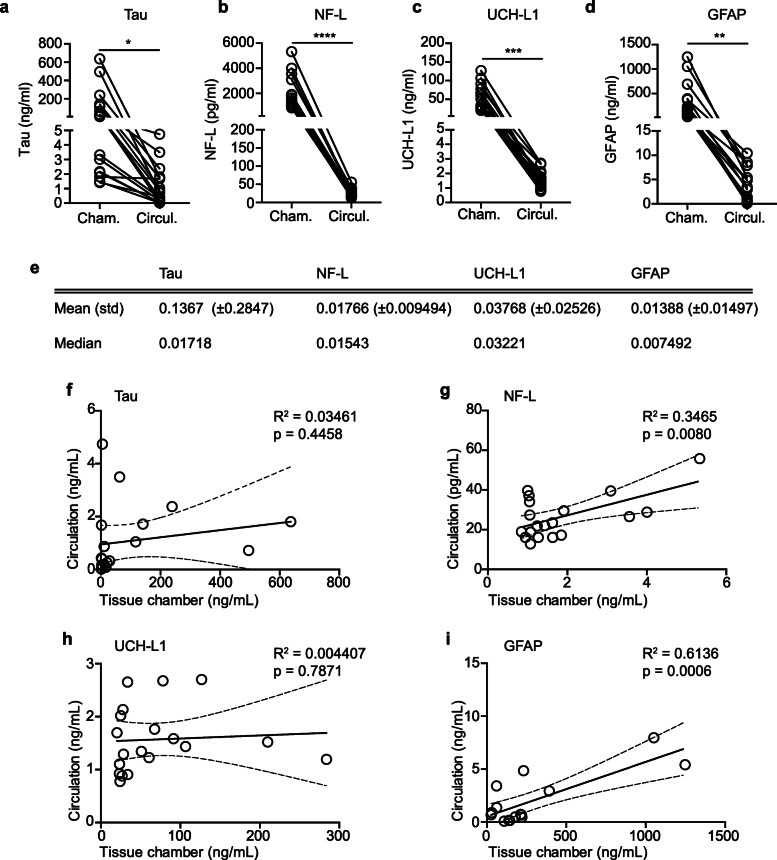
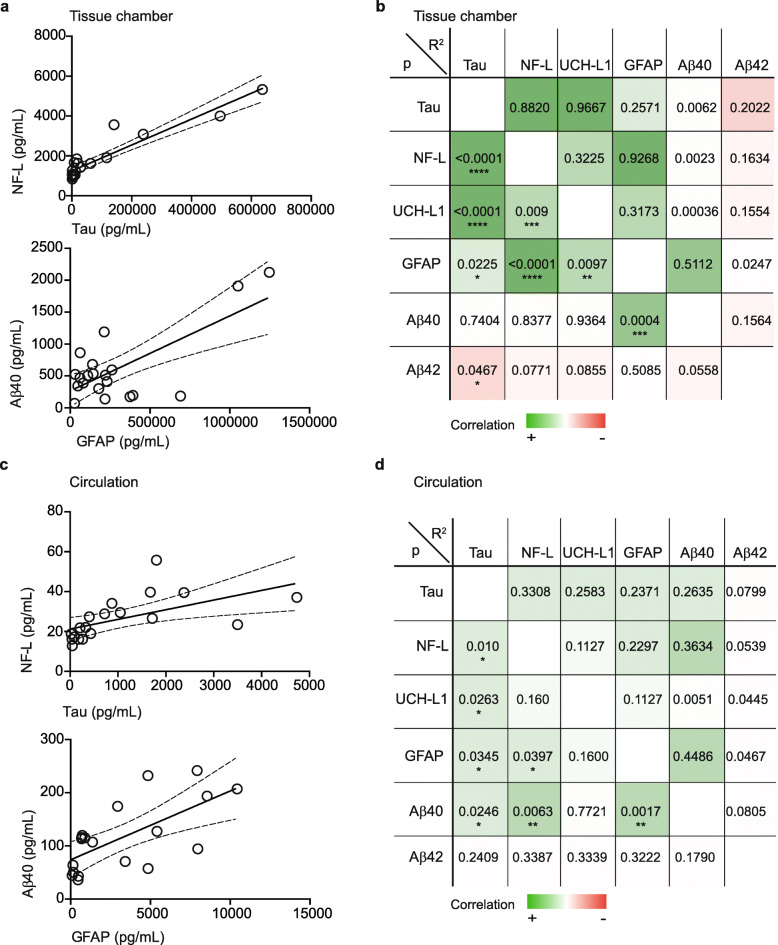
Results: This system, composed of primary human vascular cells (endothelial cells, smooth muscle cells and astrocytes) and induced pluripotent stem cell (iPSC) derived neurons, demonstrates a physiological multilayer organization of the involved cell types. It reproduces key characteristics of cortical neurons and astrocytes and enables formation of a selective and functional endothelial barrier. We provide proof-of-principle data showing that this in vitro human arterial NVU may be suitable to study neurovascular components of neurodegenerative diseases such as Alzheimer's disease (AD), as endogenously produced phosphorylated tau and beta-amyloid accumulate in the model over time. Finally, neuronal and glial fluid biomarkers relevant to neurodegenerative diseases are measurable in our arterial NVU model.

Conclusion: This model is a suitable research tool to investigate arterial NVU functions in healthy and disease states. Further, the design of the platform allows culture under native-like flow conditions for extended periods of time and yields sufficient tissue and media for downstream immunohistochemistry and biochemistry analyses.


Conflict of interest statement

The authors declare no competing interests.

Figures

Fig. 1
Fig. 1
Histological structure of bioengineered arterial NVU. a Schematic representation of the bioreactor and arterial NVU model. b-e Cryopreserved bioengineered arterial NVU were cut longitudinally to show a cross-section of the NVU wall. The expression of CD31 (b) confirmed the presence of an endothelial cell monolayer on the luminal side of the bioengineered NVU and αSMA (c) confirmed the smooth muscle phenotype of the cells in the inner layer. GFAP (d) and MAP 2/β-tubIII (e) positive staining confirmed respectively the astrocyte and neuron phenotype of the cells on the out layers in radial section of the NVU. f Bioengineered arterial NVU were stained without cryopreservation and were mounted directly on microscopy slide with the antelumen facing the coverslip. An optical sectioning was performed using confocal microscopy to image a focal plan . Staining against GFAP and MAP 2 confirmed the imbrication of the astrocytes and neurons. L = lumen, ABL = albumen
Fig. 2
Fig. 2
Depolarization- and glutamate-driven activity in abluminal cells indicates a neuronal phenotype and apoE secretion in the tissue chamber indicates astrocyte function and endothelial barrier formation. a Immunostaining against MAP 2 and synapsin-I (Syn) confirmed the presence of synapses in iPSC-derived neurons cultured in arterial NVU. b Glutamate release measured by HPLC showing increase after KCl treatment. c Example HPLC curves. d Two-photon Z-projection image of iPSC cells expressing eGFP. Dotted box displays region of zoomed inset, highlighting dendritic morphology and synaptic structure. e Example image of a whole-cell patch clamped iPSC-derived neuron dialyzed with the red Ca2+-indicator Rhod-2. Proximal dendrites were imaged for depolarization-induced Ca2+-entry. f Representative current-clamp trace from patched cell in ‘e’ during 20 Hz spike train stimulation. g Single current injection (200 pA, 5 ms) example from ‘f’ showing change in membrane potential. h Time-correlated Rhod-2 signal from trace ‘e’ showing depolarization-induced Ca2+-increase. i (Top trace) Full-length voltage-clamp recording showing glutamate puff-evoked (triangles) AMPAR currents that were amenable to block by CNQX (10 μM) and recovered in washout. (Bottom trace) Example AMPAR currents before, during, and after CNQX application. j Quantitative summary of normalized charge for glutamate inward currents in the presence of CNQX (n = 5, **P < 0.01). k Astrocyte and endothelium barrier functions were confirmed by treating tissues with 1 μM LXR agonist GW3965 for 96 h and measuring the levels of astrocyte-derived apoE secreted into the tissue chamber and circulation media. Values below the detection of the ELISA are plotted in gray. Points in graphed data represent individual bioengineered vessels, bars represent mean, error bars represent ±SEM and analysed by one way ANOVA **P < 0.01
Fig. 3
Fig. 3
Neurons secrete Aβ that then accumulates within the vascular wall. a Aβ40 and Aβ42 levels were quantified by ELISA in the chamber and circulation media of bioengineered arterial NVU after 3 weeks. Aβ40 (b) and Aβ42 (c) levels in chamber media of tissues composed of EC and SCM (bipartite), EC, SMC and astrocyte (tripartite) and EC, SMC, astrocytes and neurons (NVU) after one or three weeks in culture. d Vascular Aβ40 and Aβ42 level in RIPA and GuHCl soluble fractions were quantified by ELISA in NVU after three weeks in culture. The correlation between the level of Aβ40 (e) and Aβ42 (f) in circulation and tissue chamber were assessed through Pearson correlation analysis. The correlation coefficient (R2) and p-value are shown in each panel. Aβ40 (g) and Aβ42 (h) vascular deposition were quantified in RIPA soluble fraction after a week (bipartite, tripartite and NVU) and three weeks (NVU) in culture. i The level of p-tau (AT8, CP13 and PHF1) was measured by Western blot in NVU and tripartite tissues and compared to total tau (DA9). Points in graphed data represent individual bioengineered vessels, bars represent mean, error bars represent ±SEM and analysed by one way ANOVA or Pearson correlation. Values below the detection of the ELISA are plotted in gray. * = p < 0.05, ** = p < 0.01, *** = p < 0.001
Fig. 4
Fig. 4
Fluid biomarkers levels in tissue chamber vs. circulation. Total tau (a) NF-L (b) UCH-L1 (c) and GFAP (d) were quantified in tissue chamber and circulation media four days after last medium change. e) Ratio circulation:chamber calculation. The correlation between the level of total tau (f) NF-L (i) UCH-L1 (j) and GFAP (k) in circulation and tissue chamber were assessed through Pearson correlation analysis. Points in graphed data represent individual bioengineered vessels, bars represent mean, error bars represent ±SEM and analysed by paired Student’s t-test or Pearson correlation. The correlation coefficient (R2) and p-value are shown in each panel. * = p < 0.05, ** = p < 0.01, *** = p < 0.001, **** < p = 0.0001
Fig. 5
Fig. 5
Fluid biomarkers and Aβ levels dependence in tissue chamber and circulation. The correlation between the level of total tau, NF-L, UCH-L1, GFAP, Aβ40 and Aβ42 in tissue chamber (a-b) and circulation (c-d) were assessed through Pearson correlation analysis. The correlation coefficient (R2) and p-value are displayed and significant correlations are graphed. * = p < 0.05, ** = p < 0.01, *** = p < 0.001, **** < p = 0.0001

References

    1. Rolfe DF, Brown GC. Cellular energy utilization and molecular origin of standard metabolic rate in mammals. Physiol Rev. 1997;77:731–758. doi: 10.1152/physrev.1997.77.3.731. - DOI - PubMed
    1. Attwell D, Laughlin SB. An energy budget for signaling in the grey matter of the brain. J Cereb Blood Flow Metab. 2001;21:1133–1145. doi: 10.1097/00004647-200110000-00001. - DOI - PubMed
    1. Kisler K, Nelson A, Montagne A, et al. Cerebral blood flow regulation and neurovascular dysfunction in Alzheimer disease. Nat Rev Neurosci. 2017;18:419–34. 10.1038/nrn.2017.48. - PMC - PubMed
    1. Iadecola C. Neurovascular regulation in the normal brain and in Alzheimer’s disease. Nat Rev Neurosci. 2004;5:347–360. doi: 10.1038/nrn1387. - DOI - PubMed
    1. Buxton RB, Frank LR. A model for the coupling between cerebral blood flow and oxygen metabolism during neural stimulation. J Cereb Blood Flow Metab. 1997;17:64–72. doi: 10.1097/00004647-199701000-00009. - DOI - PubMed

Publication types

MeSH terms

Grants and funding