. 2020 Nov 19;21(1):281.
doi: 10.1186/s13059-020-02184-z.

Deep sequencing reveals a DAP1 regulatory haplotype that potentiates autoimmunity in systemic lupus erythematosus

Affiliations

Deep sequencing reveals a DAP1 regulatory haplotype that potentiates autoimmunity in systemic lupus erythematosus

Prithvi Raj et al. Genome Biol. .

Abstract

Background: Systemic lupus erythematosus (SLE) is a clinically heterogeneous autoimmune disease characterized by the development of anti-nuclear antibodies. Susceptibility to SLE is multifactorial, with a combination of genetic and environmental risk factors contributing to disease development. Like other polygenic diseases, a significant proportion of estimated SLE heritability is not accounted for by common disease alleles analyzed by SNP array-based GWASs. Death-associated protein 1 (DAP1) was implicated as a candidate gene in a previous familial linkage study of SLE and rheumatoid arthritis, but the association has not been explored further.

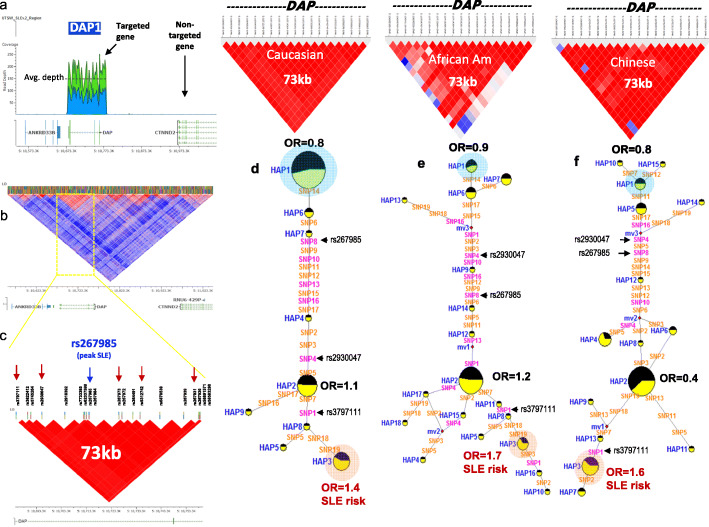
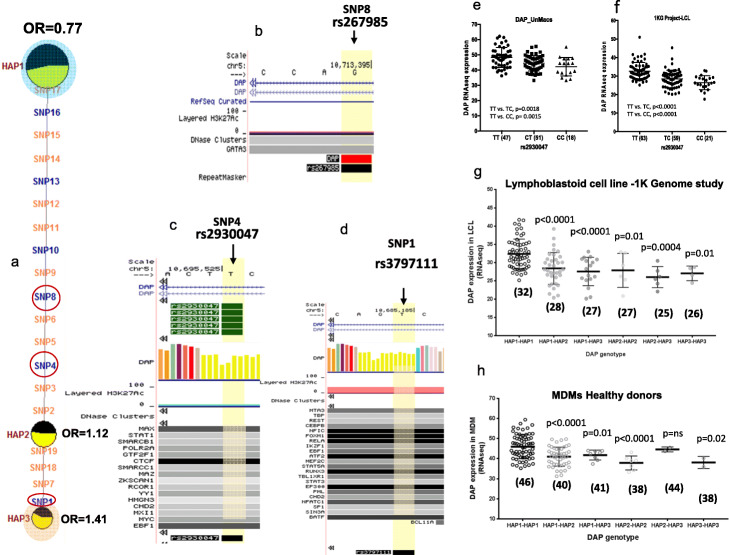
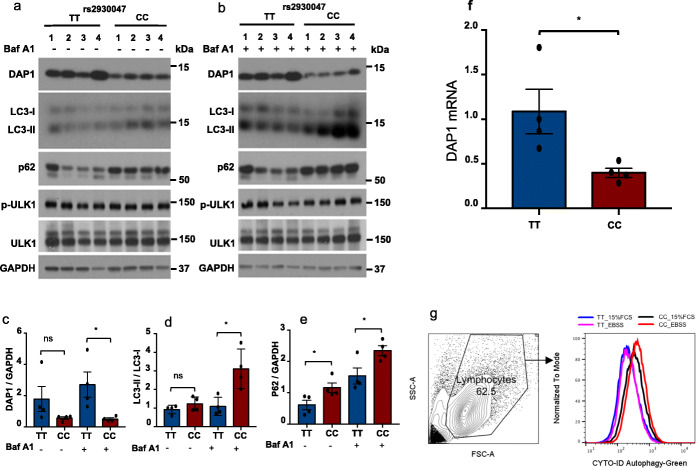
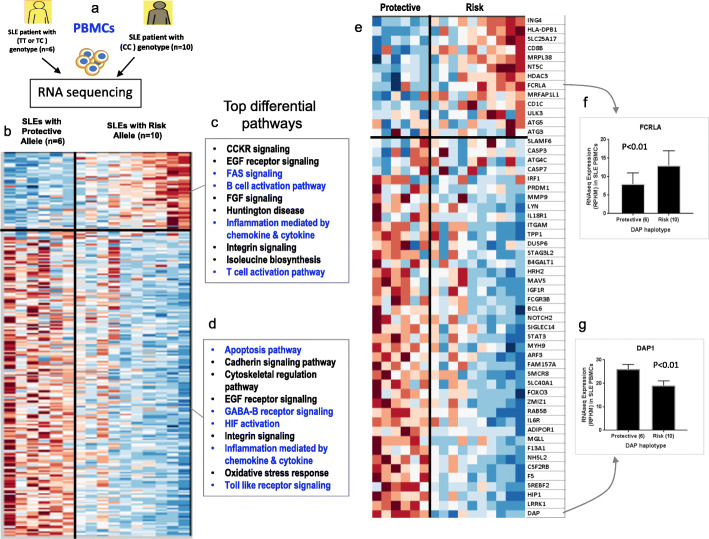
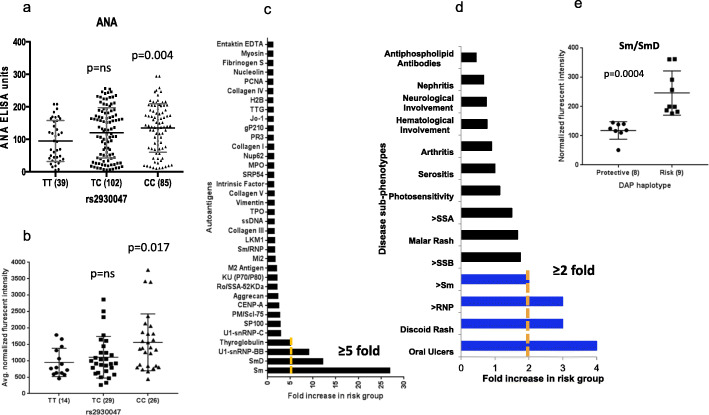
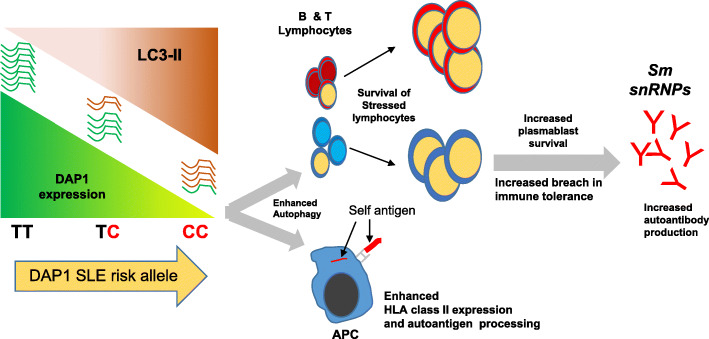
Results: We perform deep sequencing across the DAP1 genomic segment in 2032 SLE patients, and healthy controls, and discover a low-frequency functional haplotype strongly associated with SLE risk in multiple ethnicities. We find multiple cis-eQTLs embedded in a risk haplotype that progressively downregulates DAP1 transcription in immune cells. Decreased DAP1 transcription results in reduced DAP1 protein in peripheral blood mononuclear cells, monocytes, and lymphoblastoid cell lines, leading to enhanced autophagic flux in immune cells expressing the DAP1 risk haplotype. Patients with DAP1 risk allele exhibit significantly higher autoantibody titers and altered expression of the immune system, autophagy, and apoptosis pathway transcripts, indicating that the DAP1 risk allele mediates enhanced autophagy, leading to the survival of autoreactive lymphocytes and increased autoantibody.

Conclusions: We demonstrate how targeted sequencing captures low-frequency functional risk alleles that are missed by SNP array-based studies. SLE patients with the DAP1 genotype have distinct autoantibody and transcription profiles, supporting the dissection of SLE heterogeneity by genetic analysis.

Keywords: Autophagy; DAP1; Haplotype; RNA-Seq; SLE; SNPs; Sequencing.


Conflict of interest statement

The authors declare no competing interests.

Figures

Fig. 1
Fig. 1
SLE-associated DAP1 haplotype in European American, African American, and Asian populations. a The targeted sequencing strategy and read depth across DAP1 gene locus on chromosome 5. b, c The overall LD (linkage disequilibrium) structure across DAP1 region; LD blocks shown in panels b and c are generated based on Caucasian data from the 1000 Genome Project and Caucasian SLE and control samples from the present study, respectively. b Show 73-kb block that contains top 19 SLE-associated DAP1 variants. Location of the peak SLE-associated SNP rs267985 is shown in c. d Median-joining (MJ) network analysis on most common DAP1 haplotypes in European American SLEs and healthy controls. Spheres (termed nodes) represent the locations of each haplotype (Additional file 1: Table S6) within the network, and the size of the node is proportional to the overall frequency of that haplotype in the dataset. Each node is overlaid with a pie chart that reflects the frequency of that haplotype in the SLE group (yellow) versus healthy group (black). The lines connecting the nodes are labeled with the variants that distinguish the connected nodes, and the length is proportional to the number of variants. Odds ratio (OR) is shown for the two most significant alleles. Red highlighted nodes indicate SLE risk clades. e Median-joining (MJ) network analysis on most common DAP1 haplotypes in African American SLEs and healthy controls. f Median-joining (MJ) network analysis on most common DAP1 haplotypes in Asian SLEs and healthy controls
Fig. 2
Fig. 2
SLE-associated DAP1 eQTLs in immune cells. a MJ network analysis on the top three most common DAP1 haplotypes illustrates the position of six (blue color) potentially regulatory variants with strong RegulomeDB score and eQTL effects. MJ network nomenclature is the same as described earlier in Fig. 1. Encircled SNPs (SNP8, SNP4, and SNP1) indicate the variants with the strongest regulatory annotations based on ENCODE data and eQTL effects. bd UCSC genome browser illustrates histone modification, transcription factor binding tracks based on ENCODE’s ChIP-Seq data, and UCSC functional annotations for SNP8, SNP4, and SNP1. e, f DAP1 eQTLs for rs2930047 SNP in human monocyte-derived macrophages (MDMs) from the present study and lymphoblastoid cell lines from the 1000 genomes study, respectively. g, h Effect of allele dosage on DAP1 gene expression in different combinations of protective and risk alleles in lymphoblastoid cell line (LCL) samples from the 1000 Genome Project (g) and MDMs from the present study (h). Median value of DAP1 expression in each diplotypes is shown underneath in parentheses
Fig. 3
Fig. 3
Reduced DAP1 protein and enhanced autophagy in DAP1 SLE risk genotype. B cell-derived lymphoblastoid cell lines (LCLs) on 8 participants from 1000 genome study were purchased from Coriell based on their DAP1 genotypes. a, b Lymphoblastoid cells (LCLs) from four donors with protective genotype (TT) or four donors with risk genotype (CC) incubated with RPMI in the absence (a) or presence of 100 nM bafilomycin A1 (b) for 4 h. Cell lysates were analyzed by western blot using indicated antibodies. The ratio of DAP1/GAPDH (c) or the ratio of LC3-II/LC3-I (d) or the ratio of p62/GAPDH (e) is presented in bar graphs. Data are representative from at least three independent experiments. f Show quantitative RT-PCR analysis of DAP1 mRNA in LCLs from four donors with protective genotype TT or four donors with risk genotype CC. GAPDH was used as an internal control to normalized DAP1 expression. All plotted values are averages of two independent experiments using two different primer pairs. g Gating strategy and flow plots from CYTO-ID green autophagy detection assay on 4 TT or 4 CC LCL samples. Bar graph represents the average ± SEM of two independent experiments. Error bars: SEM; *p < 0.05. ns, not significant. Student’s t test
Fig. 4
Fig. 4
Gene expression analysis in PBMCs of SLE patients with and without DAP1 risk. a Schematic for the RNA sequencing experiment in PBMCs of established SLE patients. RNA was extracted from PBMCs from SLE patients with rs2930047 protective genotype (TT, n = 6) or donor with rs2930047 risk genotype (CC, n = 10). b Heatmap shows the top two clusters of most differentially expressed 232 genes (RPKM values) between DAP1 SLE risk and non-risk allele. c, d Top 10 biological pathways annotated for each cluster based on PANTHER 14.1 classification (http://pantherdb.org). e Heatmap on 54 sub-selected genes to illustrate the status of some key biological molecules from the immune system, autophagy, and apoptosis pathways. f, g Expression plot of FCRLA and DAP1 gene, as representative genes from each cluster
Fig. 5
Fig. 5
Autoantibodies in patients with the DAP1 risk haplotype. a Distribution of ANA in SLE patients with three different genotypes of the rs2930047 SNP. b Average normalized fluorescent intensity (NFI) for 89 autoantigens (IgG) in SLE patients with three different genotypes of the rs2930047 SNP. c Enrichment of specific autoantibodies in DAP1 SLE risk haplotype compared to the protective haplotype. d Enrichment of specific autoantibodies and clinical phenotypes in DAP1 SLE risk haplotype compared to the protective haplotype. In this independent set of samples, SLE patients with risk allele showed higher odds for clinical phenotypes such as oral ulcers, discoid rash and sm, and RNP antibodies. e Enrichment of sm/smD antibodies in DAP1 SLE risk haplotype compared to the protective haplotype in a cohort of apparently healthy subjects that carried DAP1 risk (n = 9) or protective (n = 8) genotype
Fig. 6
Fig. 6
A hypothetical model describing the events by which differential DAP1 expression impacts endophenotypes of autoimmunity and susceptibility to SLE. Our model proposes that the HAP3 regulatory allele of DAP1 mediates lower transcription of autophagy-suppressing DAP1 protein, which results in enhanced autophagy, survival of autoreactive lymphocytes, enhanced antigen presentation, and development of autoimmunity

References

    1. Mok CC, Lau CS. Pathogenesis of systemic lupus erythematosus. J Clin Pathol. 2003;56(7):481–490. doi: 10.1136/jcp.56.7.481. - DOI - PMC - PubMed
    1. Harley JB, Sestak AL, Willis LG, Fu SM, Hansen JA, Reichlin M. A model for disease heterogeneity in systemic lupus erythematosus. Relationships between histocompatibility antigens, autoantibodies, and lymphopenia or renal disease. Arthritis Rheum. 1989;32(7):826–836. - PubMed
    1. Brentjens J, Ossi E, Albini B, Sepulveda M, Kano K, Sheffer J, et al. Disseminated immune deposits in lupus erythematosus. Arthritis Rheum. 1977;20(4):962–968. doi: 10.1002/art.1780200408. - DOI - PubMed
    1. Li QZ, Xie C, Wu T, Mackay M, Aranow C, Putterman C, et al. Identification of autoantibody clusters that best predict lupus disease activity using glomerular proteome arrays. JClinInvest. 2005;115(12):3428–3439. - PMC - PubMed
    1. Tsokos GC, Lo MS, Costa Reis P, Sullivan KE. New insights into the immunopathogenesis of systemic lupus erythematosus. Nat Rev Rheumatol. 2016;12(12):716–730. doi: 10.1038/nrrheum.2016.186. - DOI - PubMed

Publication types

Substances