

Spatial inequality, characteristics of internal migration, and pulmonary tuberculosis in China, 2011-2017: a spatial analysis
- PMID: 33213525
- PMCID: PMC7678065
- DOI: 10.1186/s40249-020-00778-0
Spatial inequality, characteristics of internal migration, and pulmonary tuberculosis in China, 2011-2017: a spatial analysis
Abstract
Background: Human migration facilitate the spread of tuberculosis (TB). Migrants face an increased risk of TB infection. In this study, we aim to explore the spatial inequity of sputum smear-positive pulmonary TB (SS + PTB) in China; and the spatial heterogeneity between SS + PTB and internal migration.
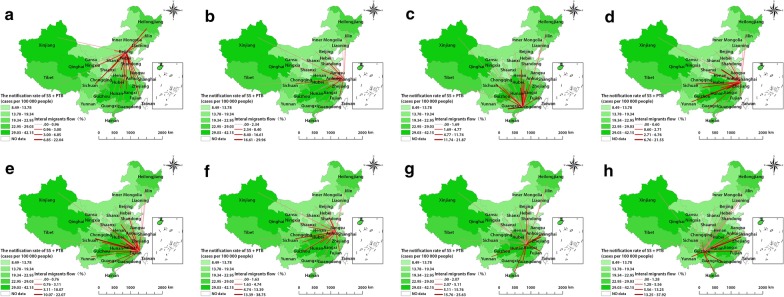
Methods: Notified SS + PTB cases in 31 provinces in mainland China were obtained from the national web-based PTB surveillance system database. Internal migrant data were extracted from the report on China's migrant population development. Spatial autocorrelations were explored using the global Moran's statistic and local indicators of spatial association. The spatial variation in temporal trends was performed using Kulldorff's scan statistic. Fixed effect and spatial autoregressive models were used to explore the spatial inequity between SS + PTB and internal migration.
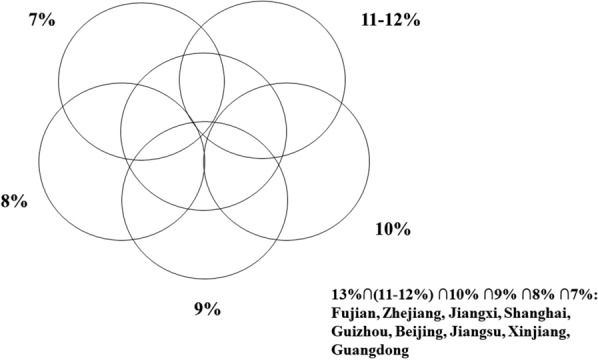
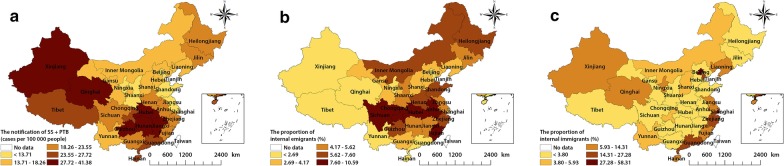
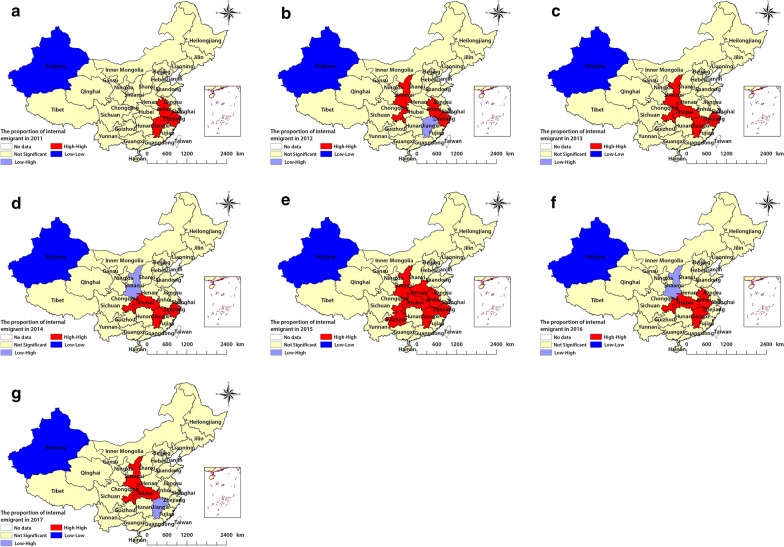
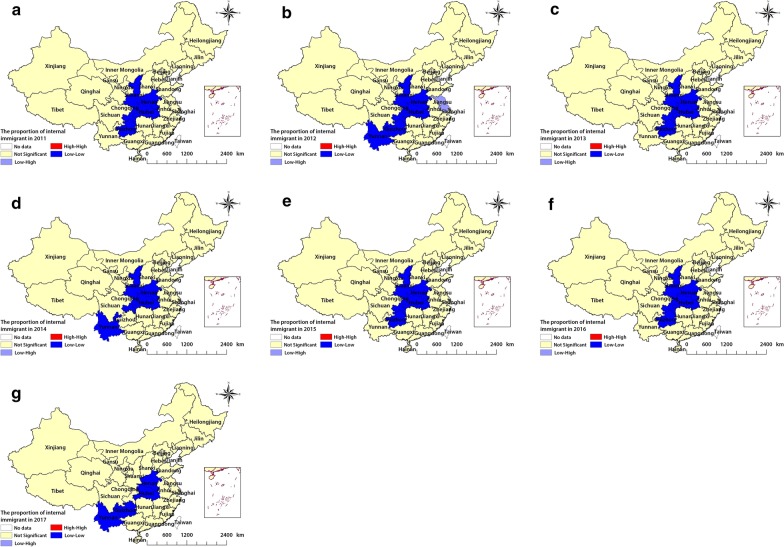
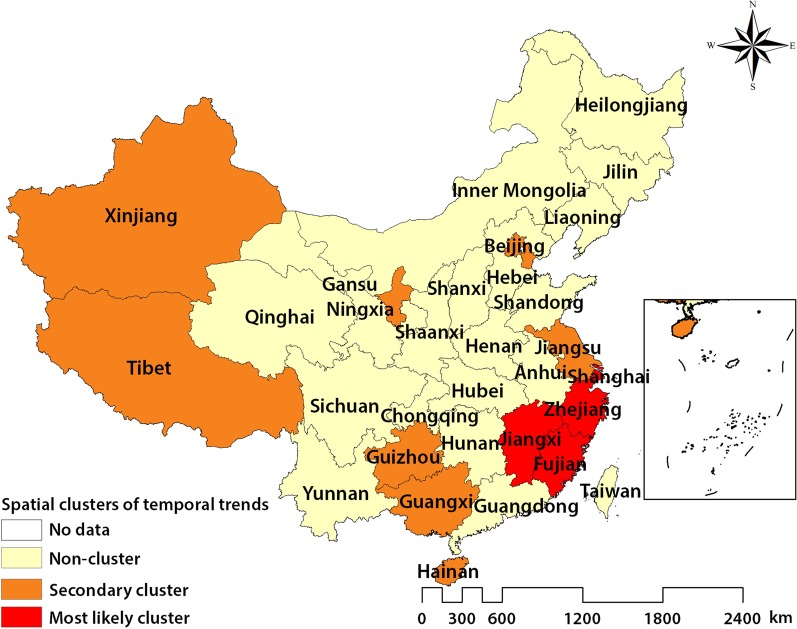
Results: A total of 2 380 233 SS + PTB cases were reported in China between 2011 and 2017, of which, 1 716 382 (72.11%) were male and 663 851 (27.89%) were female. Over 70% of internal migrants were from rural households and had lower income and less education. The spatial variation in temporal trend results showed that there was an 9.9% average annual decrease in the notification rate of SS + PTB from 2011 to 2017; and spatial clustering of SS + PTB cases was mainly located in western and southern China. The spatial autocorrelation results revealed spatial clustering of internal migration each year (2011-2017), and the clusters were stable within most provinces. Internal emigration, urban-to-rural migration and GDP per capita were significantly associated with SS + PTB, further, internal emigration could explain more variation in SS + PTB in the eastern region in mainland. However, internal immigration and rural-to-urban migration were not significantly associated with SS + PTB across China.
Conclusions: Our study found the spatial inequity between SS + PTB and internal migration. Internal emigration, urban-to-rural migration and GDP per capita were statistically associated with SS + PTB; the negative association was identified between internal emigration, urban-to-rural migration and SS + PTB. Further, we found those migrants with lower income and less education, and most of them were from rural households. These findings can help stakeholders to implement effective PTB control strategies for areas at high risk of PTB and those with high rates of internal migration.
Keywords: China; Internal migration; Pulmonary tuberculosis; Spatial analysis.
Conflict of interest statement
The authors declare that they have no competing interests.
Figures
References
-
- Pai M, et al. Tuberculosis. Nature Reviews Disease Primers, 2016. 2. - PubMed
-
- Organization WH. Global Tuberculosis Report 2017.https://www.who.int/tb/publications/global_report/en/. 2017.
MeSH terms
LinkOut - more resources
Full Text Sources
