

Transcutaneous Vagus Nerve Stimulation in Humans Induces Pupil Dilation and Attenuates Alpha Oscillations
- PMID: 33214317
- PMCID: PMC7810665
- DOI: 10.1523/JNEUROSCI.1361-20.2020
Transcutaneous Vagus Nerve Stimulation in Humans Induces Pupil Dilation and Attenuates Alpha Oscillations
Abstract
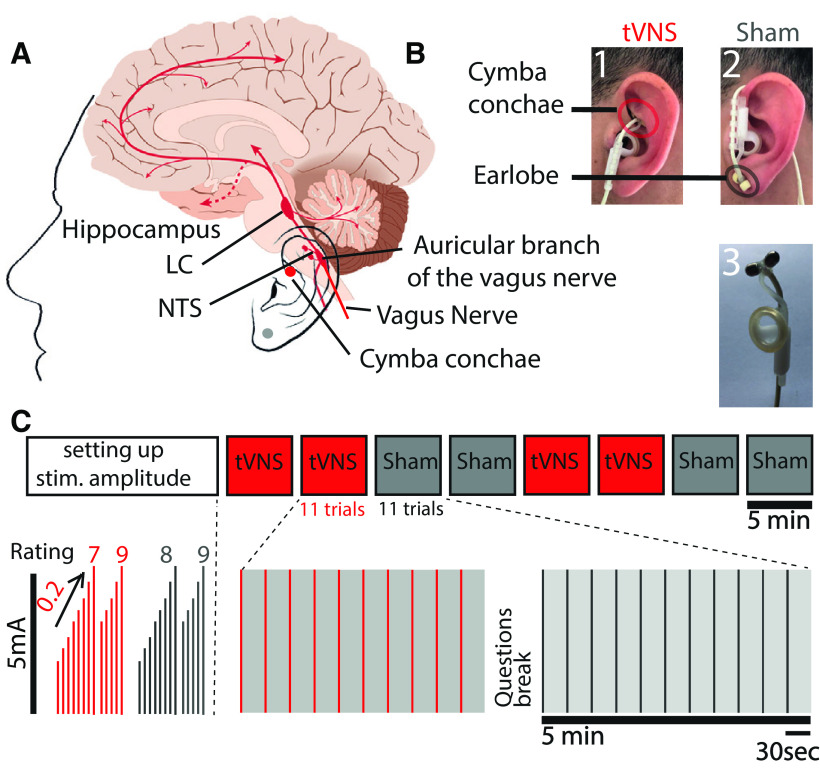
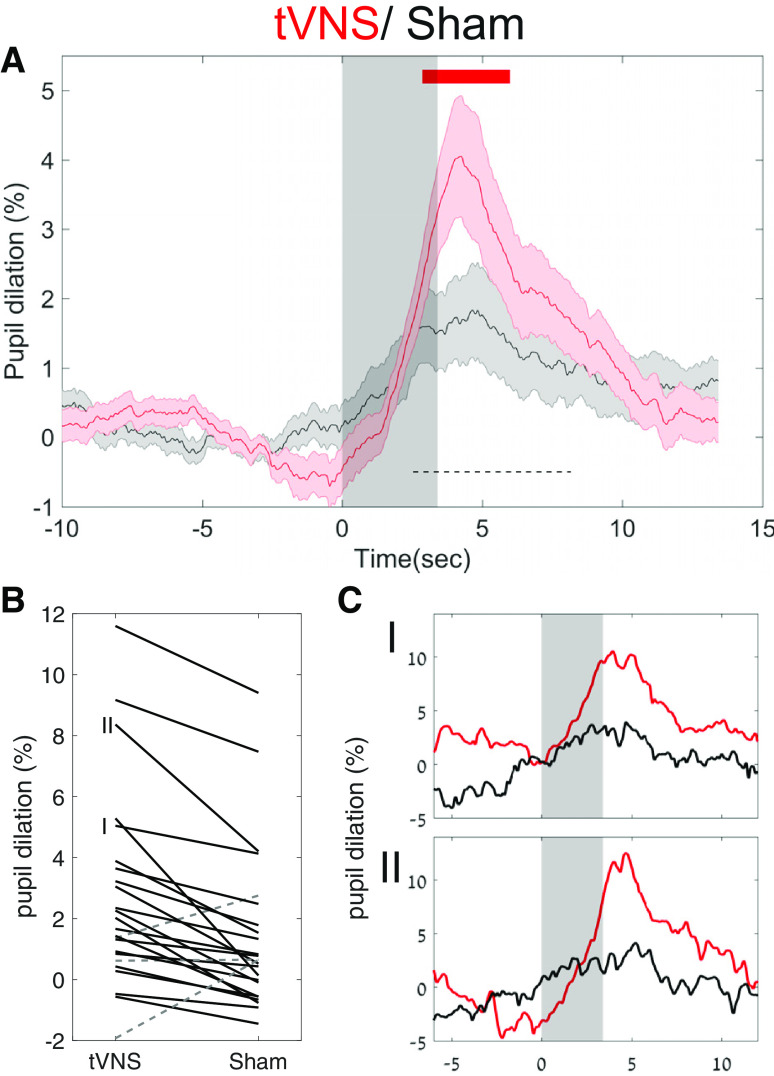
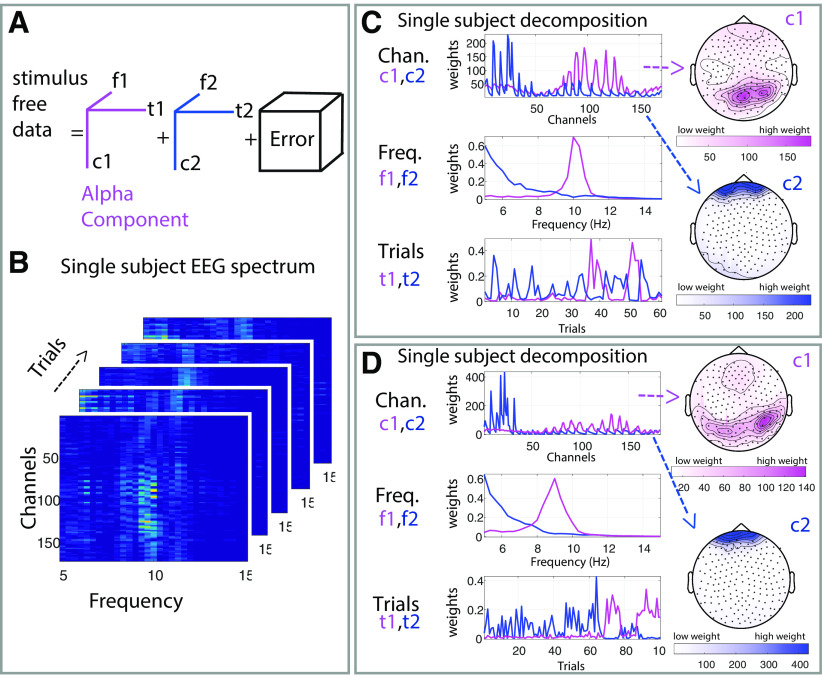
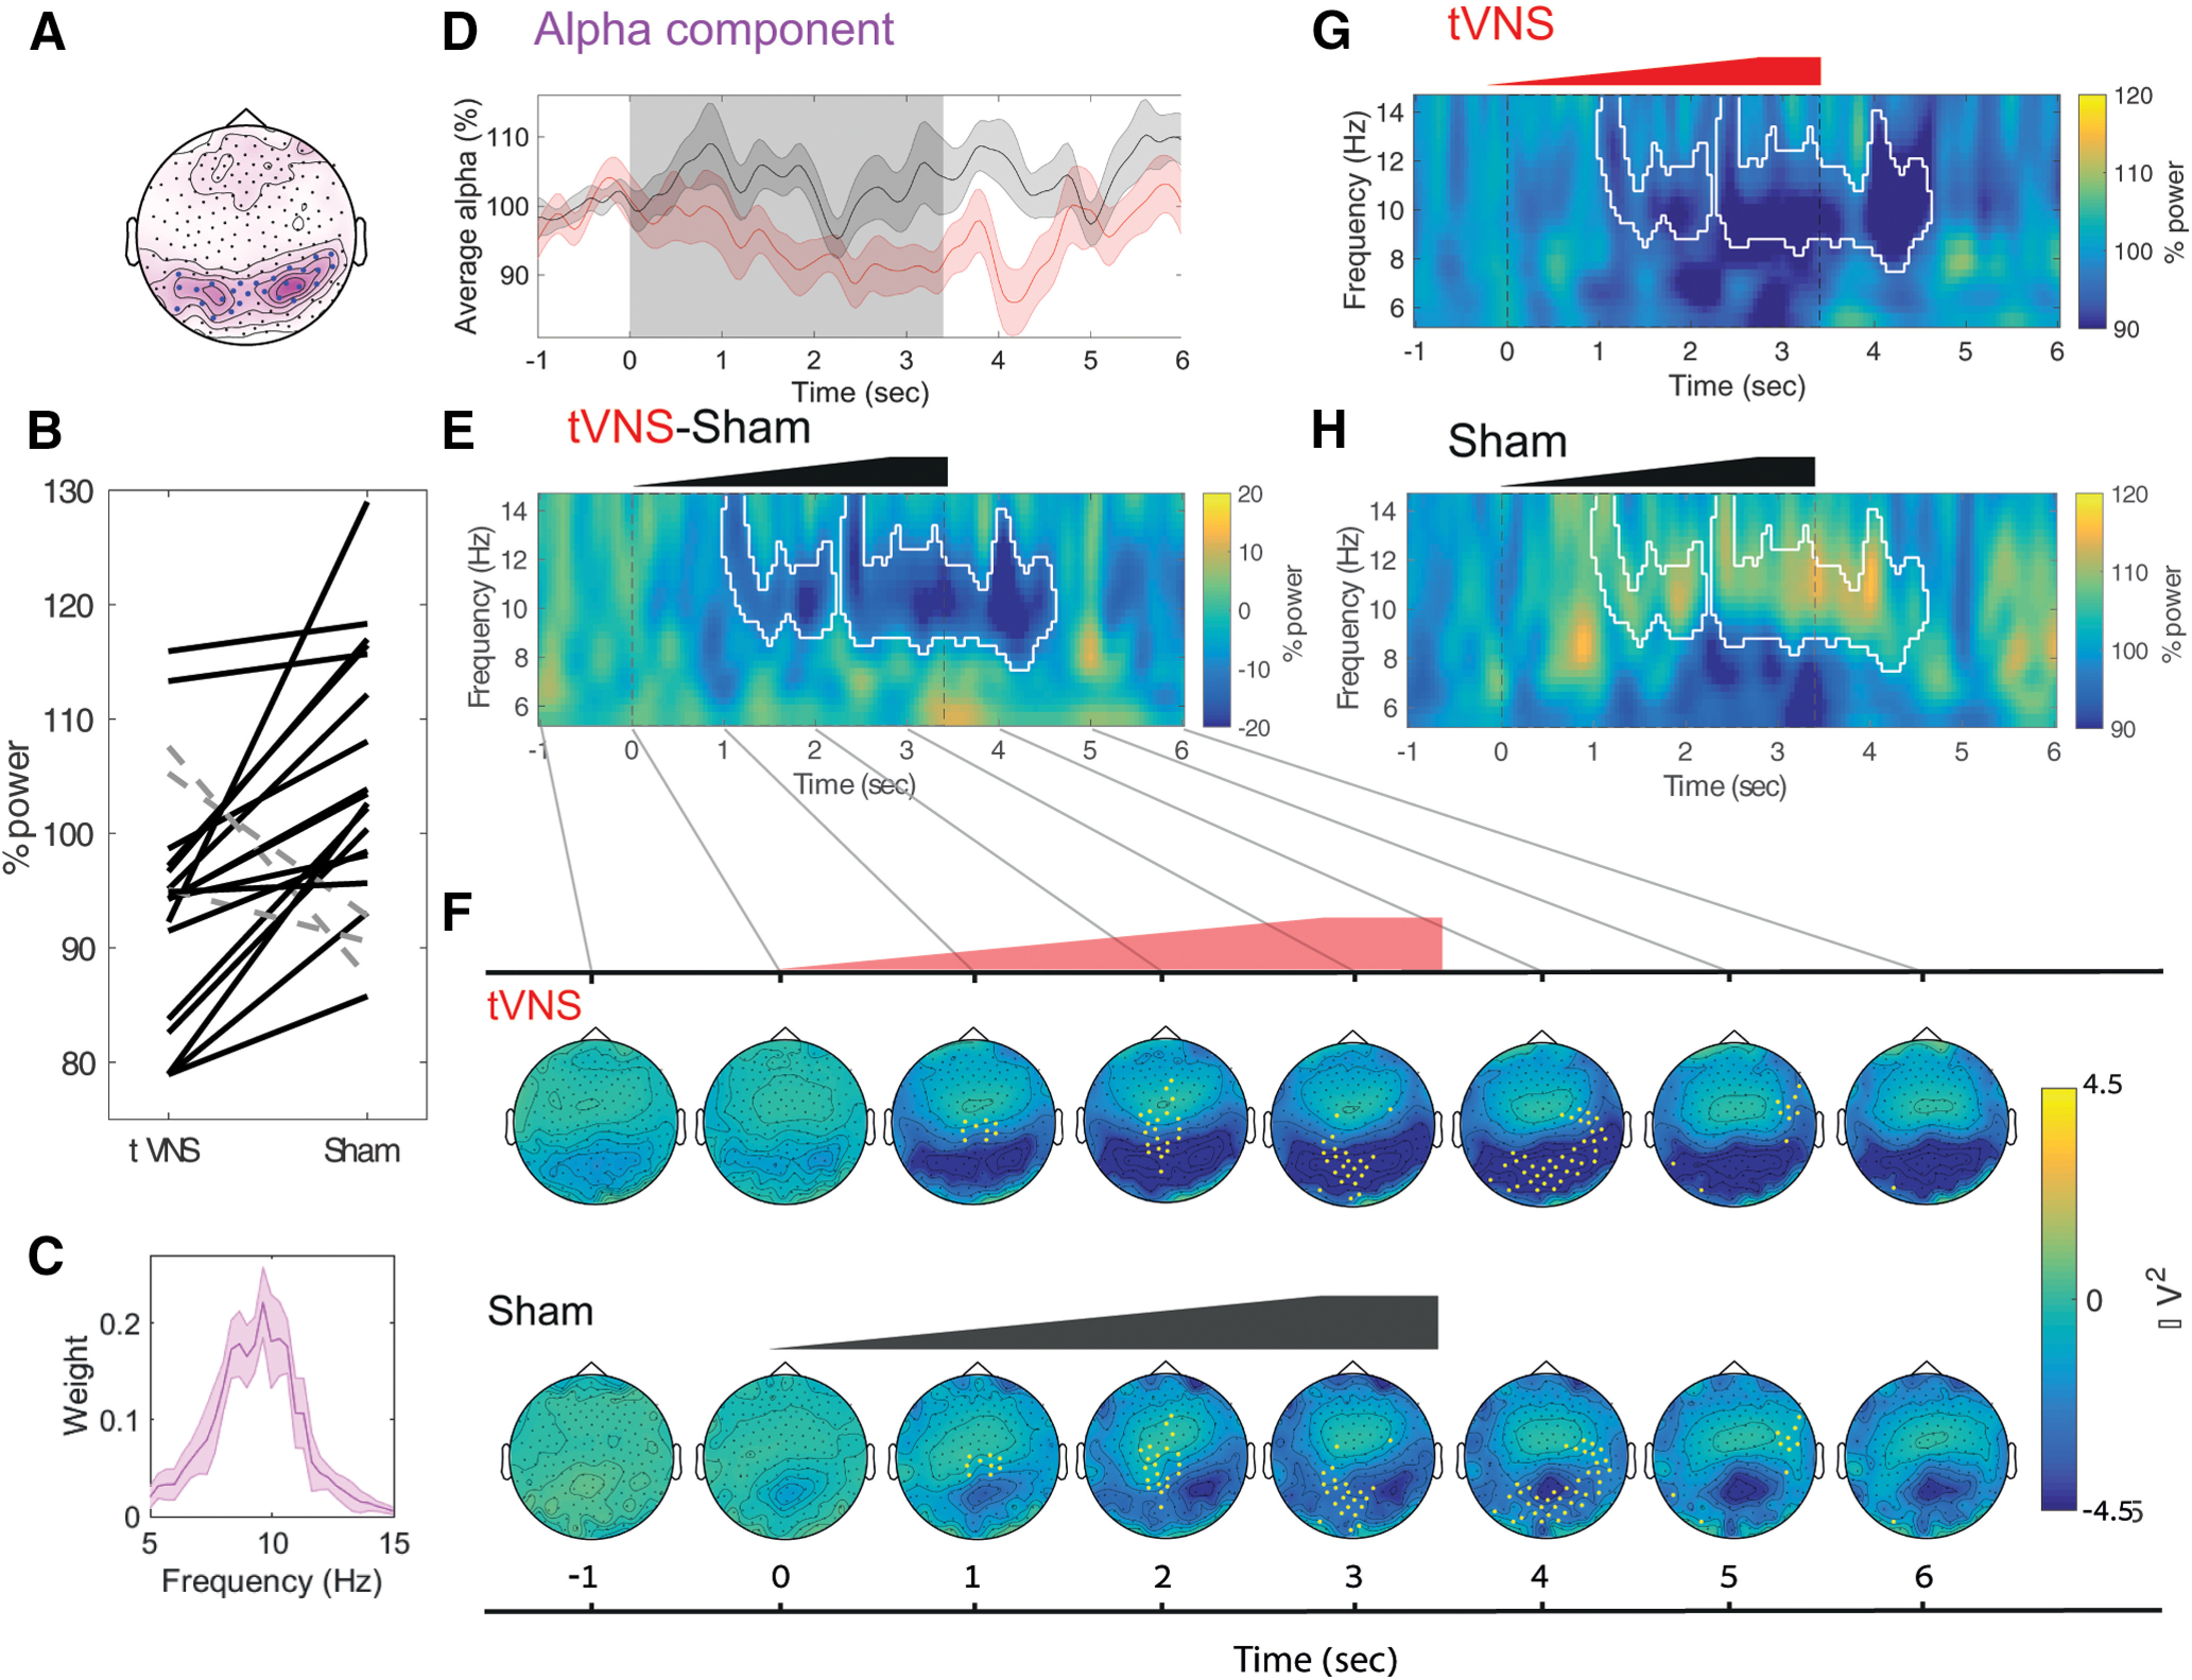
Vagus nerve stimulation (VNS) is widely used to treat drug-resistant epilepsy and depression. While the precise mechanisms mediating its long-term therapeutic effects are not fully resolved, they likely involve locus coeruleus (LC) stimulation via the nucleus of the solitary tract, which receives afferent vagal inputs. In rats, VNS elevates LC firing and forebrain noradrenaline levels, whereas LC lesions suppress VNS therapeutic efficacy. Noninvasive transcutaneous VNS (tVNS) uses electrical stimulation that targets the auricular branch of the vagus nerve at the cymba conchae of the ear. However, the extent to which tVNS mimics VNS remains unclear. Here, we investigated the short-term effects of tVNS in healthy human male volunteers (n = 24), using high-density EEG and pupillometry during visual fixation at rest. We compared short (3.4 s) trials of tVNS to sham electrical stimulation at the earlobe (far from the vagus nerve branch) to control for somatosensory stimulation. Although tVNS and sham stimulation did not differ in subjective intensity ratings, tVNS led to robust pupil dilation (peaking 4-5 s after trial onset) that was significantly higher than following sham stimulation. We further quantified, using parallel factor analysis, how tVNS modulates idle occipital alpha (8-13Hz) activity identified in each participant. We found greater attenuation of alpha oscillations by tVNS than by sham stimulation. This demonstrates that tVNS reliably induces pupillary and EEG markers of arousal beyond the effects of somatosensory stimulation, thus supporting the hypothesis that tVNS elevates noradrenaline and other arousal-promoting neuromodulatory signaling, and mimics invasive VNS.SIGNIFICANCE STATEMENT Current noninvasive brain stimulation techniques are mostly confined to modulating cortical activity, as is typical with transcranial magnetic or transcranial direct/alternating current electrical stimulation. Transcutaneous vagus nerve stimulation (tVNS) has been proposed to stimulate subcortical arousal-promoting nuclei, though previous studies yielded inconsistent results. Here we show that short (3.4 s) tVNS pulses in naive healthy male volunteers induced transient pupil dilation and attenuation of occipital alpha oscillations. These markers of brain arousal are in line with the established effects of invasive VNS on locus coeruleus-noradrenaline signaling, and support that tVNS mimics VNS. Therefore, tVNS can be used as a tool for studying how endogenous subcortical neuromodulatory signaling affects human cognition, including perception, attention, memory, and decision-making; and also for developing novel clinical applications.
Keywords: EEG; alpha oscillations; noradrenaline; pupil; tVNS; transcutaneous vagus nerve stimulation.
Copyright © 2021 the authors.
Figures
Similar articles
-
Optimization of Transcutaneous Vagus Nerve Stimulation Using Functional MRI.Neuromodulation. 2017 Apr;20(3):290-300. doi: 10.1111/ner.12541. Epub 2016 Nov 29. Neuromodulation. 2017. PMID: 27898202
-
The neuromodulatory and hormonal effects of transcutaneous vagus nerve stimulation as evidenced by salivary alpha amylase, salivary cortisol, pupil diameter, and the P3 event-related potential.Brain Stimul. 2019 May-Jun;12(3):635-642. doi: 10.1016/j.brs.2018.12.224. Epub 2018 Dec 14. Brain Stimul. 2019. PMID: 30591360
-
From ear to eye? No effect of transcutaneous vagus nerve stimulation on human pupil dilation: A report of three studies.Biol Psychol. 2020 Apr;152:107863. doi: 10.1016/j.biopsycho.2020.107863. Epub 2020 Feb 9. Biol Psychol. 2020. PMID: 32050095
-
Transcutaneous vagus nerve stimulation - A brief introduction and overview.Auton Neurosci. 2022 Dec;243:103038. doi: 10.1016/j.autneu.2022.103038. Epub 2022 Sep 27. Auton Neurosci. 2022. PMID: 36201901 Review.
-
The anatomical basis for transcutaneous auricular vagus nerve stimulation.J Anat. 2020 Apr;236(4):588-611. doi: 10.1111/joa.13122. Epub 2019 Nov 19. J Anat. 2020. PMID: 31742681 Free PMC article. Review.
Cited by
-
When the Locus Coeruleus Speaks Up in Sleep: Recent Insights, Emerging Perspectives.Int J Mol Sci. 2022 Apr 30;23(9):5028. doi: 10.3390/ijms23095028. Int J Mol Sci. 2022. PMID: 35563419 Free PMC article. Review.
-
Vagus nerve stimulation: mechanisms and factors involved in memory enhancement.Front Hum Neurosci. 2023 Jun 29;17:1152064. doi: 10.3389/fnhum.2023.1152064. eCollection 2023. Front Hum Neurosci. 2023. PMID: 37457500 Free PMC article. Review.
-
The Use of Cardioprotective Devices and Strategies in Patients Undergoing Percutaneous Procedures and Cardiac Surgery.Healthcare (Basel). 2023 Apr 11;11(8):1094. doi: 10.3390/healthcare11081094. Healthcare (Basel). 2023. PMID: 37107928 Free PMC article. Review.
-
Vagus nerve stimulation as a predictive coding modulator that enhances feedforward over feedback transmission.Front Neural Circuits. 2025 Apr 14;19:1568655. doi: 10.3389/fncir.2025.1568655. eCollection 2025. Front Neural Circuits. 2025. PMID: 40297016 Free PMC article. Review.
-
Three Hundred Hertz Transcutaneous Auricular Vagus Nerve Stimulation (taVNS) Impacts Pupil Size Non-Linearly as a Function of Intensity.Psychophysiology. 2025 Feb;62(2):e70011. doi: 10.1111/psyp.70011. Psychophysiology. 2025. PMID: 40013407 Free PMC article.
References
-
- Andersson CA, Bro R (2000) The N-way toolbox for MATLAB. Chemometr Intell Lab Syst 52:1–4.
-
- Badran BW, Brown JC, Dowdle LT, Mithoefer OJ, LaBate NT, Coatsworth J, DeVries WH, Austelle CW, McTeague LM, Yu A, Bikson M, Jenkins DD, George MS (2018) Tragus or cymba conchae? Investigating the anatomical foundation of transcutaneous auricular vagus nerve stimulation (taVNS). Brain Stimul 11:947–948. 10.1016/j.brs.2018.06.003 - DOI - PMC - PubMed
Publication types
MeSH terms
Substances
LinkOut - more resources
Full Text Sources
Medical