. 2021 Aug 1;105(8):1718-1729.
doi: 10.1097/TP.0000000000003548.

Murine Cytomegalovirus-induced Complement-fixing Antibodies Deposit in Murine Renal Allografts During Acute Rejection

Affiliations

Murine Cytomegalovirus-induced Complement-fixing Antibodies Deposit in Murine Renal Allografts During Acute Rejection

Ute Saunders et al. Transplantation. .

Abstract

Background: Human cytomegalovirus (CMV) infection is associated with renal allograft dysfunction and loss, particularly in combination with acute rejection. Emerging literature suggests that non-HLA antibodies may contribute to antibody-mediated rejection, but pathogen-induced antibodies have not been investigated in this context. This study examines the presence of CMV-induced antibodies in murine CMV (MCMV)-infected renal allografts during acute rejection.

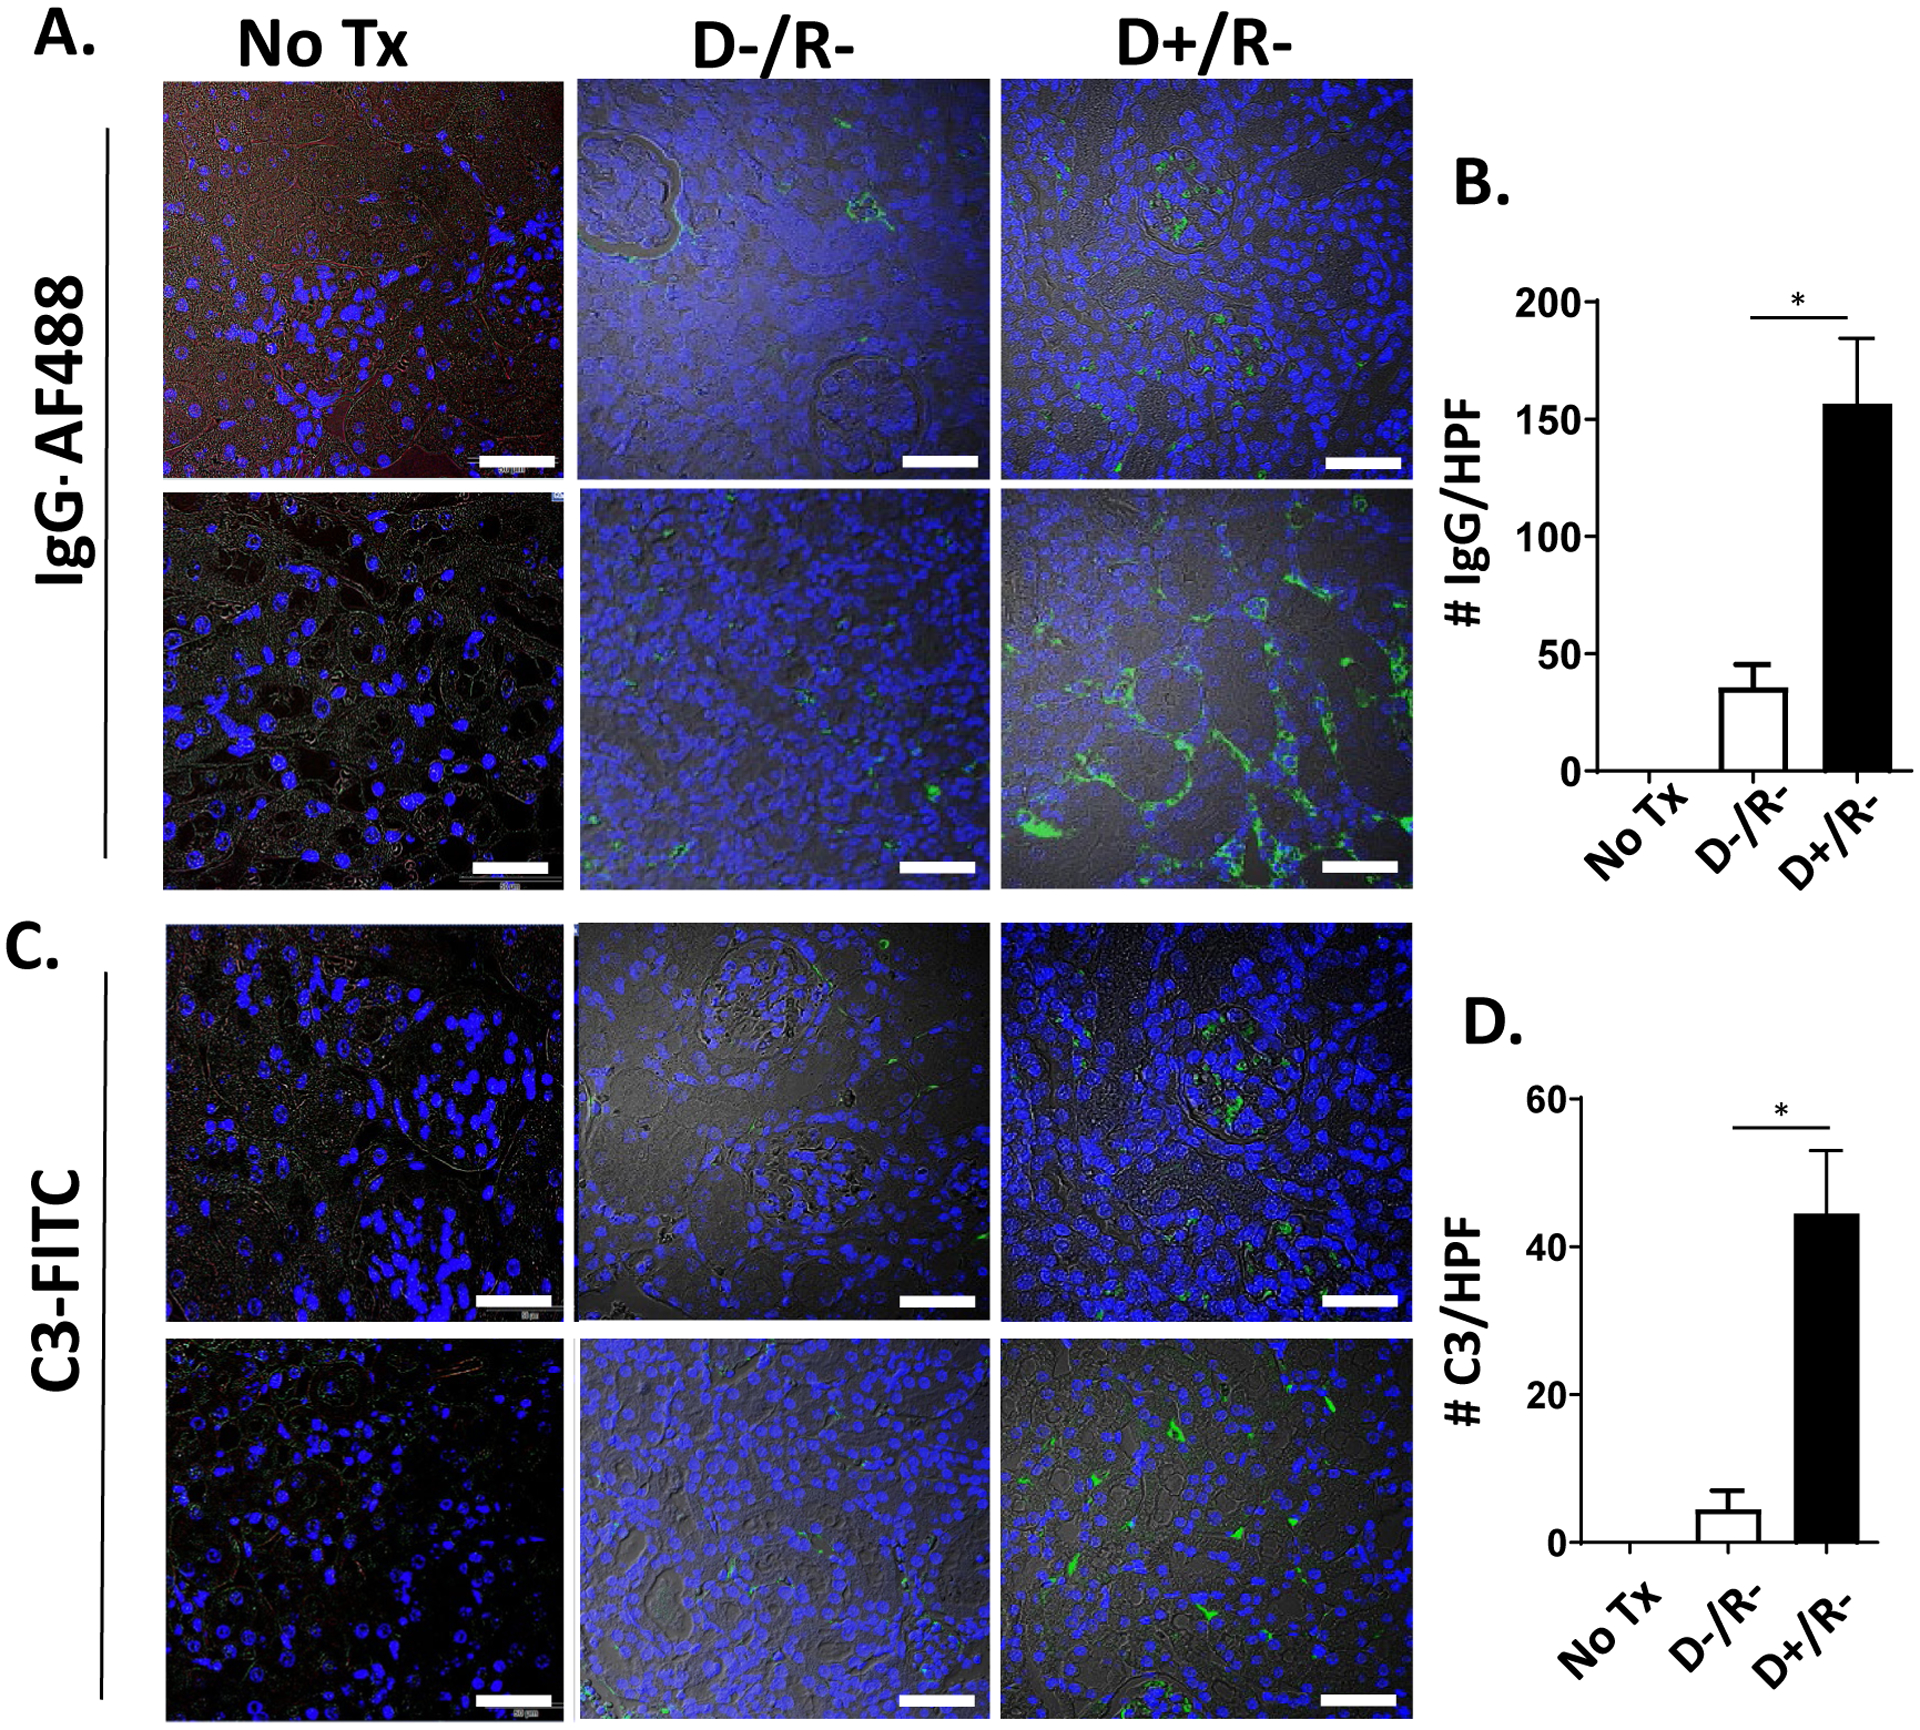
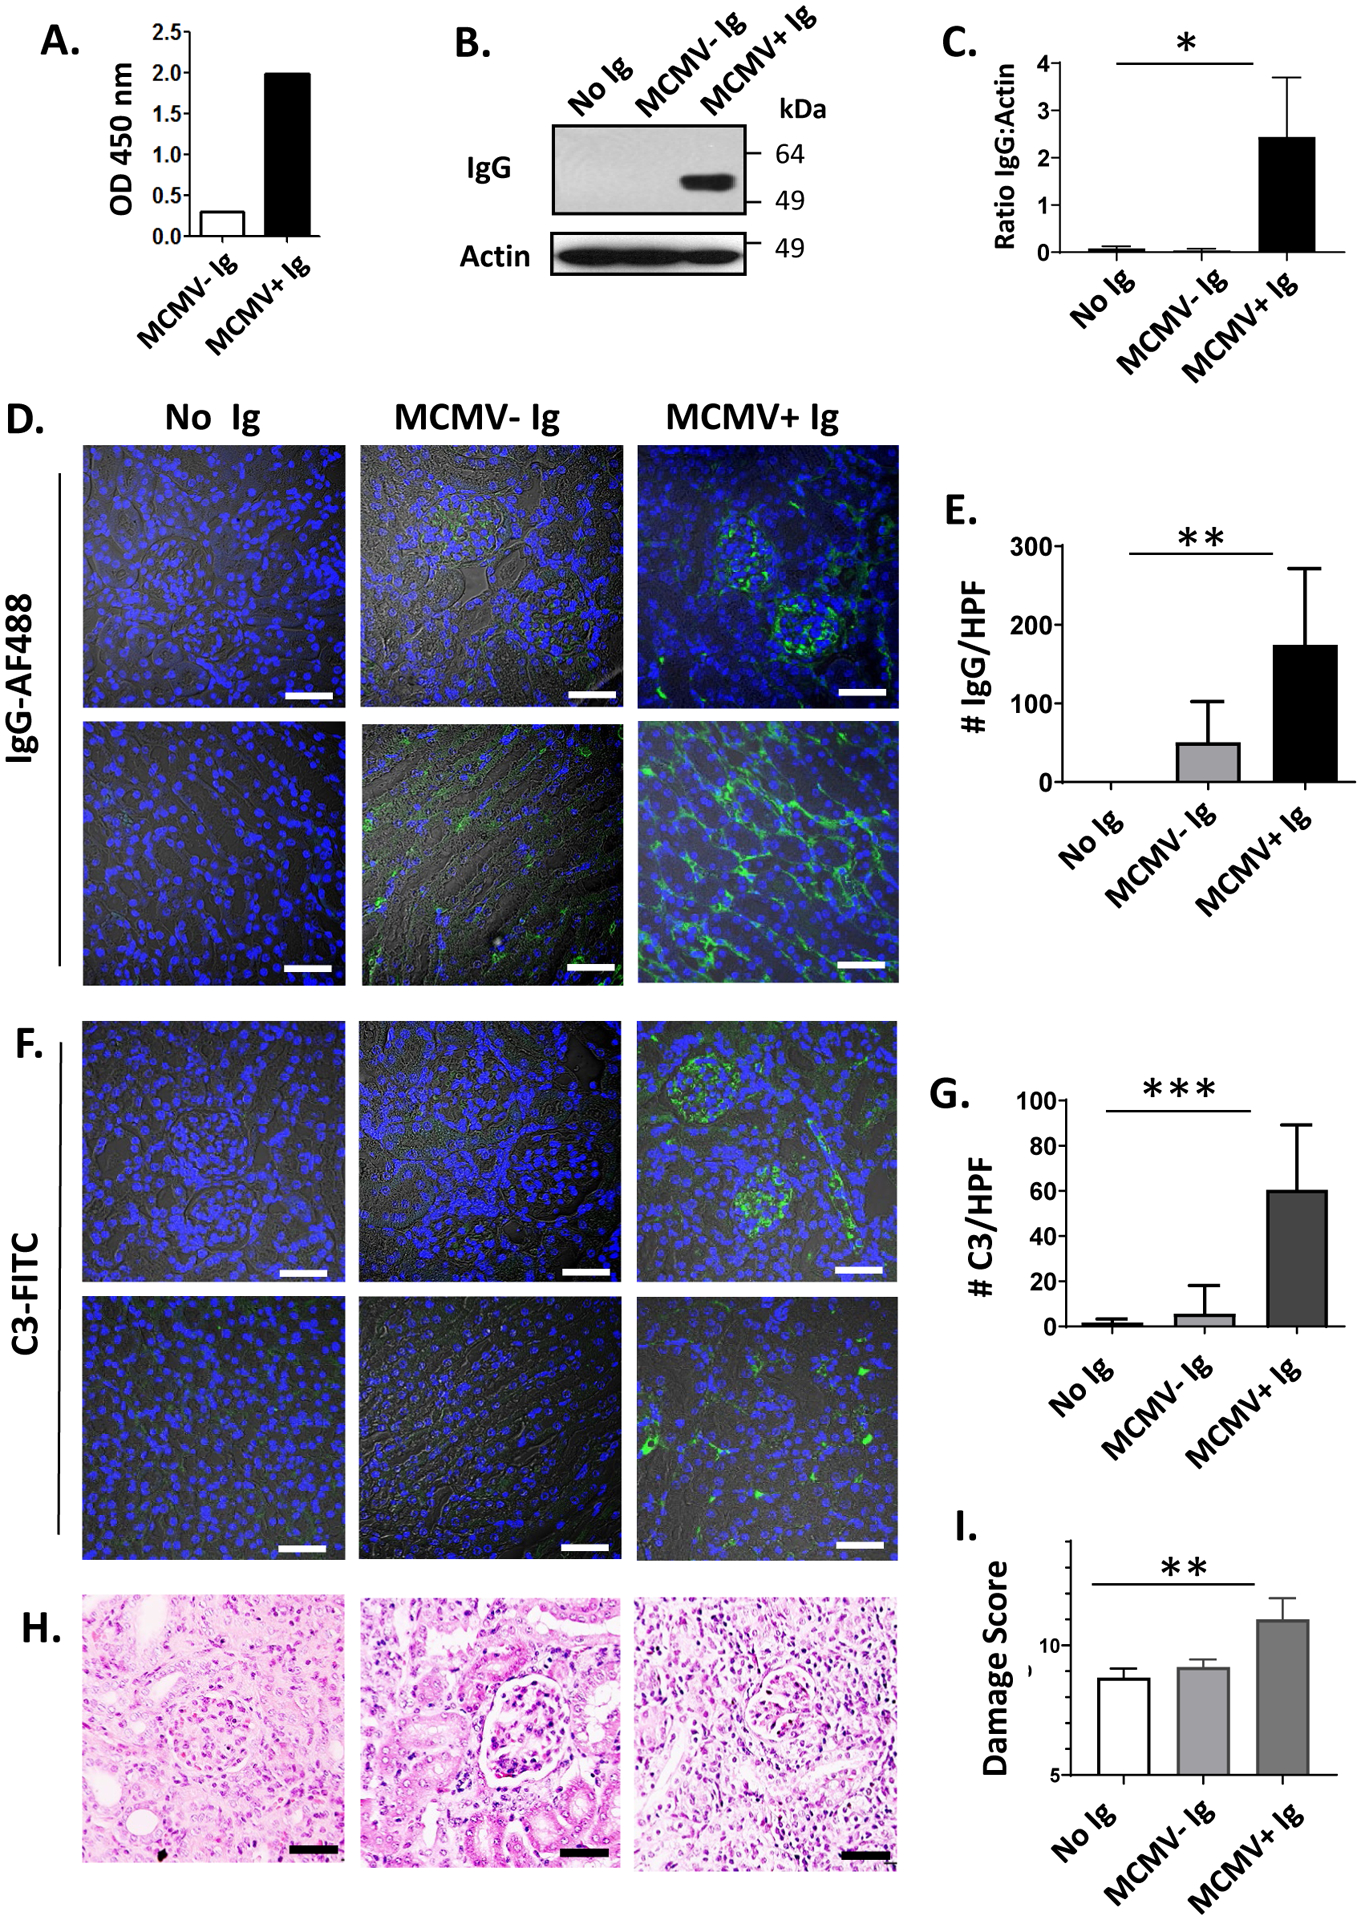
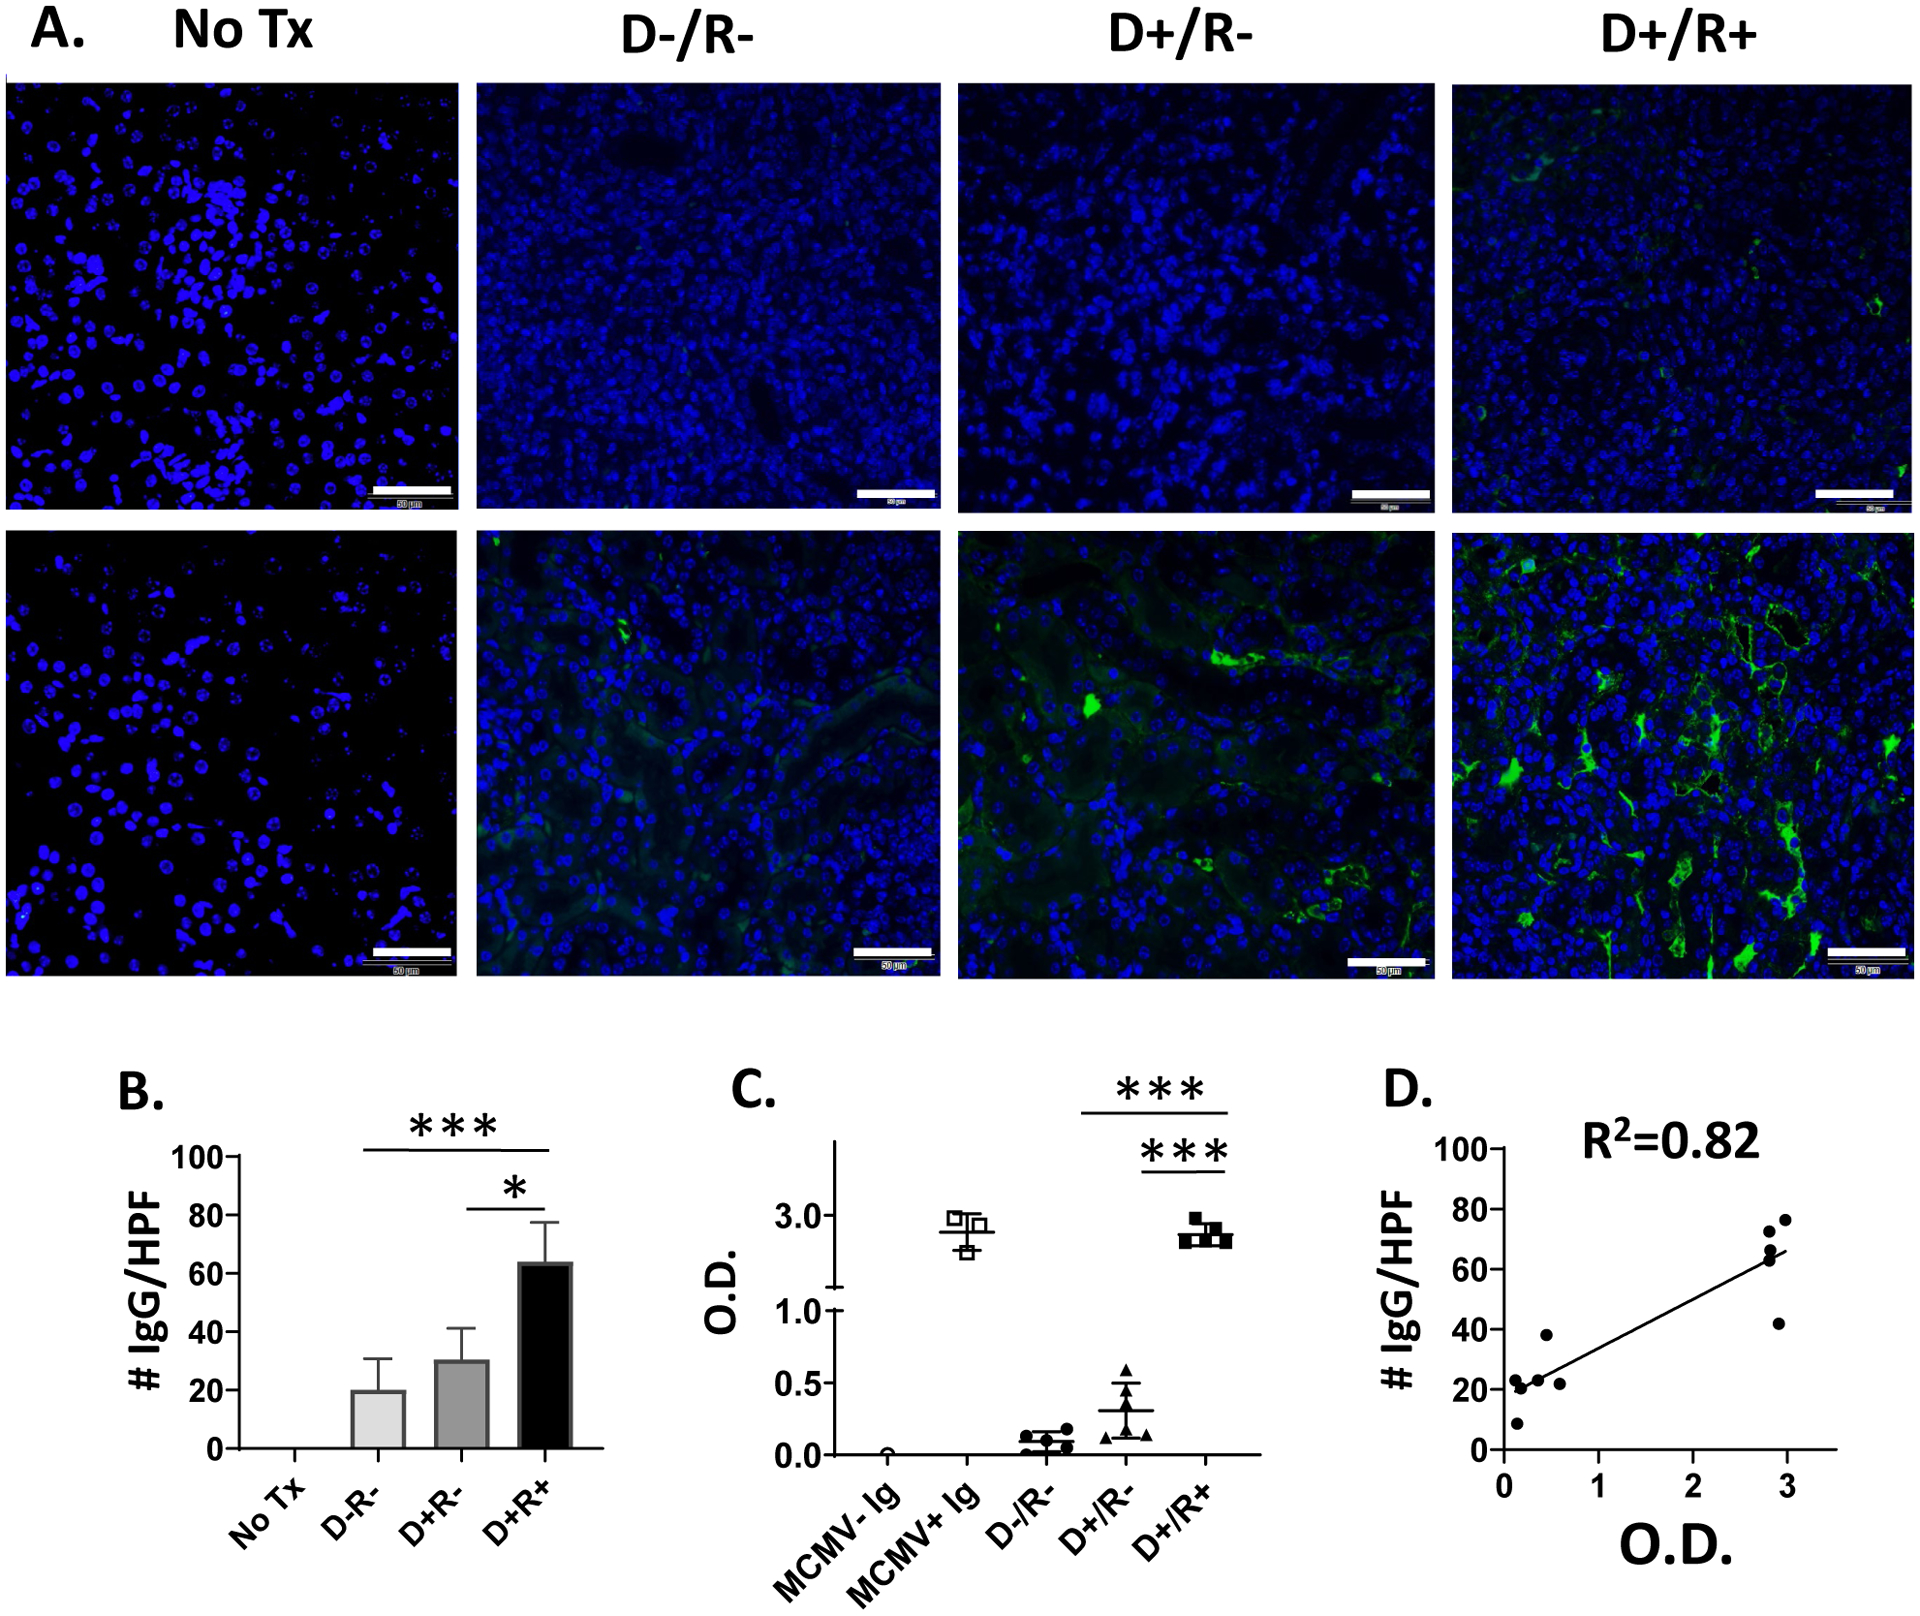
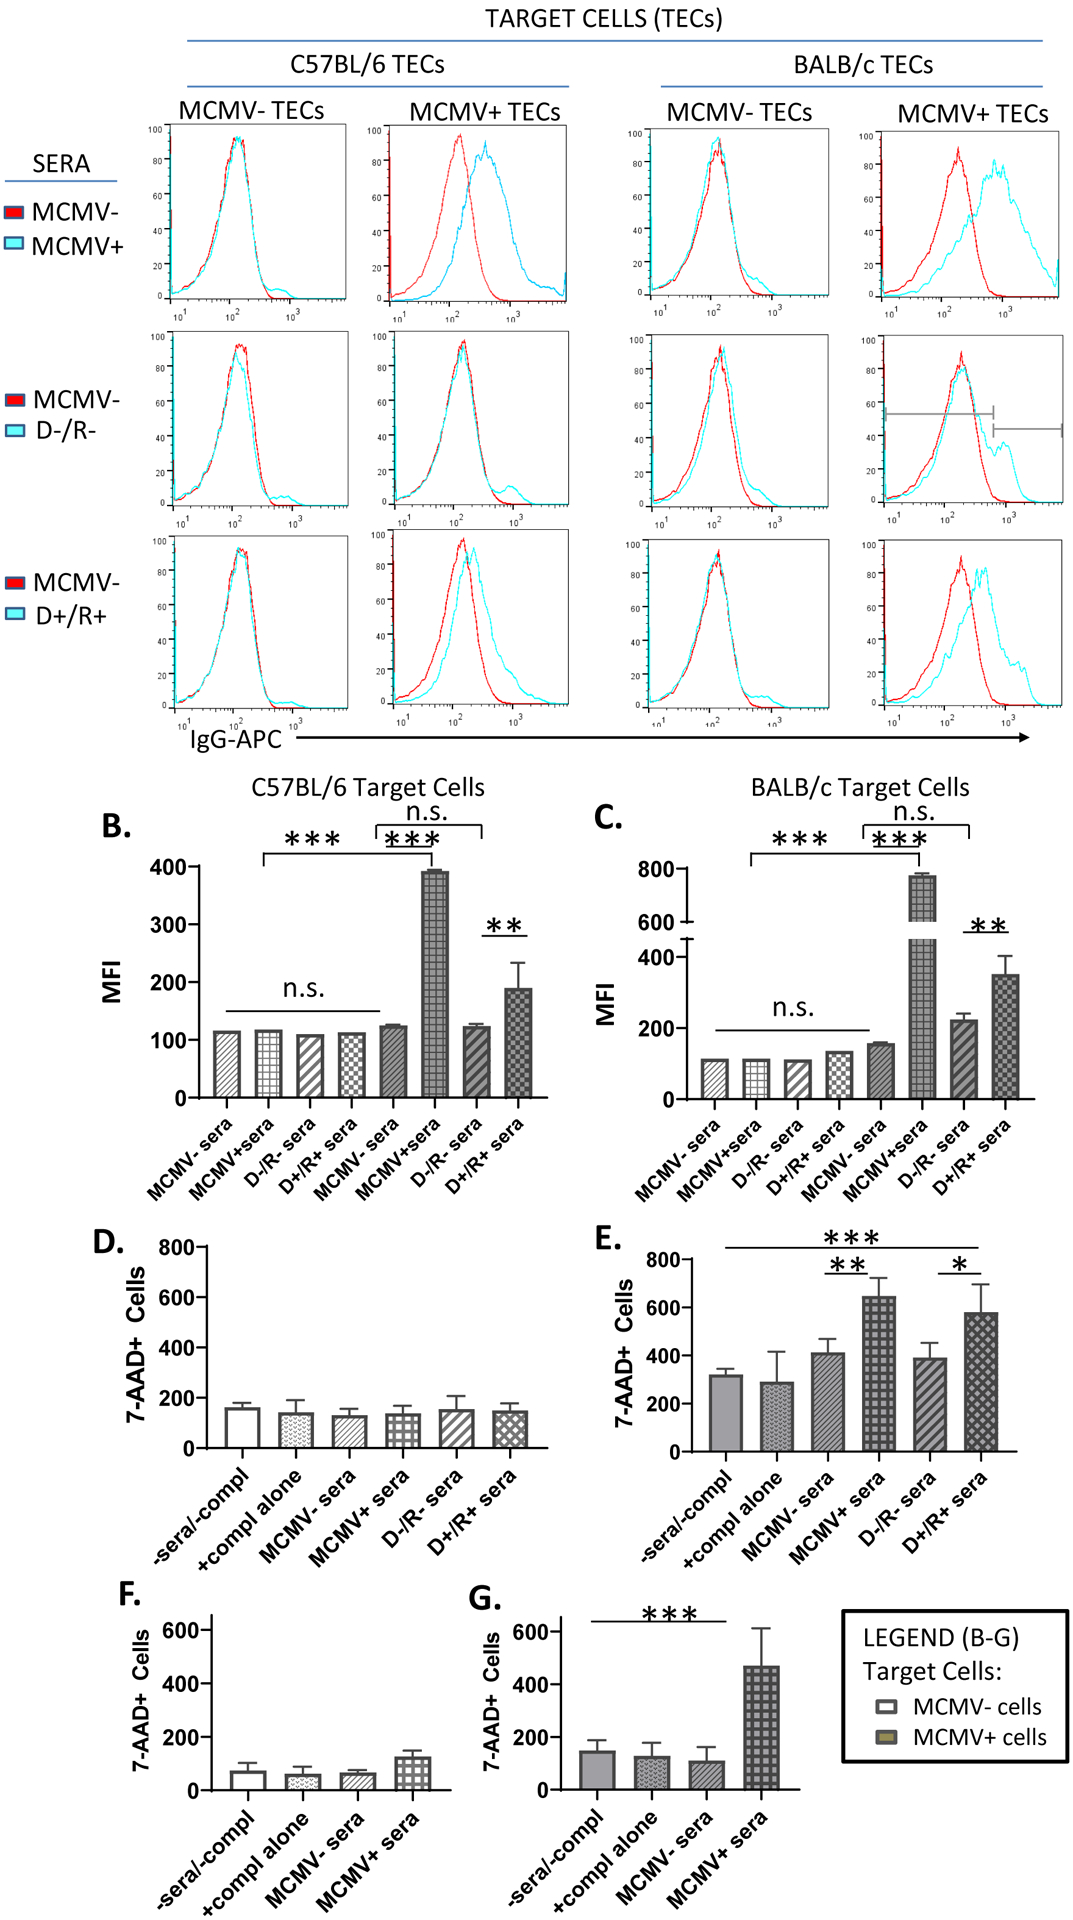
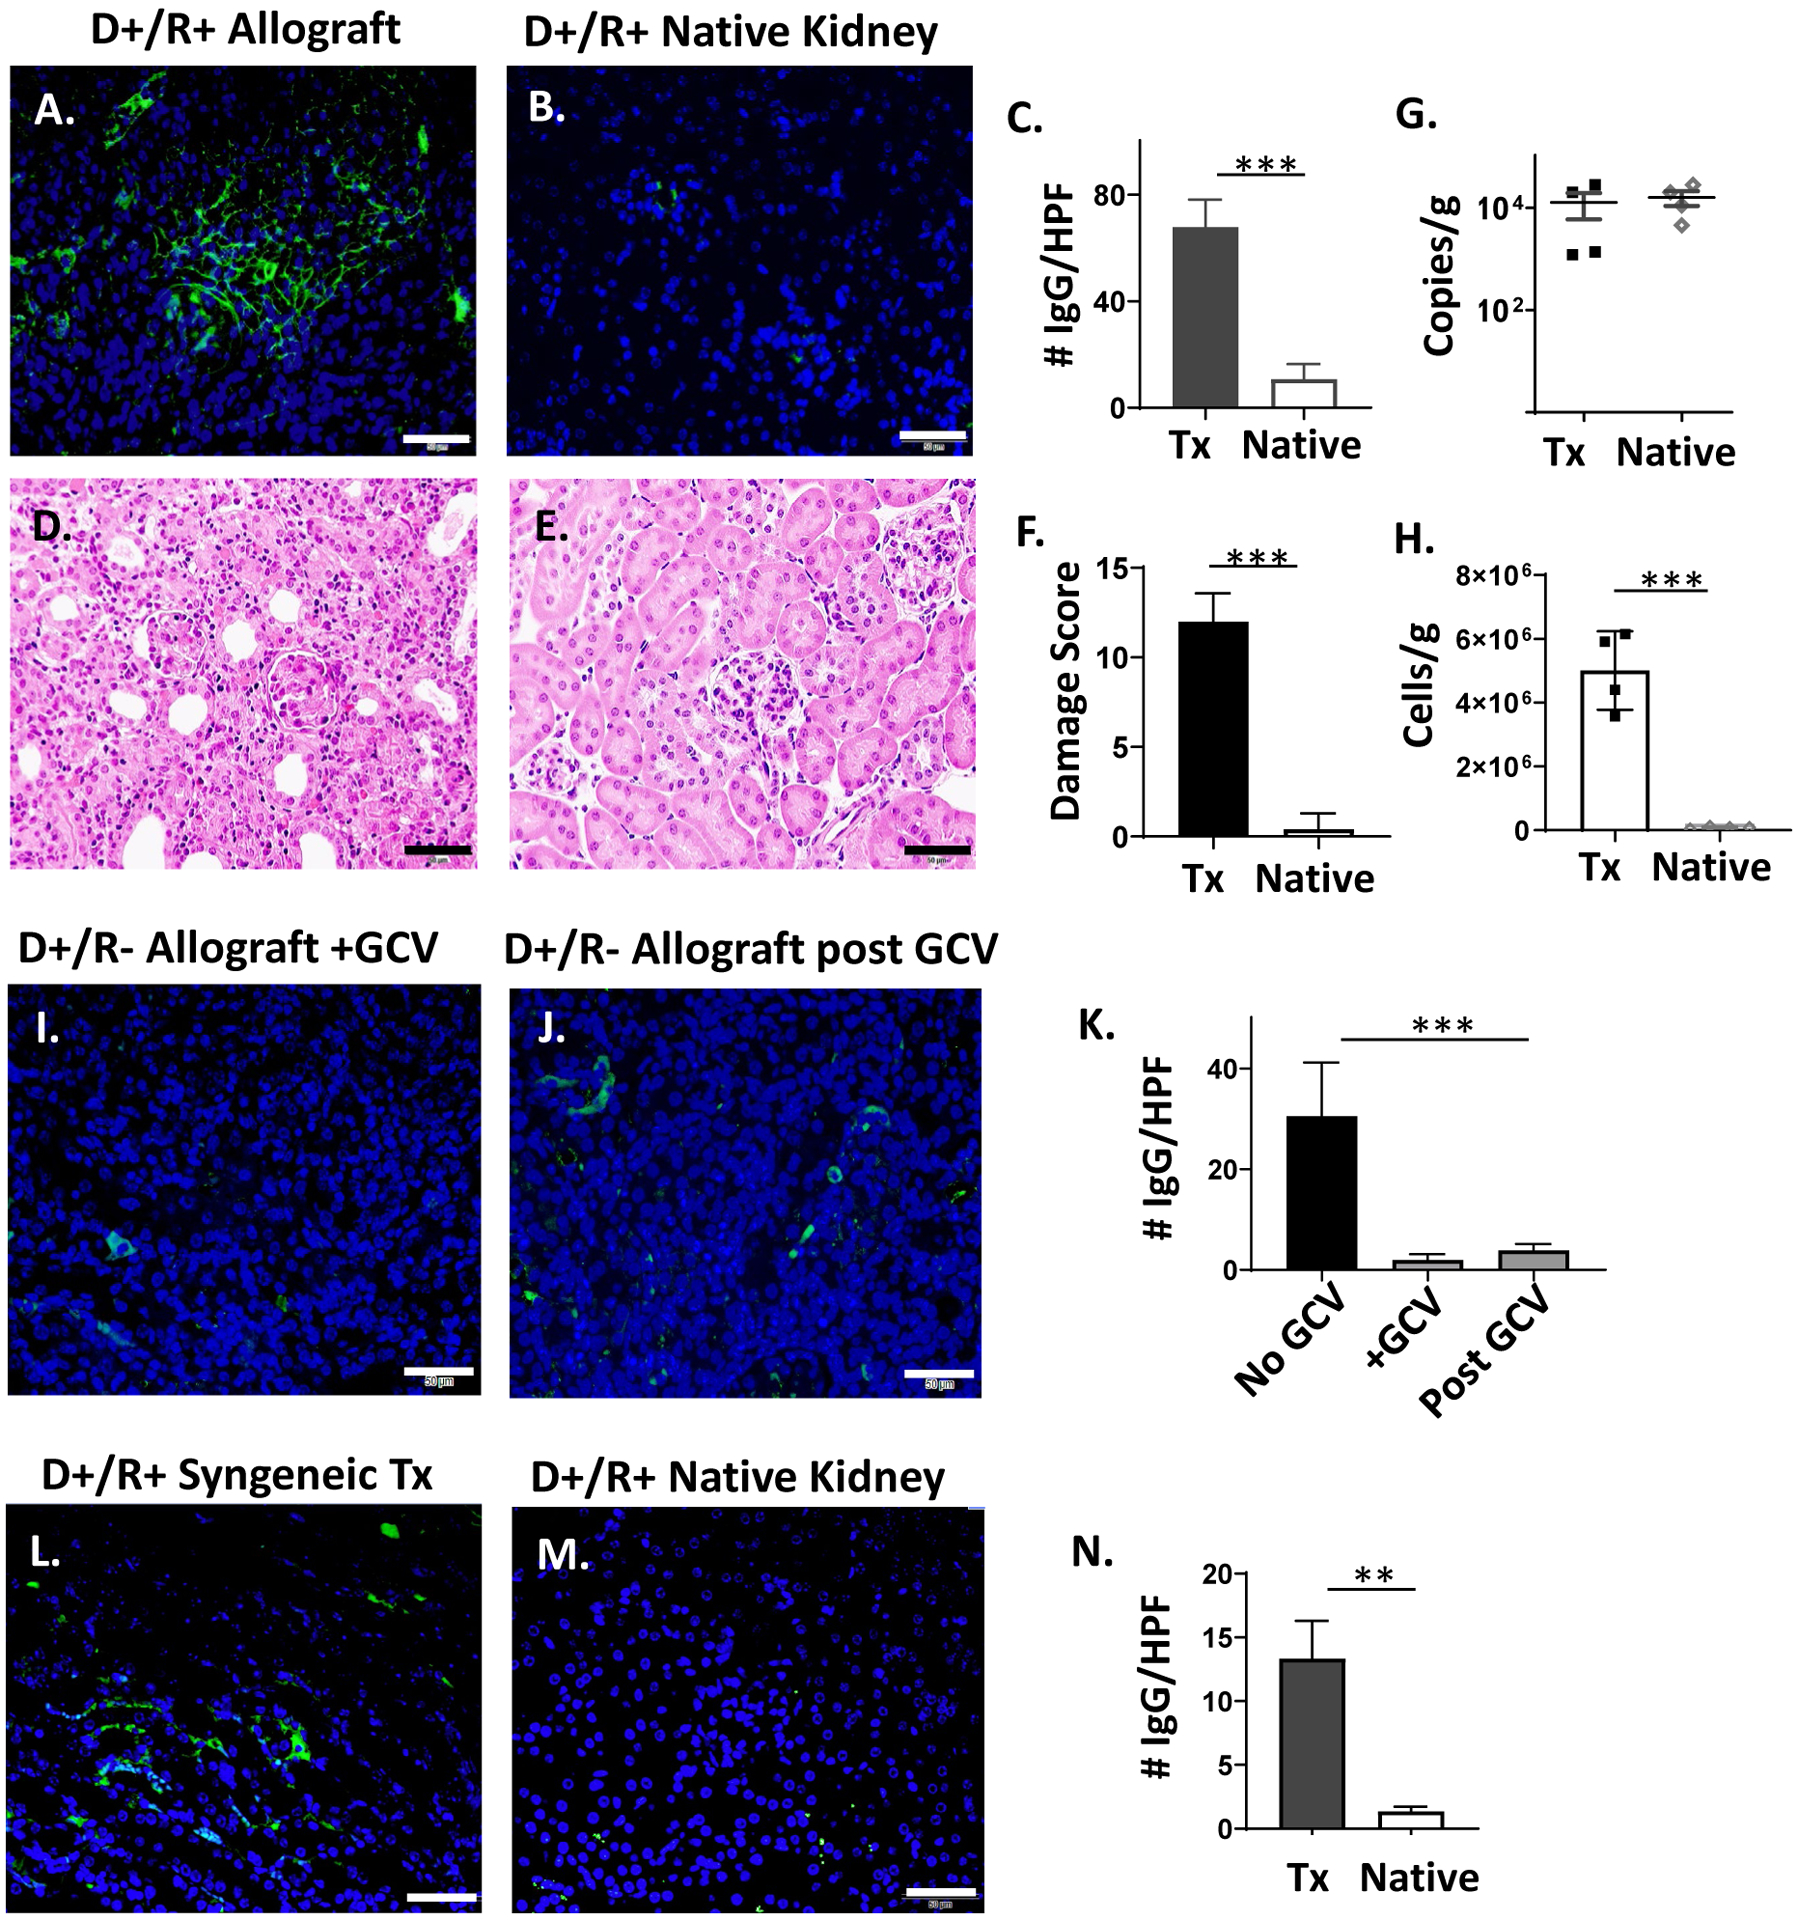
Methods: Intragraft immunoglobulin G (IgG) and complement C3 immunostaining were compared among allogeneic MCMV D-/R-, D+/R-, and D+/R+ renal transplants. Intragraft antibody deposition was examined in B cell-deficient recipients treated with MCMV immune sera. Antibody binding and complement-dependent cytotoxicity (CDC) of D-/R- and D+/R+ sera against infected renal tubular epithelial cells (TECs) were measured in vitro. IgG immunostaining was performed in D+/R+ allografts and native kidneys and in D+/R- allografts treated with ganciclovir to inhibit viral replication.

Results: D+/R- and D+/R+ transplants had more abundant IgG and C3 deposition compared with D-/R- recipients. Greater IgG deposition was associated with more severe allograft injury in B cell-deficient recipients treated with MCMV immune sera compared with nonimmune sera. D+/R+ sera induced greater CDC of infected TECs compared with D-/R- sera. Native kidneys had lower IgG deposition compared with allografts, despite similar organ viral loads. Ganciclovir-treated allografts had reduced IgG deposition compared with untreated allografts.

Conclusions: In this murine model, complement-fixing antibodies can deposit into MCMV-infected renal allografts, are associated with allograft damage, and can induce CDC of MCMV-infected renal TECs. The allogeneic response and viral replication may also contribute to intragraft antibody deposition.


Conflict of interest statement

The authors declare no conflicts of interest.

Figures

FIGURE 1.
FIGURE 1.
IgG and C3 staining of CMV infected and uninfected renal allografts. (A, C) Allografts of MCMV D−/R− and D+/R− transplants, without immunosuppression, were fixed at post-transplant day 7 and stained with IgG-AF488 (A) or C3-FITC (C). Kidneys from non-transplant C57BL/6 mice (“No Tx”) served as staining controls (left panels). Representative images of cortex (upper panels) and medulla (lower panels) are shown, with brightfield overlay to orient tissue morphology (60x; white bar=50 μm). (B, D) Fluorescence immunostaining for IgG (B) or C3 (D) was quantitated for 10 high power fields (HPF) per kidney using Image J software. Average positive staining was calculated for each graft and compared among the groups (n=3/group). * p<0.05.
FIGURE 2.
FIGURE 2.
Adoptive transfer of MCMV immune or nonimmune sera into D+/R− μMT transplants. (A) Sera from uninfected (MCMV− Ig) or MCMV infected (MCMV+ Ig) C57BL/6 mice were pooled and anti-MCMV antibody titers measured by ELISA at 450 nm optical density (O.D.). (B-I). D+/R− transplants were performed using μMT recipients, which were treated post-transplant with no Ig, MCMV− Ig, or MCMV+ Ig (n=3/experimental group). (B, C) Western blots of allograft lysates at post-transplant day 3 were probed using anti-mouse IgG and anti-actin antibodies (B), and the IgG:actin ratio quantitated (C) using Image J. (D-G) Allografts from μMT recipients at post-transplant day 3 were stained for IgG-AF488 (D) or C3-FITC (F). Representative images of cortex (upper panels) and medulla (lower panels) are shown, with brightfield overlay to orient tissue morphology (60x; white bar=50 μm). Immunostaining for IgG (E) or C3 (G) was quantitated using Image J as in Figure 1, and compared between groups receiving no Ig, MCMV− Ig, or MCMV+ Ig. (H-I) Allografts at day 14 post-transplant were stained using hematoxylin and eosin (H) and damage scores quantitated (I). * p<0.05; ** p<0.01; *** p<0.001.
FIGURE 3.
FIGURE 3.
IgG deposition in allografts with immunosuppression. (A) Allografts of cyclosporine-immunosuppressed MCMV D−/R−, D+/R− and D+/R+ recipients were stained with IgG-AF488 at day 14 post-transplant (n=5–6/group). Kidneys from non-transplant C57BL/6 mice (“No Tx”) served as staining controls (left panels, n=3). Representative images of cortex (upper panel) and medulla (lower panel) are shown (40x; white bar=50 μm). (B) Fluorescence immunostaining was quantitated for 10 HPF per kidney using Image J and compared between groups. (C) MCMV− Ig, MCMV+ Ig, or sera from immunosuppressed D−/R−, D+/R− or D+/R+ transplant recipients were analyzed by ELISA for anti-MCMV antibodies at OD450 (O.D). (D) Serologic anti-MCMV antibody levels (O.D.) were correlated with allograft IgG immunostaining for D+/R− and D+/R+ transplant recipients. * p<0.05; *** p<0.001.
FIGURE 4.
FIGURE 4.
Antibody binding and complement dependent cytotoxicity of MCMV-infected target cells. (A) Uninfected or MCMV-GFP infected B6 or BALB/c renal tubular epithelial cells (TECs) were incubated either with sera from MCMV nonimmune B6 mice (MCMV−, red lines), or from MCMV immune (MCMV+) B6 mice, D−/R− or D+/R+ recipients (blue lines). IgG binding to target cells was identified by staining with anti-mouse IgG-APC antibodies and detection by flow cytometry. Histogram subgating is shown with gray bars. (B, C) Mean fluorescence intensity (MFI) of IgG binding was compared among groups for both uninfected (white bars) and MCMV-infected (gray bars) B6 (B) or BALB/c (C) TEC target cells. (D-E) A complement dependent cytotoxicity (CDC) assay using uninfected (D) or MCMV-GFP infected (E) BALB/c 3T3 target cells was performed by incubation of target cells with MCMV−/+ sera or transplant sera as in (A), in the presence of rabbit complement for 3 hours. Cytotoxicity was quantitated using 7-AAD staining. Cells incubated without sera or complement (-sera/-compl) or with complement alone (+compl alone) were included as controls. (F-G). CDC assay was repeated using MCMV−/+ sera and BALB/c TEC target cells, as described for (D-E). (A-G) All experiments were performed 3 times and representative experiments are shown. * p<0.05; ** p<0.01; *** p<0.001.
FIGURE 5.
FIGURE 5.
IgG immunostaining of D+/R+ native kidneys and D+/R− allografts treated with ganciclovir. (A-B) Allografts and native kidneys of D+/R+ recipients were stained with IgG-AF488 as in Fig. 1. (C) IgG immunostaining was quantitated for 10 HPF and compared between transplant (Tx) and native kidneys (n=4/group). (D-F) Hematoxylin and eosin staining of allografts (D) and native kidneys (E) were scored for organ injury, and damage scores (F) compared between Tx and native kidneys. (G) MCMV viral loads in Tx and native kidneys were compared by quantitative DNA PCR. (H) CD45+ cell infiltrates in Tx and native kidneys were quantified by flow cytometry. (I-K) D+/R− recipients were treated with ganciclovir (GCV) for 14 days (I), or for 14 days followed by 7 days without antiviral treatment (J). Allografts were stained for IgG-AF488 (I-J) and quantitated (K) using Image J in comparison with IgG staining of day 14 D+/R− allografts without ganciclovir treatment (Fig. 3). (L-N) D+/R+ syngeneic grafts and native kidneys of immunosuppressed recipients were stained for IgG and quantitated using Image J (n=3). (A-J) Representative images are shown (40x, bar=50 μm). ** p<0.01; *** p<0.001.

Comment in

Similar articles

Cited by

References

    1. Freeman RB Jr. The ‘Indirect’ effects of cytomegalovirus infection. American Journal of Transplantation. 2009;9(11):2453–2458. - PubMed
    1. Tong CYW, Bakran A, Peiris JSM, et al. The association of viral infection and chronic allograft nephropathy with graft dysfunction after renal transplantation. Transplantation. 2002;74:576–578. - PubMed
    1. Streblow DN, Orloff SL, Nelson JA. Acceleration of allograft failure by cytomegalovirus. Curr Opin Immunol. 2007;19(5):577–582. - PMC - PubMed
    1. Legendre C, Pascual M. Improving outcomes for solid organ transplant recipients at risk from cytomegalovirus infection: late onset disease and indirect consequences. Clinical Infectious Diseases. 2008;46(5):732–740. - PubMed
    1. Einollahi B, Motalebi M, Salesi M, et al. The impact of cytomegalovirus infection on new-onset diabetes mellitus after kidney transplantation: a review on current findings. Journal of nephropathology. 2014;3(4):139–148. - PMC - PubMed

Publication types