. 2020 Nov 19;11(1):5785.
doi: 10.1038/s41467-020-19558-3.

Functional compensation precedes recovery of tissue mass following acute liver injury

Affiliations

Functional compensation precedes recovery of tissue mass following acute liver injury

Chad M Walesky et al. Nat Commun. .

Abstract

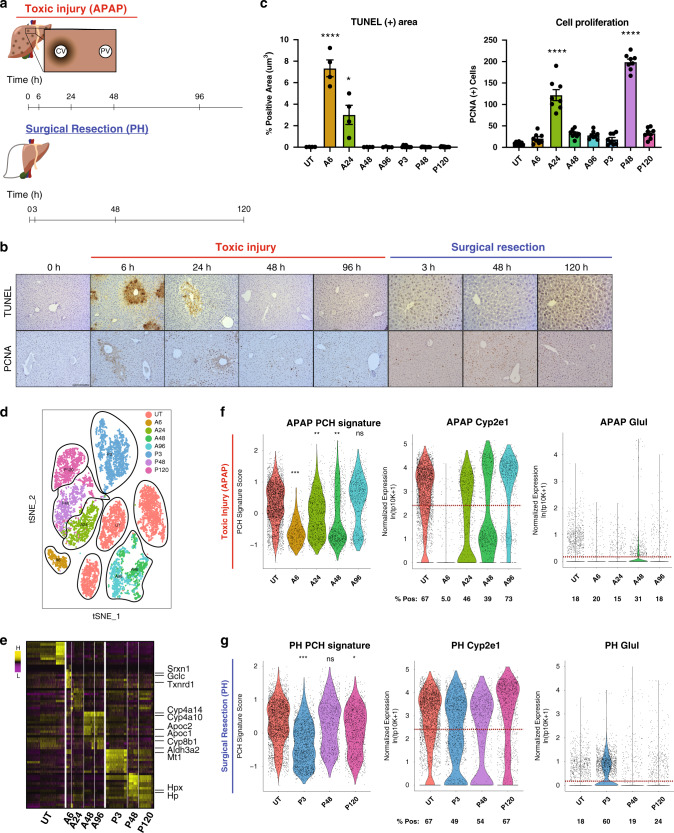
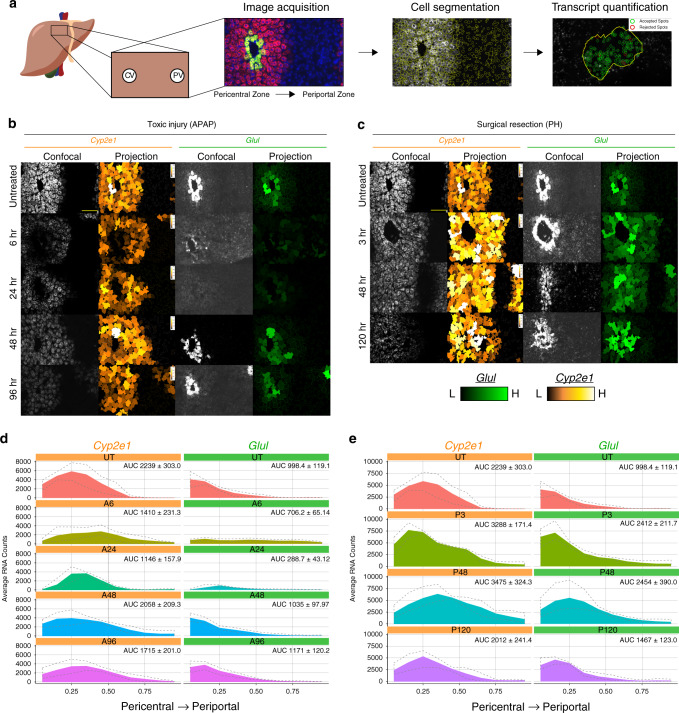
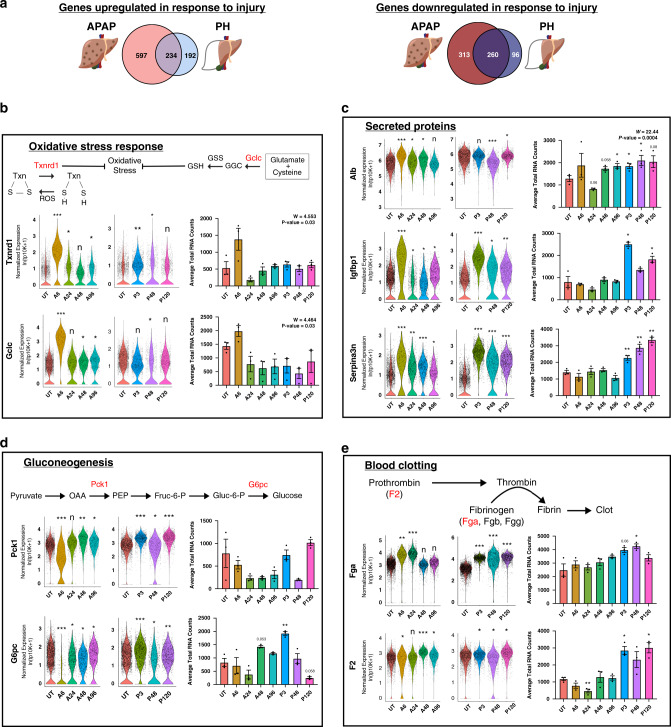
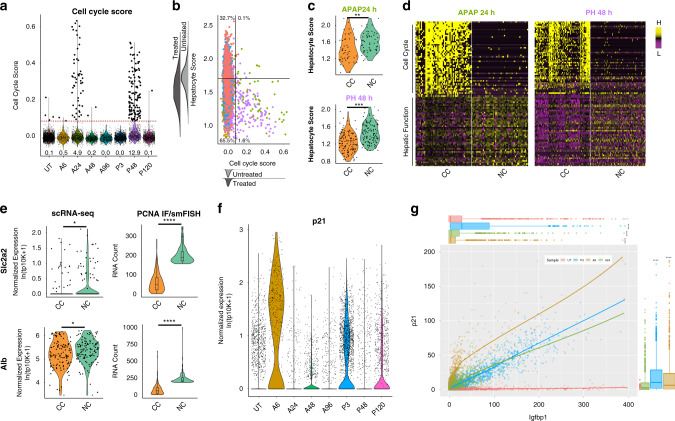
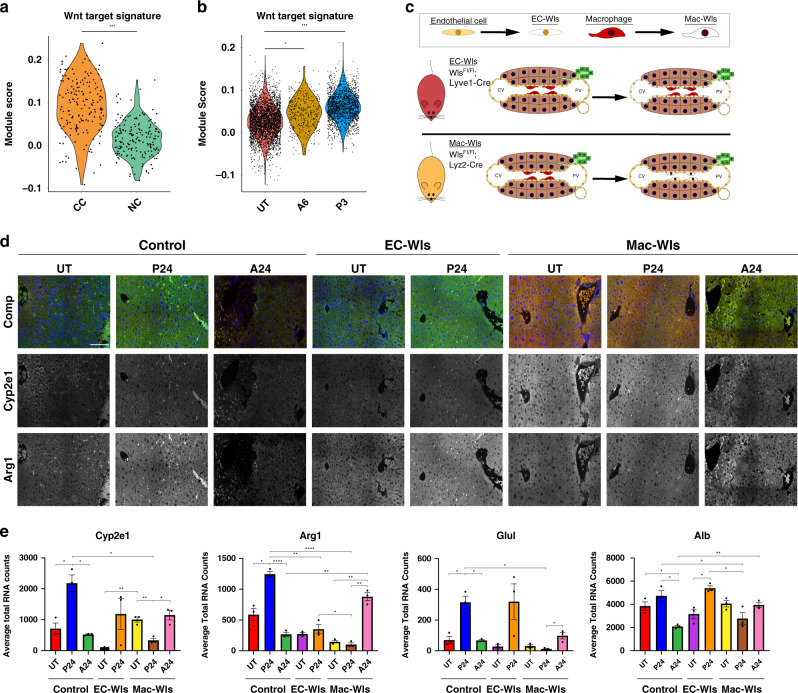
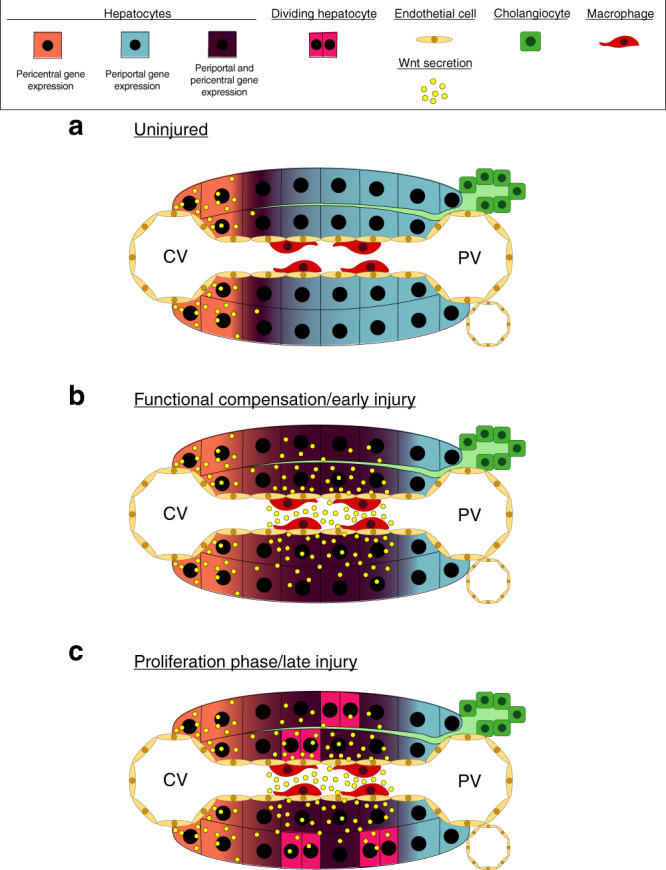
The liver plays a central role in metabolism, protein synthesis and detoxification. It possesses unique regenerative capacity upon injury. While many factors regulating cellular proliferation during liver repair have been identified, the mechanisms by which the injured liver maintains vital functions prior to tissue recovery are unknown. Here, we identify a new phase of functional compensation following acute liver injury that occurs prior to cellular proliferation. By coupling single-cell RNA-seq with in situ transcriptional analyses in two independent murine liver injury models, we discover adaptive reprogramming to ensure expression of both injury response and core liver function genes dependent on macrophage-derived WNT/β-catenin signaling. Interestingly, transcriptional compensation is most prominent in non-proliferating cells, clearly delineating two temporally distinct phases of liver recovery. Overall, our work describes a mechanism by which the liver maintains essential physiological functions prior to cellular reconstitution and characterizes macrophage-derived WNT signals required for this compensation.


Conflict of interest statement

W.G. is a consultant for Camp4 Therapeutics. A.K.S. reports compensation for consulting and/or SAB membership from Merck, Honeycomb Biotechnologies, Cellarity, Cogen Therapeutics, Ochre Bio, and Dahlia Biosciences. S.P.M has an advisory board role for Surrozen. C.M.W., K.E.K., C.L.W., J.H., B.K., I.F., F.M., S.K., and U.A. have no competing interests to declare.

Figures

Fig. 1
Fig. 1. Hepatocyte response to toxic and surgical liver injuries.
a Time course depicting analysis time points during liver injury recovery following APAP overdose or PH. b Murine liver sections (5 μm, n = 3) show necrotic TUNEL-positive (brown, top) and proliferative PCNA-positive (brown, bottom) cells. Scale bar is 100 μm. c Bar graphs quantifying total TUNEL- and PCNA-positive area. Error bars are s.e.m., P < 0.05 (*), < 0.01 (**), and < 0.0001 (****) calculated using unpaired t test with Welch’s correction (two-tailed). d t-SNE plot of all high-quality hepatocytes (Methods) in the scRNA-Seq dataset. Cells are colored by injury mode and time point. SNN clusters outlined in black. e Heatmap of marker genes for all clusters outlined in (d). f, g Pericentral Hepatocyte Signature Score (PCH Signature Score) (left). Violin plot of normalized expression of Cyp2e1 (middle) and Glul (right); percent positive calculated as percentage of total cells in each condition above average normalized genes expression (dashed red line). Untreated (UT) and each post-treatment are plotted for APAP (f) and PH (g). Source data provided as a Source Data file.
Fig. 2
Fig. 2. Functional compensation of hepatocytes following acute liver injury.
a Schematic for staining and image quantification. b, c Images of liver section showing pericentral markers Cyp2e1 and Glul for untreated and each APAP-treated (b) or PH-treated (c) time point (left column). Cell outlined and colored by number of Cyp2e1 transcripts (brown, low; white, high) for each condition (middle column). Cell outlined and colored by number of Glul transcripts (black, low; bright green, high) for each condition (right column). Scale bars are 100 μm. d, e Quantification of gene expression intensity across the lobule for Cyp2e1 and Glul. 90% of area under the curve (AUC) for UT is to the left dashed red line. treated (d) and PH-treated (e). Source data provided as a Source Data file.
Fig. 3
Fig. 3. Shared and unique gene expression responses in acute liver injury models.
a Venn diagram showing genes significantly changed in response to APAP and/or PH treatment compared to untreated. b Expression of oxidative stress response genes (Txnrd1 and Gclc) significantly upregulated in APAP treatment response. ce Expression of genes representing specific hepatic functions (c, secreted proteins; d, gluconeogenesis; e, blood clotting). scRNA-seq data (left) presented as violin plots. smFISH quantification (right) shown as bar plot with individual replicates presented as dots (n = 3). Error bars are s.e.m., P < 0.05 (*), < 0.005 (**), < 0.0005 (***), and < 0.0001 (****) calculated using unpaired t tests with Welch’s correction (two-tailed) comparing untreated group (UT) to all other experimental groups. Source data provided as a Source Data file.
Fig. 4
Fig. 4. Identification and characterization of proliferating hepatocytes.
a Violin plot of cell cycle score across all samples. Cycling cells (CC, larger black dots) are identified as having a cell cycle score two standard deviations above average (dashed red line). Percentage of cycling cells in each condition listed below each violin. b Scatter plot of Hepatocyte Score versus Cell Cycle Score. Horizonal line represents average Hepatocyte Score calculated over all untreated cells. Vertical line represents two standard deviations above the average cell cycle score. c Violin plots on Hepatocyte Score for all APAP 24 h cycling cells (CC) and an equal number of non-cycling cells (NC) from APAP24 (top) and the same for PH48 CC and NC (bottom). scRNA-seq effect size by absolute value of Cohen’s d > 0.2; *, d > 0.5; **, d > 0.8; ***. d Heatmap of marker genes of CC and NC in APAP 24 h and PH 48 h. e Violin plots of Alb and Slc2a2 in CC and NC cells as measured by scRNA-seq (left) and by co-staining of PCNA and smFISH within tissue sections from P24 (right). scRNA-seq effect size by absolute value of Cohen’s d > 0.2; *, d > 0.5; **, d > 0.8; ***. smFISH data tested using an unpaired t test with Welch’s correction (two-tailed; ****, P < 0.0001). f Violin plot of p21 expression in scRNA-seq dataset. g Quantification of RNA counts of p21 versus Igfbp1. Box plots represent data for both axes. Source data provided as a Source Data file.
Fig. 5
Fig. 5. Contribution of Wnt signaling to functional compensation of hepatocytes.
Wnt target gene expression score over cycling cells (CC) and non-cycling cells (NC) from A24 and PH48 (a) and hepatocytes grouped by treatment condition (UT, A6, and P3) (b). c Wnt knockout mouse models. d Hepatocyte marker expression (Alb and Arg1) in untreated, P24, and A24 for wild type (Control), endothelial cell Wntless KO (EC-Wls), and macrophage Wntless KO (Mac-Wtls) by smFISH. Representative image taken from three independent liver lobules. Scale bar is 100 μm. (e) Average RNA expression of hepatocyte markers (Alb, Arg1, Cyp2e1, and Glul) in untreated, P24 hr, and A24 for WT, EC-Wls, and Mac-Wtls by smFISH. smFISH quantification shown as bar plot with individual replicates presented as dots (n = 3). Error bars represent s.e.m., P < 0.05 (*), < 0.005 (**), < 0.0005 (***), and < 0.0001 (****) calculated using unpaired t tests with Welch’s correction (two-tailed). Source data provided as a Source Data file.
Fig. 6
Fig. 6. Model of hepatocyte response to acute liver injury.
a Wnt secretion from the pericentral endothelium functions in the maintenance of the pericentral gene expression gradient in normal, quiescent liver. b Wnt secretion from macrophages aids in functional compensation of midzonal and periportal hepatocytes during the pre-proliferation phase of acute liver injury. c Wnt secreation is essential for both functional compensation and activation of the proliferative response during regeneration. Compensating hepatocytes contribute to a maintenance of hepatic function, whereas proliferating hepatocytes selectively down-regulate a subset of hepatic genes.

References

    1. Kietzmann T. Metabolic zonation of the liver: the oxygen gradient revisited. Redox Biol. 2017;11:622–630. - PMC - PubMed
    1. Budnitz DS, Lovegrove MC, Crosby AE. Emergency department visits for overdoses of acetaminophen-containing products. AMEPRE. 2011;40:585–592. - PubMed
    1. Couri T, Pillai A. Goals and targets for personalized therapy for HCC. Hepatol. Int. 2019;13:125–137. - PubMed
    1. Michalopoulos GK. Hepatostat: Liver regeneration and normal liver tissue maintenance. Hepatology. 2017;65:1384–1392. - PubMed
    1. Michalopoulos GK. Liver regeneration after partial hepatectomy: critical analysis of mechanistic dilemmas. Am. J. Pathol. 2010;176:2–13. - PMC - PubMed

Publication types

MeSH terms