. 2020 Nov 19;10(1):20165.
doi: 10.1038/s41598-020-77159-y.

Loss of the spectraplakin gene Short stop induces a DNA damage response in Drosophila epithelia

Affiliations

Loss of the spectraplakin gene Short stop induces a DNA damage response in Drosophila epithelia

Evan B Dewey et al. Sci Rep. .

Abstract

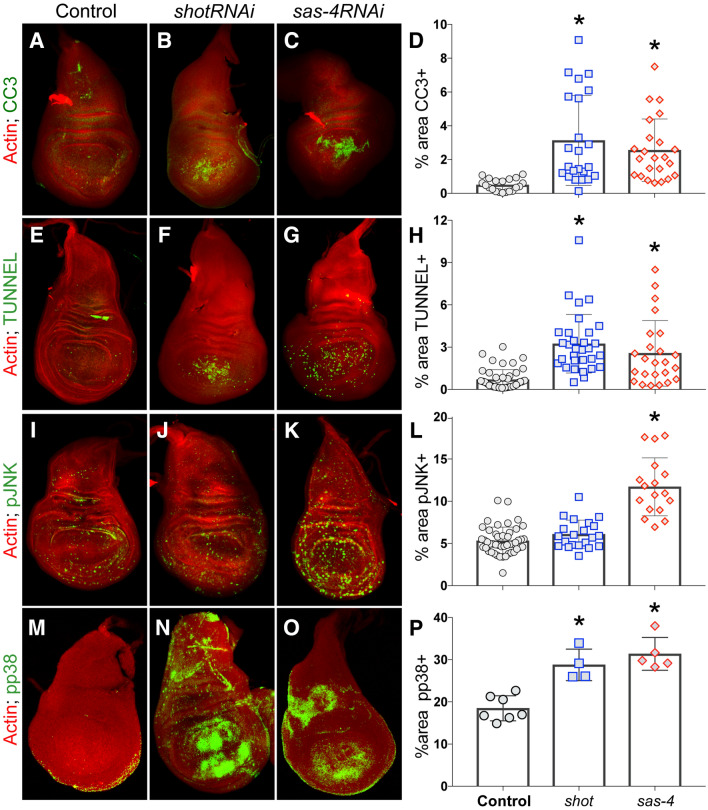
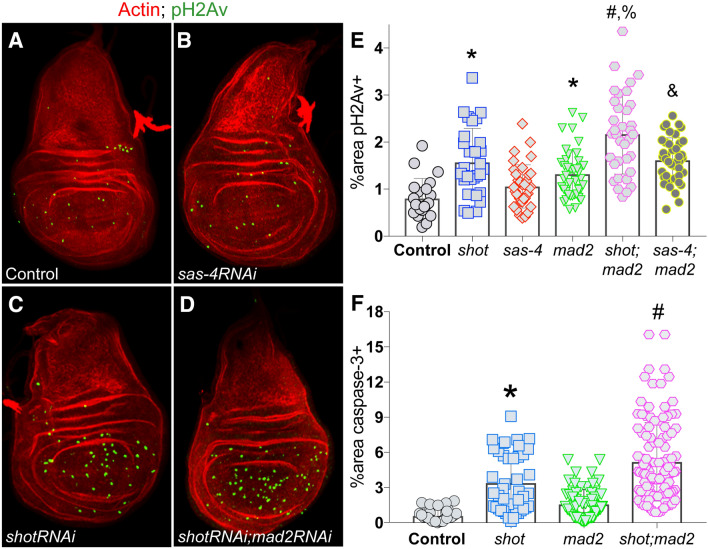
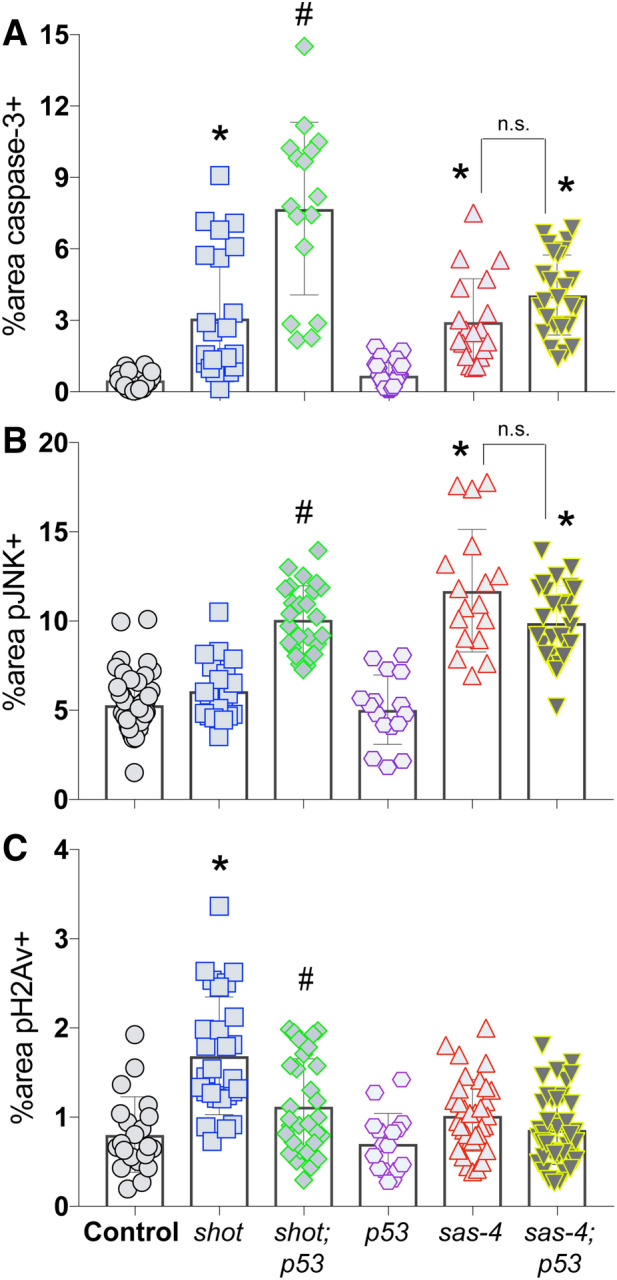
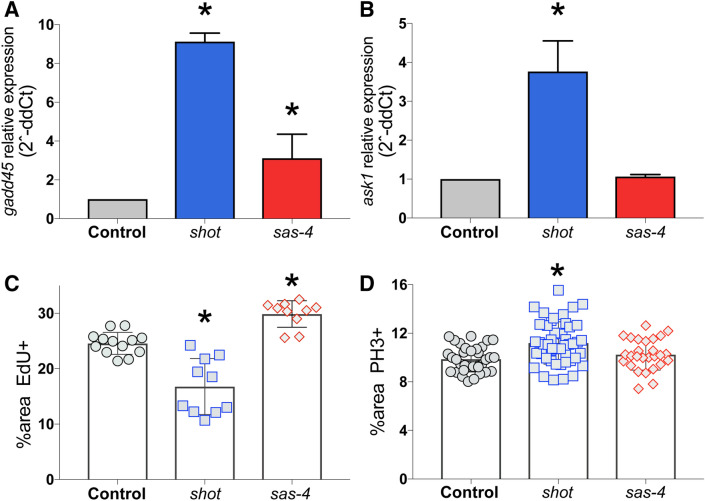
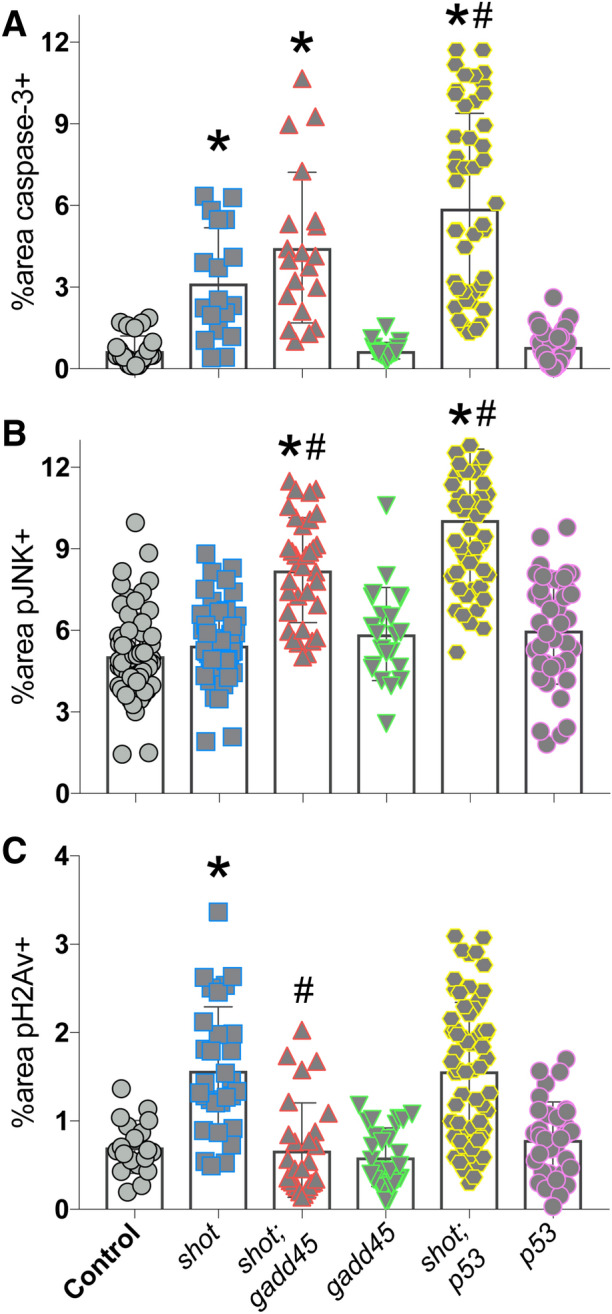
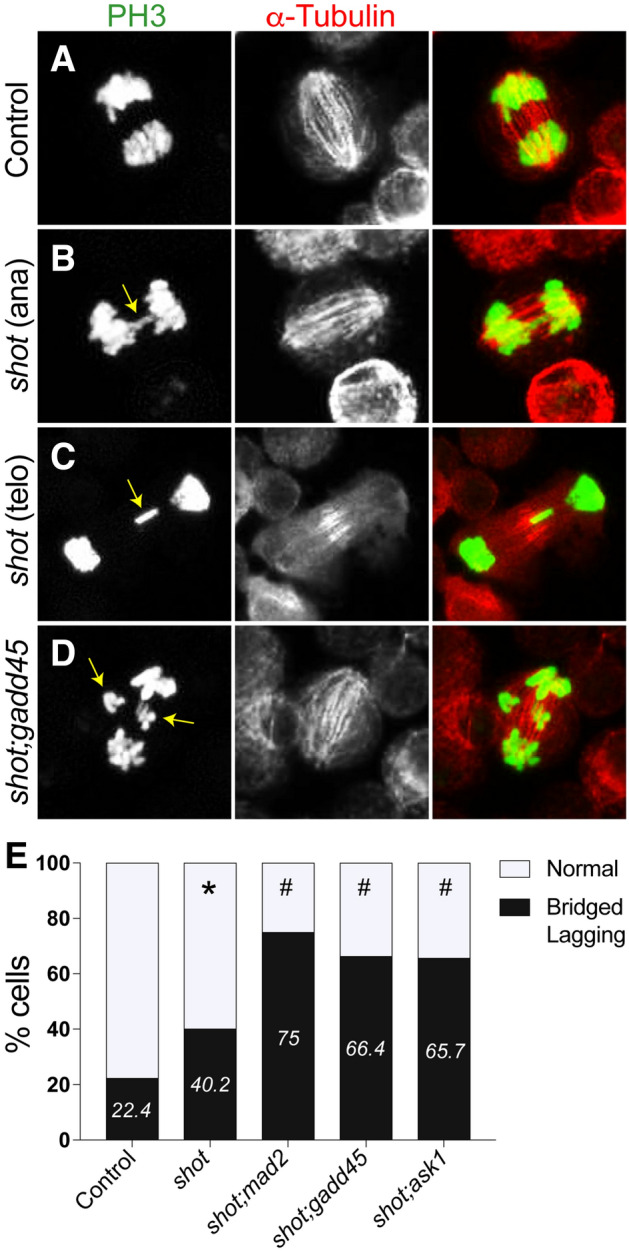
Epithelia are an eminent tissue type and a common driver of tumorigenesis, requiring continual precision in cell division to maintain tissue structure and genome integrity. Mitotic defects often trigger apoptosis, impairing cell viability as a tradeoff for tumor suppression. Identifying conditions that lead to cell death and understanding the mechanisms behind this response are therefore of considerable importance. Here we investigated how epithelia of the Drosophila wing disc respond to loss of Short stop (Shot), a cytoskeletal crosslinking spectraplakin protein that we previously found to control mitotic spindle assembly and chromosome dynamics. In contrast to other known spindle-regulating genes, Shot knockdown induces apoptosis in the absence of Jun kinase (JNK) activation, but instead leads to elevated levels of active p38 kinase. Shot loss leads to double-strand break (DSB) DNA damage, and the apoptotic response is exacerbated by concomitant loss of p53. DSB accumulation is increased by suppression of the spindle assembly checkpoint, suggesting this effect results from chromosome damage during error-prone mitoses. Consistent with DSB induction, we found that the DNA damage and stress response genes, Growth arrest and DNA damage (GADD45) and Apoptosis signal-regulating kinase 1 (Ask1), are transcriptionally upregulated as part of the shot-induced apoptotic response. Finally, co-depletion of Shot and GADD45 induced significantly higher rates of chromosome segregation errors in cultured cells and suppressed shot-induced mitotic arrest. Our results demonstrate that epithelia are capable of mounting molecularly distinct responses to loss of different spindle-associated genes and underscore the importance of proper cytoskeletal organization in tissue homeostasis.


Conflict of interest statement

The authors declare no competing interests.

Figures

Figure 1
Figure 1
Shot knockdown triggers apoptosis in Drosophila wing discs. (AD) Control wing discs or those expressing shotRNAi or sas-4RNAi were stained with phalloidin (actin; red) and cleaved caspase-3 (CC3; green) to mark apoptotic cells. Images were analyzed for the percent area of the wing pouch positive for CC3. *p < 0.01 compared to Control, ANOVA with Tukey’s post-hoc test. (EH) Control wing discs or those expressing shotRNAi or sas-4RNAi were stained with phalloidin (actin; red) and TUNNEL (green) to mark apoptotic cells. Images were analyzed for the percent area of the wing pouch positive for CC3. *p < 0.01 compared to Control, ANOVA with Tukey’s post-hoc test. (IL) Control wing discs or those expressing shotRNAi or sas-4RNAi were stained with phalloidin (actin; red) and active, phosphorylated JNK (pJNK; green). Images were analyzed for the percent area of the wing pouch positive for CC3. *p < 0.01 compared to Control, ANOVA with Tukey’s post-hoc test. (MP) Control wing discs or those expressing shotRNAi or sas-4RNAi were stained with phalloidin (actin; red) and active, phosphorylated p38 (pp38; green) to mark apoptotic cells. Images were analyzed for the percent area of the wing pouch positive for CC3. *p < 0.01 compared to Control; ANOVA with Tukey’s post-hoc test.
Figure 2
Figure 2
Shot knockdown induces double strand DNA damage in Drosophila wing discs. (AD) Representative images of wing discs from indicated genotypes stained with phalloidin (actin; red) and phosphorylated H2Av histone (pH2Av; green) to mark cells with DSB-mediated DNA damage. (E) Quantification of the percentage of wing pouch area positive for pH2Av signal. *p < 0.01 compared to Control, #p < 0.01 compared to shotRNAi, %p < 0.01 compared to sas-4RNAi;mad2RNAi, &p < 0.01 compared to sas-4RNAi; ANOVA with Tukey’s post-hoc test. (F) Quantification of the percentage of wing pouch area positive for cleaved caspase-3 signal. *p < 0.01 compared to Control, #p < 0.01 compared to shotRNAi; ANOVA with Tukey’s post-hoc test.
Figure 3
Figure 3
Co-knockdown of p53 and Shot leads to JNK activation and exacerbated apoptosis in Drosophila wing discs. (A) Quantification of the percentage of wing pouch area positive for cleaved caspase-3 signal. *p < 0.01 compared to Control, #p < 0.01 compared to shotRNAi; ANOVA with Tukey’s post-hoc test. (B) Quantification of the percentage of wing pouch area positive for active, phosphorylated JNK signal. *p < 0.01 compared to Control, #p < 0.01 compared to shotRNAi; ANOVA with Tukey’s post-hoc test. (C) Quantification of the percentage of wing pouch area positive for phosphorylated H2Av histone. *p < 0.01 compared to Control, #p < 0.01 compared to shotRNAi; ANOVA with Tukey’s post-hoc test.
Figure 4
Figure 4
Shot knockdown induces gadd45 and ask1 transcriptional upregulation in Drosophila wing discs. (A) Quantitative PCR targeting gadd45 using RNA extracted from wing discs of indicated genotypes was conducted and analyzed for fold change relative to Control. Plots show average from 3 independent replicates. *p < 0.05 compared to Control (see “Methods” section). (B) Quantitative PCR targeting ask1 using RNA extracted from wing discs of indicated genotypes was conducted and analyzed for fold change relative to Control. Plots show average from 3 independent replicates. *p < 0.05 compared to Control (see “Methods” section). (C) Quantification of the percentage of wing pouch area positive for 5-ethynyl-2′-deoxyuridine (EdU) to mark cell proliferation. *p < 0.01 compared to Control; ANOVA with Tukey’s post-hoc test. (D) Quantification of the percentage of wing pouch area positive for phosphohistone-H3 (PH3) to mark mitotic cells. *p < 0.01 compared to Control; ANOVA with Tukey’s post-hoc test.
Figure 5
Figure 5
GADD45 contributes to Drosophila wing disc response to Shot knockdown. (A) Quantification of the percentage of wing pouch area positive for cleaved caspase-3 signal. *p < 0.01 compared to Control, #p < 0.01 compared to shotRNAi; ANOVA with Tukey’s post-hoc test. (B) Quantification of the percentage of wing pouch area positive for active, phosphorylated JNK signal. *p < 0.01 compared to Control, #p < 0.01 compared to shotRNAi; ANOVA with Tukey’s post-hoc test. (C) Quantification of the percentage of wing pouch area positive for phosphorylated H2Av histone. *p < 0.01 compared to Control, #p < 0.01 compared to shotRNAi; ANOVA with Tukey’s post-hoc test.
Figure 6
Figure 6
GADD45 and Ask1 are required for cell cycle arrest in Drosophila S2 cells following Shot knockdown. (AC) Drosophila S2 cells stably expressing GFP:CID and mCherry: α-Tubulin were treated without (Control) or with RNAi targeting shot and gadd45. Cells were imaged from prior to nuclear envelope breakdown (NEBD) through anaphase onset. Images are representative of at least 10 cells. Timestamps are relative to NEBD. (D) Plots show timing from NEBD to anaphase onset for each recorded cell for the indicated treatment condition. Cells not progressing into anaphase after 3 h were considered to have undergone mitotic arrest (“Arrest”; indicated by percentages listed at top). *p < 0.01 compared to Control, #p < 0.01 compared to shotRNAi; ANOVA with Tukey’s post-hoc test.
Figure 7
Figure 7
Knockdown of GADD45 exacerbates chromosome segregation defects in Drosophila S2 cells with concomitant Shot knockdown. (AD) Drosophila S2 cells treated without (Control) or with RNAi targeting shot and gadd45 were paraformaldehyde fixed and stained for phosphohistone-H3 (PH3, green) and a-Tubulin (red). Yellow arrows indicate lagging or bridged chromosomes in anaphase (ana) and telophase (telo), respectively. Images are representative of at least 30 cells. (E) Graph depicts percentage of cells with normal or Bridged/Lagging chromosomes for indicated treatment conditions. *p < 0.01 compared to Control, #p < 0.01 compared to shotRNAi; Fisher’s exact test.

References

    1. Francou A, Anderson KV. The epithelial-to-mesenchymal transition in development and cancer. Annu. Rev. Cancer Biol. 2020;4:197–220. doi: 10.1146/annurev-cancerbio-030518-055425. - DOI - PMC - PubMed
    1. Ragkousi K, Gibson MC. Cell division and the maintenance of epithelial order. J. Cell Biol. 2014;207:181–188. doi: 10.1083/jcb.201408044. - DOI - PMC - PubMed
    1. Petry S. Mechanisms of mitotic spindle assembly. Annu. Rev. Biochem. 2016;85:659–683. doi: 10.1146/annurev-biochem-060815-014528. - DOI - PMC - PubMed
    1. Crasta K, et al. DNA breaks and chromosome pulverization from errors in mitosis. Nature. 2012;482:53–58. doi: 10.1038/nature10802. - DOI - PMC - PubMed
    1. Ganem NJ, Pellman D. Linking abnormal mitosis to the acquisition of DNA damage. J. Cell Biol. 2012;199:871–881. doi: 10.1083/jcb.201210040. - DOI - PMC - PubMed

Publication types

MeSH terms

Substances

LinkOut - more resources