. 2020 Nov 19;10(1):20152.
doi: 10.1038/s41598-020-76605-1.

Network-based approach highlighting interplay among anti-hypertensives: target coding-genes: diseases

Affiliations

Network-based approach highlighting interplay among anti-hypertensives: target coding-genes: diseases

Reetu Sharma. Sci Rep. .

Abstract

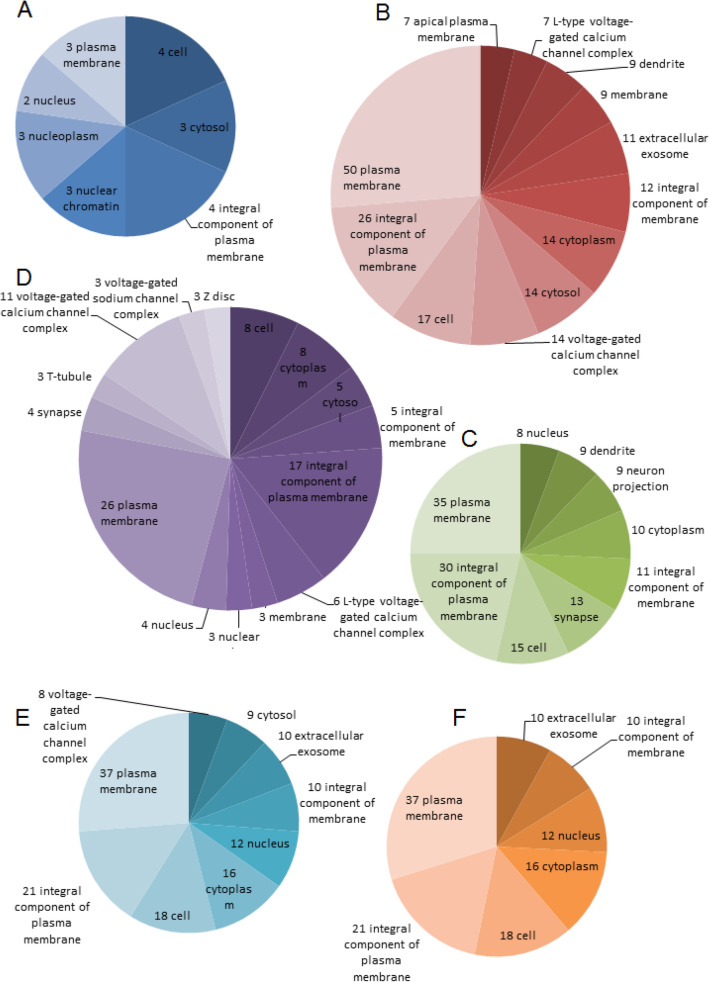
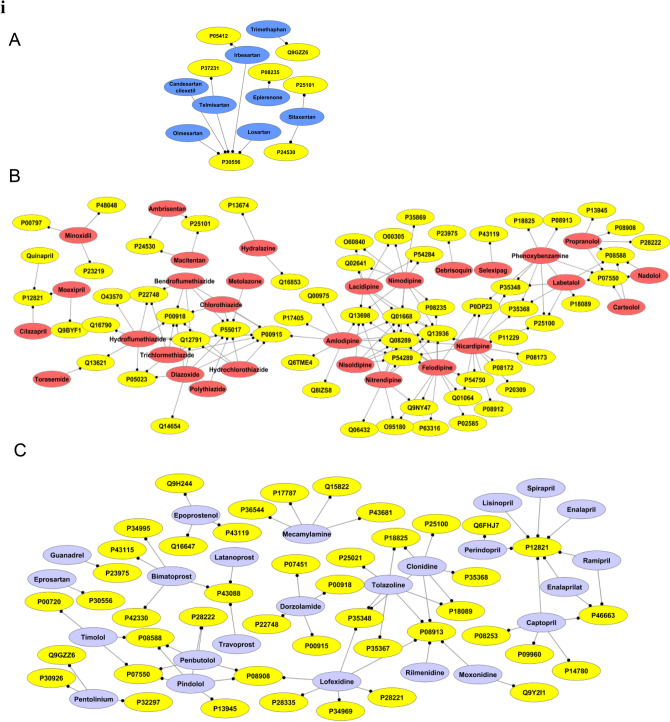
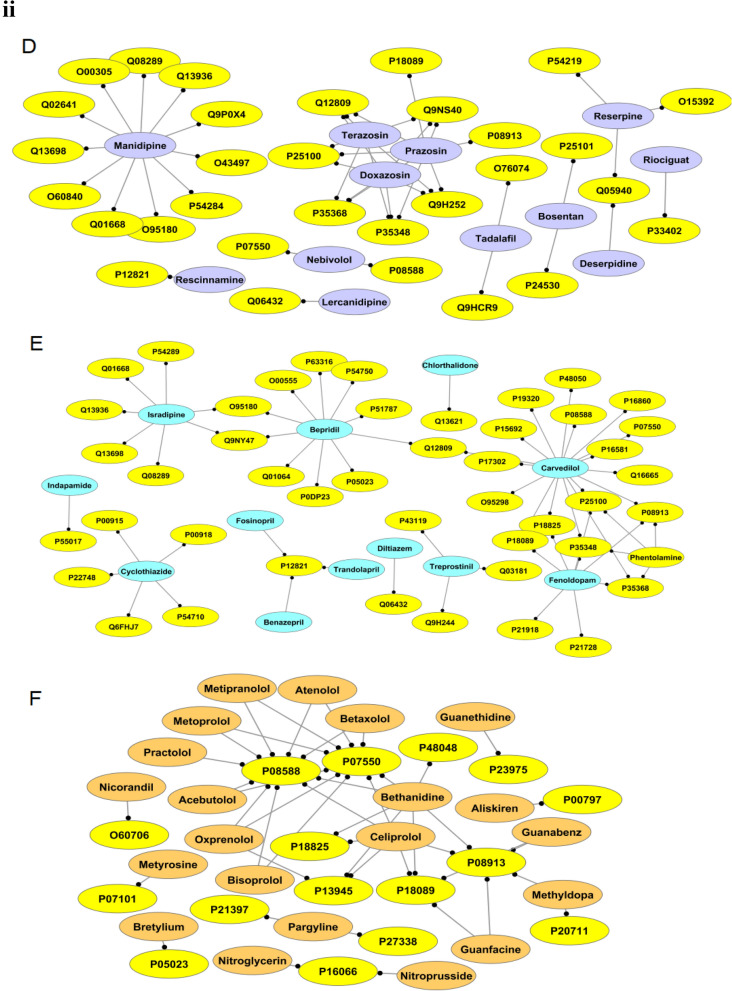
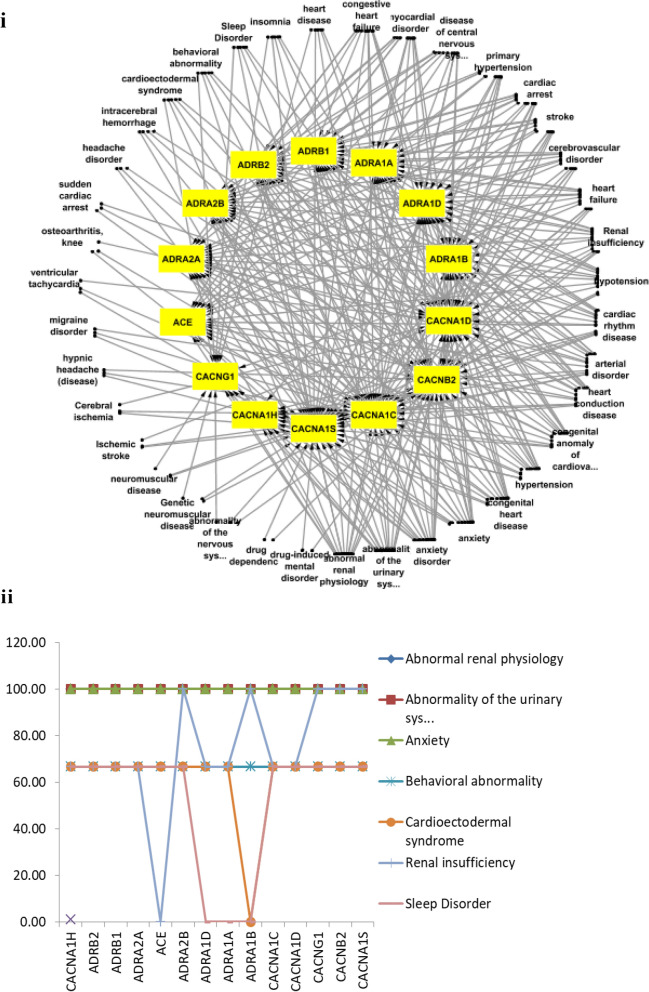
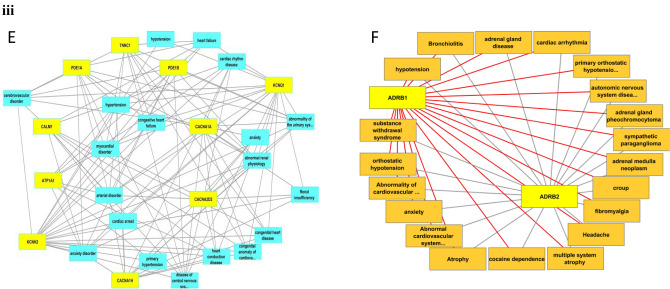
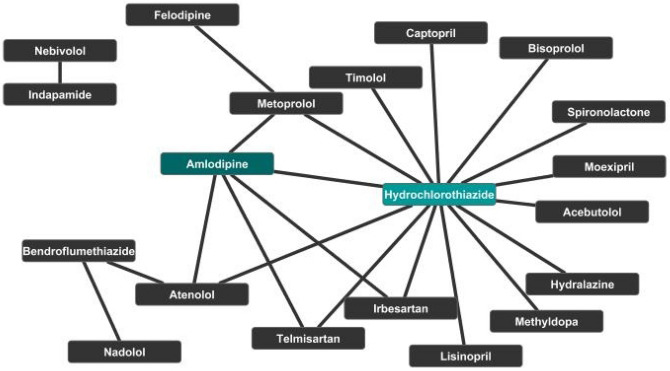
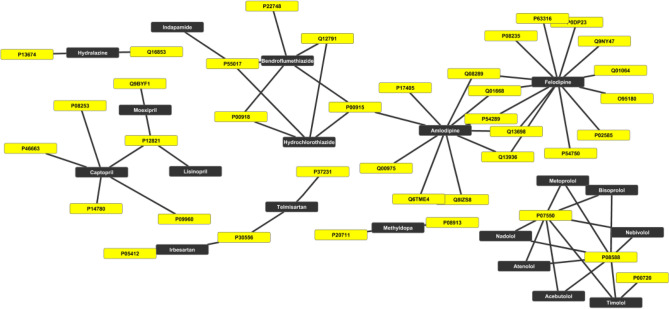
Elucidating the relation between the medicines: targets, targets: diseases and diseases: diseases are of fundamental significance as-is for societal benefit. Hypertension is one of the dangerous health conditions prevalent in society, is a risk factor for several other diseases if left untreated and anti-hypertensives (AHs) are the approved drugs to treat it. The goal of the study is to decipher the connection between hypertension with other health conditions, however, is challenging due to the large interactome. To fulfill the aim, the strategy involves prior clustering of the AHs into groups as per our previous method, followed by the analyzing functional association of the target coding-genes (tc-genes) and health conditions for each group. Following our recently published work where the AHs are clustered into six groups such that molecules having similar patterns come together, here, the distribution of molecular functions and the cellular components adopted by the tc-genes of each group are analyzed. The analyses indicate that kidney, heart, brain or lung related ailments are commonly associated with the tc-genes. The association of selective tc-genes to health conditions suggests a preference for certain health conditions despite many possibilities. Analyses of experimentally validated drug-drug combinations indicate the trend in successful AHs combinations. Clinically validated combinations bind different targets. Our study provides a promising methodology in a network-based approach that considers the influence of structural diversity of AHs to the functional perspective of tc-genes concerning the health conditions. The method could be extended to explore disease-disease relationships.


Conflict of interest statement

The author declares no competing interests.

Figures

Figure 1
Figure 1
GO: MF analyses. (A) The percentage of unique tc-genes associated with each group, (B) tc-genes1: dark blue, (C) tc-genes2: maroon, (D) tc-genes3: green, (E) tc-genes4: violet, (F) tc-genes5: light blue, and (G) tc-genes6: orange, respectively. The number of instances of each MF is written at the beginning of the MF name. The MF (y-axis) activities associated with the tc-genes (x-axis) are represented in (BG). The error associated with each column represents 5% of the total value.
Figure 2
Figure 2
GO: CC analyses. Pie charts demonstrate the distribution of the highly occupied CC associated with (A) tc-genes1: dark blue, (B) tc-genes2: maroon, (C) tc-genes3: green, (D) tc-genes4: violet, (E) tc-genes5: light blue and (F) tc-genes6: orange, respectively. The color code for each group is as for Fig. 1. The number of instances of each CC for a group is written at the beginning.
Figure 3
Figure 3
AHs: tc-genes network. (i) (AC) represents the AHs: tc-genes network in a group. The medicines as nodes of A-C are coded as (A) g1: dark blue, (B) g2: maroon and (C) g3: violet, respectively. (ii) (DF) represents the AHs: tc-genes network in a group. The medicines as nodes of D-F are coded as (D) g4: violet, (E) g5: light blue and (F) g6: orange, respectively. Yellow nodes code for the targets. The details of AHs and targets are listed in Table S2.
Figure 3
Figure 3
AHs: tc-genes network. (i) (AC) represents the AHs: tc-genes network in a group. The medicines as nodes of A-C are coded as (A) g1: dark blue, (B) g2: maroon and (C) g3: violet, respectively. (ii) (DF) represents the AHs: tc-genes network in a group. The medicines as nodes of D-F are coded as (D) g4: violet, (E) g5: light blue and (F) g6: orange, respectively. Yellow nodes code for the targets. The details of AHs and targets are listed in Table S2.
Figure 4
Figure 4
Representation of the common tc-genes. (A) Matrix depicts the percentage of common tc-genes. The open, one-fourth, half and full filled circle refer the approximate percentage of common molecules as of the row, for easy visualization, (B) Venn diagram showing common tc-genes among tc-genes2, tc-genes4 and tc-genes5.
Figure 5
Figure 5
(i) Network of the common tc-genes and diseases. The common tc-genes and health conditions are as yellow and white nodes, respectively. The full form of the health conditions is available in Table S5. (ii) Common tc-genes and health conditions. The y and x-axis represents the percentage of association with the common tc-genes. The full form of the health conditions is listed in Table S5.
Figure 6
Figure 6
The tc-genesx: disease relationship. (i) Association of selective (A) tc-genes1 (yellow): disease (dark blue) and (B) tc-genes2: disease network (maroon). The tc-genes2 associated with nicardipine and felodipine is represented as yellow and maroon, respectively. (ii) Association of selective (C) tc-genes3 (yellow): disease (green) network and (D) tc-genes4 (yellow): disease (magenta) network. The interaction between ACE and ADRA2A are represented as grey and red edge, respectively in (C). (iii) Association of selective (E) tc-genes5 (yellow): disease (light blue) network and (F) tc-genes6 (yellow): disease (orange) network. The interaction between ADRB1 and ADRB2 are represented as red and grey edges, respectively in (F). The full form of the diseases is listed in Table S5.
Figure 6
Figure 6
The tc-genesx: disease relationship. (i) Association of selective (A) tc-genes1 (yellow): disease (dark blue) and (B) tc-genes2: disease network (maroon). The tc-genes2 associated with nicardipine and felodipine is represented as yellow and maroon, respectively. (ii) Association of selective (C) tc-genes3 (yellow): disease (green) network and (D) tc-genes4 (yellow): disease (magenta) network. The interaction between ACE and ADRA2A are represented as grey and red edge, respectively in (C). (iii) Association of selective (E) tc-genes5 (yellow): disease (light blue) network and (F) tc-genes6 (yellow): disease (orange) network. The interaction between ADRB1 and ADRB2 are represented as red and grey edges, respectively in (F). The full form of the diseases is listed in Table S5.
Figure 7
Figure 7
Distribution of the tc-genes associated with the health conditions. (AF) The bar graph represents the number of tc-genes (x-axis) associated with the top 20 health conditions (y-axis). The color code of each group is the same as for Fig. 1. The full form of abbreviated health conditions is listed in the supplementary information, Table S5.
Figure 8
Figure 8
Network of selective experimentally validated drug–drug combinations for treating hypertension. The AHs are represented as black nodes except amlodipine and hydrochlorothiazide, which are in dark green background.
Figure 9
Figure 9
Network of AHs prescribed in drug–drug combinations and targets. The nodes of the targets and AHs are in the yellow and black background, respectively.

Similar articles

References

    1. Jain B, Raj U, Varadwaj PK. Drug target interplay: A network-based analysis of human diseases and the drug targets. Curr. Top Med. Chem. 2018;18(13):1053–1061. doi: 10.2174/1568026618666180719160922. - DOI - PubMed
    1. Lipinski C, Hopkins A. Navigating chemical space for biology and medicine. Nature. 2004;432(7019):855–861. doi: 10.1038/nature03193. - DOI - PubMed
    1. Casas AI, Hassan AA, Larsen SJ, Gomez-Rangel V, Elbatreek M, Kleikers PWM, Guney E, Egea J, López MG, Baumbach J, et al. From single drug targets to synergistic network pharmacology in ischemic stroke. PNAS. 2019;116(14):7129–7136. doi: 10.1073/pnas.1820799116. - DOI - PMC - PubMed
    1. Kumar A, Tiwari A, Sharma A. Changing paradigm from one target one ligand towards multi-target directed ligand design for key drug targets of alzheimer disease: An important role of in silico methods in multi-target directed ligands design. Curr. Neuropharmacol. 2018;16(6):726–739. doi: 10.2174/1570159X16666180315141643. - DOI - PMC - PubMed
    1. Cheng F, Desai RJ, Handy DE, Wang R, Schneeweiss S, Barabási A-L, Loscalzo J. Network-based approach to prediction and population-based validation of in silico drug repurposing. Nat. Commun. 2018;9(1):1–12. doi: 10.1038/s41467-017-02088-w. - DOI - PMC - PubMed

Publication types

MeSH terms