

Serum trace metal association with response to erythropoiesis stimulating agents in incident and prevalent hemodialysis patients
- PMID: 33214633
- PMCID: PMC7677396
- DOI: 10.1038/s41598-020-77311-8
Serum trace metal association with response to erythropoiesis stimulating agents in incident and prevalent hemodialysis patients
Abstract
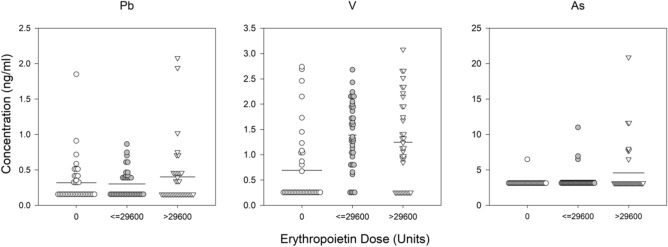
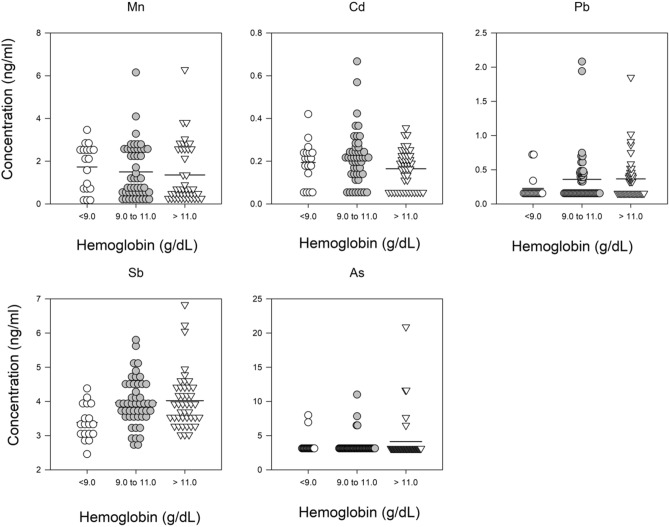
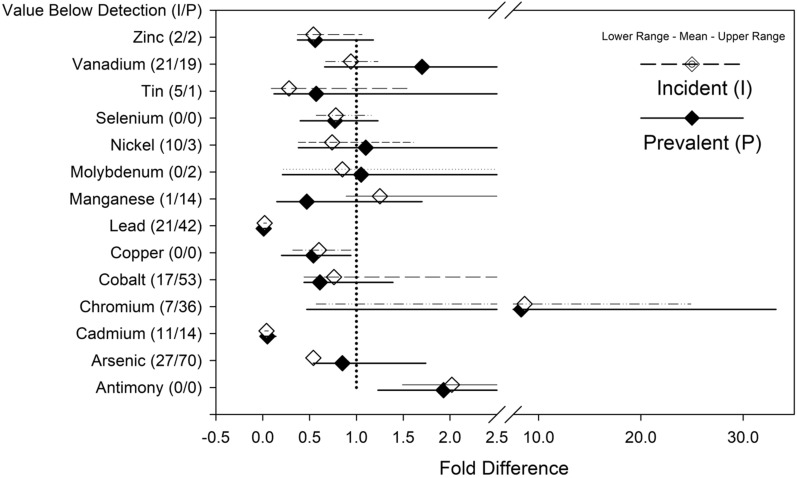
Alterations in hemodialysis patients' serum trace metals have been documented. Early studies addressing associations levels of serum trace metals with erythropoietic responses and/or hematocrit generated mixed results. These studies were conducted prior to current approaches for erythropoiesis stimulating agent (ESA) drug dosing guidelines or without consideration of inflammation markers (e.g. hepcidin) important for regulation of iron availability. This study sought to determine if the serum trace metal concentrations of incident or chronic hemodialysis patients associated with the observed ESA response variability and with consideration to ESA dose response, hepcidin, and high sensitivity C-reactive protein levels. Inductively-coupled plasma-mass spectrometry was used to measure 14 serum trace metals in 29 incident and 79 prevalent dialysis patients recruited prospectively. We compared these data to three measures of ESA dose response, sex, and dialysis incidence versus dialysis prevalence. Hemoglobin was negatively associated with ESA dose and cadmium while positively associated with antimony, arsenic and lead. ESA dose was negatively associated with achieved hemoglobin and vanadium while positively associated with arsenic. ESA response was positively associated with arsenic. Vanadium, nickel, cadmium, and tin were increased in prevalent patients. Manganese was increased in incident patients. Vanadium, nickel, and arsenic increased with time on dialysis while manganese decreased. Changes in vanadium and manganese were largest and appeared to have some effect on anemia. Incident and prevalent patients' chromium and antimony levels exceeded established accepted upper limits of normal.
Conflict of interest statement
The authors declare no competing interests.
Figures


Similar articles
-
Predictors of hyporesponsiveness to erythropoiesis-stimulating agents in hemodialysis patients.Am J Kidney Dis. 2009 May;53(5):823-34. doi: 10.1053/j.ajkd.2008.12.040. Epub 2009 Apr 1. Am J Kidney Dis. 2009. PMID: 19339087 Free PMC article.
-
2008 Japanese Society for Dialysis Therapy: guidelines for renal anemia in chronic kidney disease.Ther Apher Dial. 2010 Jun;14(3):240-75. doi: 10.1111/j.1744-9987.2010.00836.x. Ther Apher Dial. 2010. PMID: 20609178
-
Characterization of chronic and acute ESA hyporesponse: a retrospective cohort study of hemodialysis patients.BMC Nephrol. 2015 Aug 18;16:144. doi: 10.1186/s12882-015-0138-x. BMC Nephrol. 2015. PMID: 26283069 Free PMC article.
-
Personalized Anemia Management and Precision Medicine in ESA and Iron Pharmacology in End-Stage Kidney Disease.Semin Nephrol. 2018 Jul;38(4):410-417. doi: 10.1016/j.semnephrol.2018.05.010. Semin Nephrol. 2018. PMID: 30082060 Review.
-
Managing Anemia across the Stages of Kidney Disease in Those Hyporesponsive to Erythropoiesis-Stimulating Agents.Am J Nephrol. 2021;52(6):450-466. doi: 10.1159/000516901. Epub 2021 Jul 19. Am J Nephrol. 2021. PMID: 34280923 Review.
Cited by
-
Serum metabolomics of end-stage renal disease patients with depression: potential biomarkers for diagnosis.Ren Fail. 2021 Dec;43(1):1479-1491. doi: 10.1080/0886022X.2021.1994995. Ren Fail. 2021. PMID: 34723750 Free PMC article.
References
Publication types
MeSH terms
Substances
Grants and funding
- P30 ES030283/ES/NIEHS NIH HHS/United States
- R01 DK091584/DK/NIDDK NIH HHS/United States
- R01DK091584/U.S. Department of Health & Human Services | NIH | National Institute of Diabetes and Digestive and Kidney Diseases (National Institute of Diabetes & Digestive & Kidney Diseases)/International
- K01GM109320/U.S. Department of Health & Human Services | NIH | National Institute of Diabetes and Digestive and Kidney Diseases (National Institute of Diabetes & Digestive & Kidney Diseases)/International
- U24DK097193/U.S. Department of Health & Human Services | NIH | National Institute of Diabetes and Digestive and Kidney Diseases (National Institute of Diabetes & Digestive & Kidney Diseases)/International
LinkOut - more resources
Full Text Sources
Medical
Research Materials
