An alternative miRISC targets a cancer-associated coding sequence mutation in FOXL2
- PMID: 33215742
- PMCID: PMC7737606
- DOI: 10.15252/embj.2020104719
An alternative miRISC targets a cancer-associated coding sequence mutation in FOXL2
Erratum in
-
An alternative miRISC targets a cancer-associated coding sequence mutation in FOXL2.EMBO J. 2021 Aug 16;40(16):e108163. doi: 10.15252/embj.2021108163. EMBO J. 2021. PMID: 34396574 Free PMC article.
Abstract
Recent evidence suggests that animal microRNAs (miRNAs) can target coding sequences (CDSs); however, the pathophysiological importance of such targeting remains unknown. Here, we show that a somatic heterozygous missense mutation (c.402C>G; p.C134W) in FOXL2, a feature shared by virtually all adult-type granulosa cell tumors (AGCTs), introduces a target site for miR-1236, which causes haploinsufficiency of the tumor-suppressor FOXL2. This miR-1236-mediated selective degradation of the variant FOXL2 mRNA is preferentially conducted by a distinct miRNA-loaded RNA-induced silencing complex (miRISC) directed by the Argonaute3 (AGO3) and DHX9 proteins. In both patients and a mouse model of AGCT, abundance of the inversely regulated variant FOXL2 with miR-1236 levels is highly correlated with malignant features of AGCT. Our study provides a molecular basis for understanding the conserved FOXL2 CDS mutation-mediated etiology of AGCT, revealing the existence of a previously unidentified mechanism of miRNA-targeting disease-associated mutations in the CDS by forming a non-canonical miRISC.
Keywords: Argonaute3; DHX9; allelic imbalance; metastasis; miR-1236.
© 2020 The Authors. Published under the terms of the CC BY NC ND 4.0 license.
Conflict of interest statement
The authors declare that they have no conflict of interest.
Figures

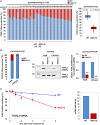
Bar graph and box‐and‐whisker plots are presented, which show the allelic proportions of WT FOXL2 mRNA and 402C> G FOXL2 mRNA in AGCT tissues from 46 patients analyzed by pyrosequencing. The box plot represents the minimum value, first quartile, median, third quartile, and maximum value of a data set. X‐axis indicates mRNAs of WT FOXL2 and 402C>G FOXL2. The whiskers extend to the most extreme data points not considered outliers, and the outliers are represented as dots. Comparisons between groups were performed using Student’s t‐test, and P values are presented.
The relative abundances of WT and variant FOXL2 mRNA were analyzed in KGN and COV434 cells by pyrosequencing (left graph), allele‐specific RT–PCR (middle graph), and real‐time RT–PCR (right graph). gDNA was detected as a positive control. The relative abundances of the variant FOXL2 mRNA were normalized to that of WT mRNA (set to 1). FOXL2 mRNA levels detected by real‐time RT–PCR were normalized to matching gDNA levels. The pyrosequencing data are presented from two independent experiments. The allele‐specific semi‐quantitative and real‐time RT–PCR data are presented as the mean ± SEM from three independent experiments. The P values were analyzed by unpaired, two‐tailed Student’s t‐test (***P < 0.001). n.d. not detected.
RNA‐decay rates of WT and 402C>G FOXL2 mRNAs in KGN cells were determined after treatment with 5 µg/ml ActD for the indicated times. The estimated half‐lives of each transcript are presented. The data are presented as the mean ± SEM from three independent experiments.

- A, B
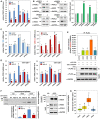
Changes in WT and variant FOXL2 mRNA expression were assessed by RT–PCR (top) and real‐time RT–PCR (bottom) (A) or by Western blot analysis (B) after transfecting KGN cells with anti‐miRNAs for 48 h.
- C
FOXL2 protein levels after transfection of control or miR‐1236 were assessed in KGN and COV434 cells.
- D
The mRNA levels of WT and variant FOXL2 in control, miR‐1236−/+, and miR‐1236−/− KGN cells, with or without miR‐1236 transfection, were determined by RT–PCR (top) or real‐time RT–PCR (bottom).
- E
FOXL2 protein expression in control, miR‐1236−/+, and miR‐1236−/− KGN cells and two independent miR‐1236−/− (#1 and #2) COV434 cell lines were determined by Western blotting.

- A
Schematic representation of the luciferase reporter constructs used to assay miR‐1236 activity against a CDS target site in FOXL2 mRNA. The 231‐bp human FOXL2 segments harboring either the C402 (WT) or the G402 (mutant) nucleotide were inserted in‐frame into the CDS of the luciferase gene in the pGL3 control vector.
- B
Luciferase activity of the reporter constructs shown in (A) was measured in KGN cells after transfection with an miR‐1236 mimic for 48 h. The black arrow indicates the position of 402C>G mutation site.
- C
A schematic diagram of the luciferase reporter constructs generated by inserting the predicted miR‐1236‐target sequences of WT and 402C>G FOXL2 mRNAs in the 3′‐UTR of luciferase.
- D
Luciferase activities were measured in KGN cells, using the reporter constructs shown in (C), after transfection with a control miRNA or an miR‐1236 mimic for 48 h.
- E, F
miR‐1236 mutants, in which the C that pairs with G402 of the FOXL2 mutant was substituted with either G (miR‐1236‐G) (E) or U (miR‐1236‐U) (F), were cotransfected into KGN cells with one of the reporter constructs described above. Luciferase activities were subsequently determined. Arrows indicate the mismatched sites.
- G
In vitro annealing kinetics of miR‐1236 with 230 nt‐long transcripts of WT or variant FOXL2. 32P‐labeled miR‐1236 (0.5 nM) was incubated with increasing concentrations of synthetic FOXL2 transcripts (0, 2.5, 12.5, 25, or 50 nM). FOXL2 mRNA–miR‐1236 complexes were resolved on a 6% native gel and detected by autoradiography (left). The predicted Kds for the WT and 402C>G FOXL2 transcripts are presented in the right graph.

- A, B
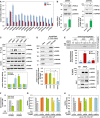
Changes in WT and variant FOXL2 mRNA‐expression levels were assessed by real‐time RT–PCR (A) or Western blot analysis (B) after transfecting KGN cells with siRNAs against AGO mRNAs for 48 h. The data (mean ± SEM) are from three independent experiments, performed in triplicate.
- C
The mRNA levels of WT (left) and variant FOXL2 (right) were determined in KGN cells by real‐time RT–PCR, after transfecting a control miRNA or miR‐1236. The data (mean ± SEM) are from three independent experiments, performed in triplicate.
- D
The mRNA levels of WT and the variant FOXL2 in control (left) and miR‐1236−/− KGN cells (right) after transfecting siRNAs against AGO mRNAs were determined by allele‐specific real‐time RT–PCR. The data (mean ± SEM) are from three independent experiments, performed in triplicate.
- E
293T cells were transfected with an miR‐1236 mimic (50 nM) for 24 h, followed by cotransfection with expression vectors encoding FLAG/HA‐tagged variants of the indicated human AGOs and pGL3c‐CDS‐MT for 24 h. The empty p3XFLAG‐CMV‐10 vector was used as control. Co‐immunoprecipitated mRNAs were reverse transcribed, and the cDNA products were used for allele‐specific real‐time PCR analysis of the FOXL2 variant and GAPDH mRNAs (top). The level of variant FOXL2 mRNA immunoprecipitated using FLAG‐tagged AGO proteins was normalized using the level of GAPDH mRNA from the same lysates. The immunoprecipitated‐AGO proteins were detected by Western blotting (bottom). The data (mean ± SEM) are from three independent experiments.
- F
In vivo association of AGO3‐mediated miRISC formation with FOXL2 mRNAs is shown. Following transfection of a control miRNA or the miR‐1236‐G mutant into KGN cells, AGO3‐mediated RISC‐associated RNAs were isolated by immunoprecipitation with an anti‐AGO3 antibody. IgG was used as a control. The co‐immunoprecipitated mRNAs were reverse transcribed using a FOXL2‐430‐R primer binding downstream of the 402C>G site. The cDNA products were used for FOXL2 allele‐specific PCR analysis with the FOXL2‐279F primer (Appendix Fig S1), and a representative result (top left) is shown. Quantitative real‐time RT–PCR results that examined FOXL2 mRNAs, normalized using the level of GAPDH mRNA (bottom left), are also presented. Western blot analysis of immunoprecipitated AGO3 and inputs are shown in the right panel. The data are presented as the mean ± SEM of two independent experiments.
- G
RNA‐seq analysis was performed to determine AGO‐expression levels (transcripts per million) from the individual tissues from 20 independent AGCT patients. X‐axis represents mRNAs of AGO1 to 4. The box plot represents the minimum value, first quartile, median, third quartile, and maximum value of a data set. The whiskers extend to the most extreme data points not considered outliers, and the outliers are represented as dots.

- A
Changes in WT and variant FOXL2 mRNA levels in KGN cells were assessed by real‐time RT–PCR after transfecting siRNAs against the indicated factors for 48 h. The data are presented as the mean ± SEM from three independent experiments, performed in triplicate.
- B
FOXL2 protein‐expression levels were determined by Western blotting after transfecting KGN cells with control, DHX9, or GW182 siRNAs for 48 h. Quantification of FOXL2 protein expression is presented in the bottom panel. The data are presented as the mean ± SEM from three independent experiments. The P values were analyzed by unpaired, two‐tailed Student’s t‐test (**P < 0.01, ***P < 0.001).
- C
Relative binding affinities of DHX9 and GW182 to AGOs. 293T cells were transfected with expression vectors encoding the indicated FLAG/HA‐tagged AGOs, and cell extracts were prepared and immunoprecipitated with an anti‐FLAG antibody, followed by immunoblot analyses (top). The empty p3XFLAG‐CMV‐10 vector was used as a control. The band intensities of immunoprecipitated DHX9 and GW182 were quantified and normalized following pulldown with the indicated AGOs (bottom). The data are presented as the mean ± SEM from three independent experiments. * and # indicate statistically significant differences in the respective amounts of DHX9 or GW182 bound to AGO1. The P values were analyzed by unpaired, two‐tailed Student’s t‐test (P < 0.05).
- D
Association of endogenous miR‐1236 with RISC components in KGN cells was determined via pulldown assays using immobilized 2′‐O‐methylated oligonucleotides (2′‐O‐Me oligos) complementary to miR‐1236 followed with a pulldown using streptavidin‐coupled Dynabeads and Western blot analyses (top). Relative quantification of bound proteins compared with proteins from the input is presented as fold enrichment (bottom). Efficient pulldown of endogenous miR‐1236 using the 2′‐O‐Me oligos was confirmed with depleted miR‐1236 in the discarded supernatant following the pulldown (Appendix Fig S8). As a control, 2′‐O‐Me oligos not complementary to miR‐1236 were used. The data are the means ± SEM from three independent experiments. The P values were analyzed by unpaired, two‐tailed Student’s t‐test (*P < 0.05, **P < 0.01).
- E
Following transfection of control siRNA or siDHX9 into KGN cells, AGO3‐mediated RISC‐associated RNAs were immunoprecipitated using an anti‐AGO3 antibody. IgG was used as a control. Co‐immunoprecipitated mRNAs were reverse transcribed using a FOXL2‐430‐R primer binding downstream of the 402C>G site. The cDNA products were used for FOXL2 allele‐specific PCR analysis with a FOXL2‐279F primer (Appendix Fig S1A), and a representative result obtained by RT–PCR (top) is shown. Quantitative real‐time RT–PCR results (middle) are also presented as fold enrichment of FOXL2 mRNAs normalized using the level of GAPDH mRNA. Western blots of immunoprecipitated AGO3 and the inputs are shown in the bottom panel. The data are presented as the mean ± SEM from three independent experiments. Different letters denote statistically significant differences (P < 0.05; Student–Newman–Keuls test).
- F
We examined whether DHX9 affected the association between miR‐1236 and AGOs. After transfecting KGN cells with control siRNA or siDHX9, the total RNA and AGOs‐mediated RISC‐associated RNAs were isolated following immunoprecipitations using anti‐AGO3 or anti‐AGO2 antibodies. The AGOs‐immunoprecipitated RNAs were extracted using an acidic phenol:chloroform mixture (5:1, pH 4.3) and precipitated with isopropanol using 10% of 3 M NaOAc (pH 5.2). The enrichment of miR‐1236 within miRISCs was detected using the TaqMan® microRNA assay in the immunoprecipitated RNAs and normalized using the level of total miR‐1236. The data (means ± SEM) are presented as the fold enrichment calculated from three independent experiments. Different letters denote statistically significant differences (P < 0.05; Student–Newman–Keuls test).
- G, H
Luciferase activities of the reporter constructs presented in Fig 3A and C were measured in KGN cells after transfecting the miR‐1236 mimic, indicated siRNAs, and either pGL3c‐CDS‐FOXL2 MT or pGL3c‐UTR‐FOXL2 MT for 48 h. The data are expressed as the means ± SEM from three independent experiments and were performed in triplicate. The P values were analyzed by unpaired, two‐tailed Student’s t‐test (***P < 0.001).

- A–D
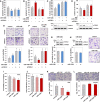
KGN cells were transfected with 200 nM of scrambled control or FOXL2‐specific siRNAs for 24 h. Then, KGN cells were further transfected with 20 nM of control miRNA, miR‐1236, control anti‐miRNA, or anti‐miR‐1236. The proportion of annexin V‐positive apoptotic cells (A and B) and the population at S phase (C and D) were analyzed by flow cytometry. The data are presented as the mean ± SEM of three independent experiments. Different letters denote statistically significant differences (P < 0.0001; Student–Newman–Keuls test). Efficient silencing of FOXL2 using specific siRNAs was confirmed by Western blotting.
- E, F
KGN cells were transfected with control siRNA or siFOXL2 for 24 h. Then, KGN cells were further transfected with control miRNA or miR‐1236 (E) or with control anti‐miRNA or anti‐miR‐1236 (F) for 48 h, and Transwell‐migration assays were performed. The migrated cells were imaged under a bright‐field microscope (100 × magnification, scale bar = 100 µm). The results are from three independent experiments and represent fold changes in the average number of cells/field (mean ± SEM). Different letters denote statistically significant differences (P < 0.01; Student–Newman–Keuls test).
- G, H
COV434 cells were transfected with miR‐control or miR‐1236 for 48 h, after which cell viabilities (G) and migration abilities (H) were measured. The data are presented as the mean ± SEM of three independent experiments. Immunoblots showing no change in FOXL2 protein are presented in the top panel, and images of migrated cells are presented in the right panel. The migrated cells were imaged under a bright‐field microscope (100 × magnification, scale bar = 100 µm).
- I–K
The properties of miR‐1236−/+ and miR‐1236−/− KGN cells versus control KGN cells were assessed by measuring cell viability (I), cell proliferation (J), and cell migration (K). The data are presented as the mean ± SEM of three independent experiments. The migrated cells were imaged under a bright‐field microscope (100 × magnification; top of Figure 6K). Scale bar = 100 µm.
- L
No difference in the cell‐migration activities of control and two independent miR‐1236−/− (#1 and #2) COV434 cell lines. The migrated cells were imaged under a bright‐field microscope (100 × magnification, scale bar = 100 µm; top), and the results (bottom) represent fold changes in the average number of cells/field. The data are presented as the mean ± SEM of three independent experiments.

- A–C
The effect of miR‐1236 KO on AGCT metastasis was assessed, using an in vivo xenograft mice model. (A) Representative images of tumor nodules (white arrows) formed in the intestines of nude mice xenografted with control or miR‐1236−/− KGN cells are shown (left and right; scale bar = 5 mm). Hematoxylin and eosin staining confirmed the pathological characteristics of the metastasized GCT nodules (middle, black arrows; scale bar = 50 µm). The black dashed circles are metastasized nodules of xenografted KGN cells found in mouse intestines. (B) The number of tumor nodules formed in the intestines was counted in control (n = 8) and miR‐1236−/− (n = 8) mice. (C) Allele‐specific real‐time RT–PCR analysis of the WT and 402C> G variant FOXL2 mRNAs was performed using RNA extracted from tumor nodules from control or miR‐1236−/− mice. The P values were analyzed by unpaired, two‐tailed Student’s t‐test (**P < 0.01, ***P < 0.001).
- D–F
Box‐and‐whisker plots showing the relative expression of miR‐1236 (D), variant FOXL2 mRNA (E), and WT FOXL2 mRNA (F), respectively, in 32 patients with non‐metastasized AGCTs and 14 patients with metastasized AGCTs. X‐ axis indicates patient subgroups depending on whether they exhibit metastasized AGCTs (meta) or not (non‐meta). The relative miR‐1236 levels were measured using a TaqMan® microRNA RT–qPCR assay, with expression normalized to RNU6B. The levels of 402C > G or WT FOXL2 mRNA were determined by real‐time RT–PCR, and the data were normalized to paired‐gDNA levels. The relative levels of miR‐1236 and FOXL2 mRNAs were quantified by setting the levels of AGCT #1 to 1. Real‐time RT–PCR was performed in triplicate for each specimen. The box plot represents the minimum value, first quartile, median, third quartile, and maximum value of a data set. The whiskers extend to the most extreme data points not considered outliers, and the outliers are represented as dots. Comparisons between groups were performed using Student’s t‐test, and P values are presented.
- G, H
The estimated regression line superimposed on the scatter plot of miR‐1236 levels with 402C> G FOXL2 mRNA (G) or WT FOXL2 mRNA (H) in AGCT samples (n = 46) is shown, along with correlation coefficient (r) and P values.
- I
The proposed model for FOXL2 haploinsufficiency induced by the 402C>G mutation during AGCT development.
Comment in
-
Response to Veitia et al.EMBO J. 2021 Aug 16;40(16):e108671. doi: 10.15252/embj.2021108671. EMBO J. 2021. PMID: 34396572 Free PMC article.
-
Reply to "An alternative miRISC targets a cancer-associated coding sequence mutation in FOXL2".EMBO J. 2021 Aug 16;40(16):e107517. doi: 10.15252/embj.2020107517. EMBO J. 2021. PMID: 34396573 Free PMC article.
References
-
- Chen SY, Teng SC, Cheng TH, Wu KJ (2016) miR‐1236 regulates hypoxia‐induced epithelial‐mesenchymal transition and cell migration/invasion through repressing SENP1 and HDAC3. Cancer Lett 378: 59–67 - PubMed
Publication types
MeSH terms
Substances
Grants and funding
- 2019R1A2C2084563/National Research Foundation of Korea (NRF)
- 2019R1H1A2080015/National Research Foundation of Korea (NRF)
- NRF-2017R1A2B2011248/National Research Foundation of Korea (NRF)
- NRF-2015R1A5A1008958/National Research Foundation of Korea (NRF)
- NRF-2018R1A5A1025077/National Research Foundation of Korea (NRF)
LinkOut - more resources
Full Text Sources
Research Materials
Miscellaneous

