

Dynamic Public Health Surveillance to Track and Mitigate the US COVID-19 Epidemic: Longitudinal Trend Analysis Study
- PMID: 33216726
- PMCID: PMC7717896
- DOI: 10.2196/24286
Dynamic Public Health Surveillance to Track and Mitigate the US COVID-19 Epidemic: Longitudinal Trend Analysis Study
Abstract
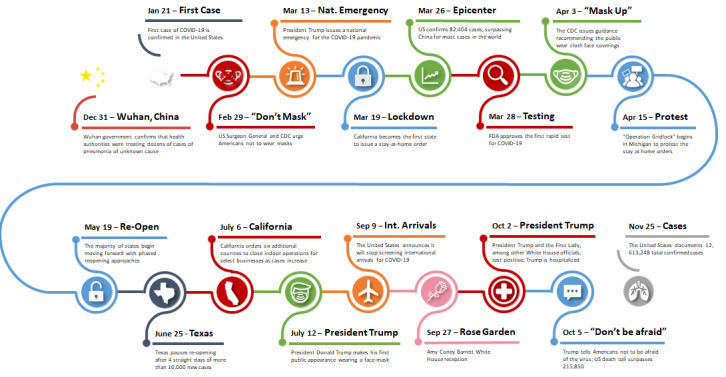
Background: The emergence of SARS-CoV-2, the virus that causes COVID-19, has led to a global pandemic. The United States has been severely affected, accounting for the most COVID-19 cases and deaths worldwide. Without a coordinated national public health plan informed by surveillance with actionable metrics, the United States has been ineffective at preventing and mitigating the escalating COVID-19 pandemic. Existing surveillance has incomplete ascertainment and is limited by the use of standard surveillance metrics. Although many COVID-19 data sources track infection rates, informing prevention requires capturing the relevant dynamics of the pandemic.
Objective: The aim of this study is to develop dynamic metrics for public health surveillance that can inform worldwide COVID-19 prevention efforts. Advanced surveillance techniques are essential to inform public health decision making and to identify where and when corrective action is required to prevent outbreaks.
Methods: Using a longitudinal trend analysis study design, we extracted COVID-19 data from global public health registries. We used an empirical difference equation to measure daily case numbers for our use case in 50 US states and the District of Colombia as a function of the prior number of cases, the level of testing, and weekly shift variables based on a dynamic panel model that was estimated using the generalized method of moments approach by implementing the Arellano-Bond estimator in R.
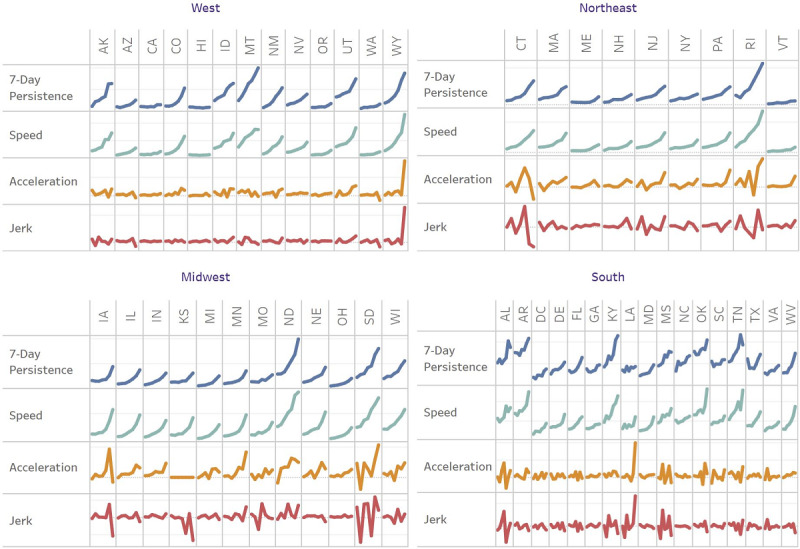
Results: Examination of the United States and state data demonstrated that most US states are experiencing outbreaks as measured by these new metrics of speed, acceleration, jerk, and persistence. Larger US states have high COVID-19 caseloads as a function of population size, density, and deficits in adherence to public health guidelines early in the epidemic, and other states have alarming rates of speed, acceleration, jerk, and 7-day persistence in novel infections. North and South Dakota have had the highest rates of COVID-19 transmission combined with positive acceleration, jerk, and 7-day persistence. Wisconsin and Illinois also have alarming indicators and already lead the nation in daily new COVID-19 infections. As the United States enters its third wave of COVID-19, all 50 states and the District of Colombia have positive rates of speed between 7.58 (Hawaii) and 175.01 (North Dakota), and persistence, ranging from 4.44 (Vermont) to 195.35 (North Dakota) new infections per 100,000 people.
Conclusions: Standard surveillance techniques such as daily and cumulative infections and deaths are helpful but only provide a static view of what has already occurred in the pandemic and are less helpful in prevention. Public health policy that is informed by dynamic surveillance can shift the country from reacting to COVID-19 transmissions to being proactive and taking corrective action when indicators of speed, acceleration, jerk, and persistence remain positive week over week. Implicit within our dynamic surveillance is an early warning system that indicates when there is problematic growth in COVID-19 transmissions as well as signals when growth will become explosive without action. A public health approach that focuses on prevention can prevent major outbreaks in addition to endorsing effective public health policies. Moreover, subnational analyses on the dynamics of the pandemic allow us to zero in on where transmissions are increasing, meaning corrective action can be applied with precision in problematic areas. Dynamic public health surveillance can inform specific geographies where quarantines are necessary while preserving the economy in other US areas.
Keywords: Arellano-Bond estimator; COVID-19; COVID-19 acceleration; COVID-19 jerk; COVID-19 persistence; COVID-19 speed; COVID-19 transmission acceleration; US COVID-19; US COVID-19 surveillance system; US COVID-19 transmission speed; US SARS-CoV-2; United States econometrics; United States public health surveillance; dynamic panel data; generalized method of the moments; global COVID-19 surveillance; surveillance metrics.
©Lori Ann Post, Tariq Ziad Issa, Michael J Boctor, Charles B Moss, Robert L Murphy, Michael G Ison, Chad J Achenbach, Danielle Resnick, Lauren Nadya Singh, Janine White, Joshua Marco Mitchell Faber, Kasen Culler, Cynthia A Brandt, James Francis Oehmke. Originally published in the Journal of Medical Internet Research (http://www.jmir.org), 03.12.2020.
Conflict of interest statement
Conflicts of Interest: None declared.
Figures
References
-
- Lin Y, Liu C, Chiu Y. Google searches for the keywords of "wash hands" predict the speed of national spread of COVID-19 outbreak among 21 countries. Brain Behav Immun. 2020 Jul;87:30–32. doi: 10.1016/j.bbi.2020.04.020. http://europepmc.org/abstract/MED/32283286 - DOI - PMC - PubMed
-
- Holshue ML, DeBolt C, Lindquist S, Lofy KH, Wiesman J, Bruce H, Spitters C, Ericson K, Wilkerson S, Tural A, Diaz G, Cohn A, Fox L, Patel A, Gerber SI, Kim L, Tong S, Lu X, Lindstrom S, Pallansch MA, Weldon WC, Biggs HM, Uyeki TM, Pillai SK, Washington State 2019-nCoV Case Investigation Team First case of 2019 novel coronavirus in the United States. N Engl J Med. 2020 Mar 05;382(10):929–936. doi: 10.1056/NEJMoa2001191. http://europepmc.org/abstract/MED/32004427 - DOI - PMC - PubMed
-
- Chin T, Kahn R, Li R, Chen JT, Krieger N, Buckee CO, Balsari S, Kiang MV. US-county level variation in intersecting individual, household and community characteristics relevant to COVID-19 and planning an equitable response: a cross-sectional analysis. BMJ Open. 2020 Sep 01;10(9):e039886. doi: 10.1136/bmjopen-2020-039886. https://bmjopen.bmj.com/lookup/pmidlookup?view=long&pmid=32873684 - DOI - PMC - PubMed
-
- COVID-19 dashboard by the Center for Systems Science and Engineering (CSSE) at Johns Hopkins University (JHU) Johns Hopkins University. 2020. [2020-11-25]. https://coronavirus.jhu.edu/map.html.
MeSH terms
Grants and funding
LinkOut - more resources
Full Text Sources
Medical
Research Materials
Miscellaneous
