. 2020 Nov 20;16(11):e1009110.
doi: 10.1371/journal.pgen.1009110. eCollection 2020 Nov.

Unique genetic signatures of local adaptation over space and time for diapause, an ecologically relevant complex trait, in Drosophila melanogaster

Affiliations

Unique genetic signatures of local adaptation over space and time for diapause, an ecologically relevant complex trait, in Drosophila melanogaster

Priscilla A Erickson et al. PLoS Genet. .

Abstract

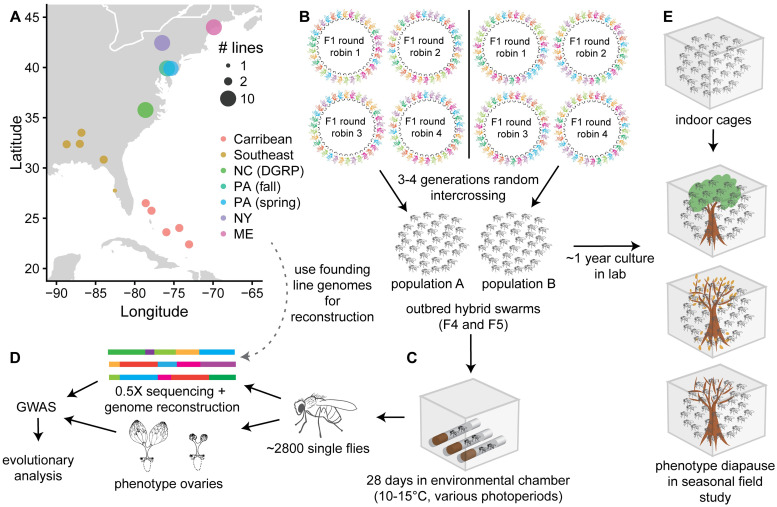
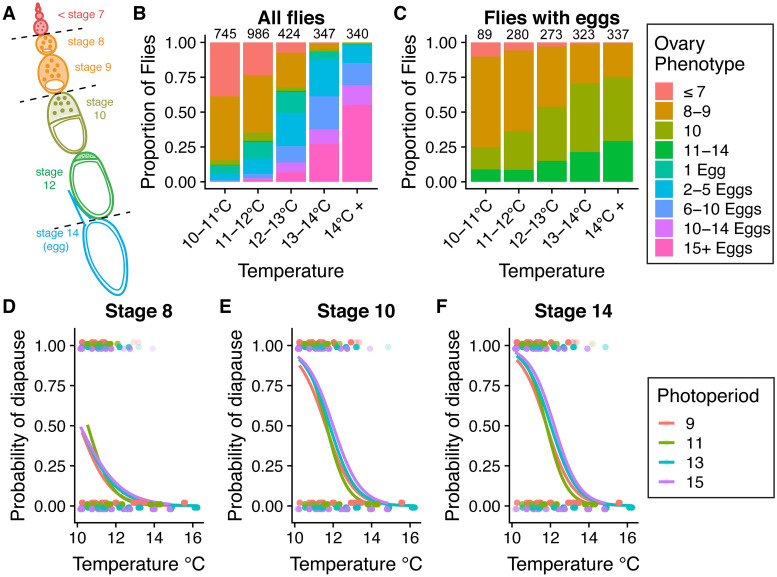
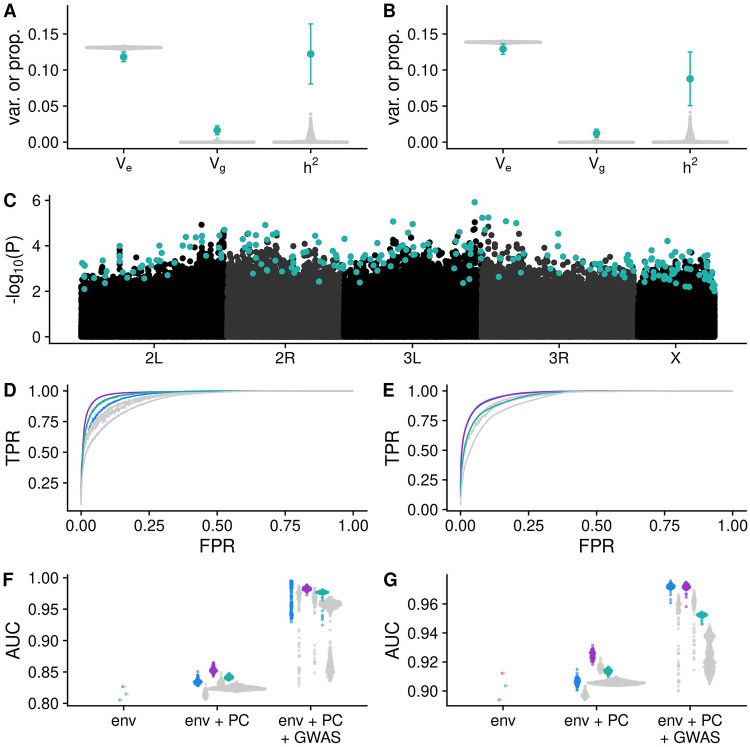
Organisms living in seasonally variable environments utilize cues such as light and temperature to induce plastic responses, enabling them to exploit favorable seasons and avoid unfavorable ones. Local adapation can result in variation in seasonal responses, but the genetic basis and evolutionary history of this variation remains elusive. Many insects, including Drosophila melanogaster, are able to undergo an arrest of reproductive development (diapause) in response to unfavorable conditions. In D. melanogaster, the ability to diapause is more common in high latitude populations, where flies endure harsher winters, and in the spring, reflecting differential survivorship of overwintering populations. Using a novel hybrid swarm-based genome wide association study, we examined the genetic basis and evolutionary history of ovarian diapause. We exposed outbred females to different temperatures and day lengths, characterized ovarian development for over 2800 flies, and reconstructed their complete, phased genomes. We found that diapause, scored at two different developmental cutoffs, has modest heritability, and we identified hundreds of SNPs associated with each of the two phenotypes. Alleles associated with one of the diapause phenotypes tend to be more common at higher latitudes, but these alleles do not show predictable seasonal variation. The collective signal of many small-effect, clinally varying SNPs can plausibly explain latitudinal variation in diapause seen in North America. Alleles associated with diapause are segregating in Zambia, suggesting that variation in diapause relies on ancestral polymorphisms, and both pro- and anti-diapause alleles have experienced selection in North America. Finally, we utilized outdoor mesocosms to track diapause under natural conditions. We found that hybrid swarms reared outdoors evolved increased propensity for diapause in late fall, whereas indoor control populations experienced no such change. Our results indicate that diapause is a complex, quantitative trait with different evolutionary patterns across time and space.


Conflict of interest statement

The authors have declared that no competing interests exist.

Figures

Fig 1
Fig 1. Experimental design for hybrid-swarm based association mapping of diapause.
(A) A total of 68 sequenced, inbred lines from seven North American collections were used to initiate hybrid swarm crosses. The lines were divided into two groups of 34 (populations A and B) so that each hybrid swarm had equal representation from the seven collections. Map generated using [64]. (B) Within each population, randomly ordered round-robin crosses were established. The F1 adults were released into cages and propagated with non-overlapping generations. (C) Virgin females from the F4 and F5 generations were collected and placed in environmental chambers with varying photoperiods and temperatures for 28 days. (D) Individual flies were dissected to phenotype diapause. DNA was extracted from the carcasses and individually sequenced to approximately 0.5X coverage. Sequencing reads were used to reconstruct full genome sequences and perform a genome-wide association study; results of the GWAS were integrated with D. melanogaster population genetic data. E) After one year of laboratory culture, hybrid swarm flies were placed in outdoor cages for a seasonal study of diapause phenotypes; the wild-reared flies were compared to indoor controls. Ovary drawing in (D) modified from [65] under a CC-BY license.
Fig 2
Fig 2. Effects of temperature and photoperiod on diapause in hybrid swarm populations.
(A) Ovaries were scored based on the most advanced ovariole stage and the total number of eggs, according to King (1970) [66]. Dashed lines indicate three cutoffs for scoring diapause: stage 8, stage 10, and stage 14. Colors correspond to panels B and C. (B) The most advanced ovariole stage, proportion of flies with eggs, and the total number of eggs per individual all increase with increasing temperature. Numbers above bars indicate the total number of flies phenotyped in each temperature range. (C) Among flies with eggs, the stage of the most advanced egg chamber also increases with temperature. (D-F) Diapause incidence, scored at the stage 8, stage 10, or stage 14 cutoffs, decreases with increasing temperature (binomial general linear model, P < 2 x 10⁻¹⁶ for all phenotypes). Unexpectedly, longer photoperiods (shown as hours of light: hours of dark) result in increased diapause incidence (binomial glm, P = 0.002, P = 2.7 x 10⁻⁷, P = 5.0 x 10⁻⁸, respectively). Points represent individual fly phenotypes (diapause = 1, non-diapause = 0).
Fig 3
Fig 3. A leave-one-chromosome-out (LOCO) genetic relatedness matrix results in inflated P-values in actual but not permuted GWAS.
(A) Genomic inflation factor (GIF or λGC) for 100 imputations of actual data and 100–1000 permutations for LOCO (top) and non-LOCO (bottom) GWAS of two diapause phenotypes. Points represent the median and bars extend to the 2.5 an 97.5% quantiles. Grey bars show permutations for each mapping population. (B) Average quantile-quantile plots (blue = A, purple = B, teal = both, grey = permutations) for each GWAS. Observed P-values were averaged for each expected P -value across all imputation/permuations. Ribbons represent standard deviation; black lines have slope of 1.
Fig 4
Fig 4. Diapause is a polygenic trait.
(A-B) Vg, Ve and heritabiilty estimates for stage 8 (A) and stage 10 (B) diapause phenotypes. Teal points indicate observed estimates +/- 95% confidence interval for heritability in the hybrid swarm (populations A and B combined). Grey points indicate heritability estimates for 1000 permutations. (C) Manhattan plot for GENESIS P-values for stage 10 diapause in one imputation. Teal points indicate LASSO SNPs. (D-E) Average receiver operating characteristic (ROC) curves for stage 8 (D) and stage 10 (E) diapause predictions made using LASSO SNPs (blue = A, purple = B, teal = both, grey = permutations). Phenotypes for each individual in the mapping population were predicted using the informative environmental variables, genetic principal components, and SNPs chosen by LASSO. At any given false positive rate (FPR), the true positive rate was averaged across all imputations or permutations. Observed data (colored lines) have higher true positive rates (TPR) relative to permutated GWAS (gray lines). (F-G) Quantification of ROC analysis using area under the curve metric (AUC) for stage 8 (F) and stage 10 (G) phenotypes. “env” is a model containing only environmental data; “env + PC” includes environmental data and 32 principal components; “env + PC + GWAS” includes the former plus the genotypes of up to several hundred SNPs chosen by LASSO.
Fig 5
Fig 5. Analysis of linkage disequilibrium supports a polygenic basis of diapause.
(A): Linkage disequilibrium (LD) decay for SNPs with minor allele frequency > 0.05 in the hybrid swarm (blue = A, purple = B, teal = both) contrasted to the DGRP (orange) and the DGRP down-sampled to 34 lines (yellow). Dashed lines indicate parents of the hybrid swarms, while solid lines indicate the hybrid offspring. 10,000 SNPs were randomly sampled and LD (R2) to nearby SNPs at fixed distances was measured. Lines represent median LD; ribbons represent the 95% confidence intervals. (B-D) Long distance LD between pairs of SNPs randomly sampled from 2L and 2R (B), 3L and 3R (C), or sampled from different chromosomes (D). Dashed box plots indicate parental lines.
Fig 6
Fig 6. SNPs associated with diapause at stage 8 vary predictably across latitudinal clines.
(A) Polygenic scores calculated by multiplying clinal effect size reported in Bergland et al (2014) and GWAS effect size for each SNP and summing across all SNPs, LASSO SNPs, and the top 0.01% or 0.1% of the SNPs in the GWAS. Effect sizes are polarized such that positive numbers indicated pro-diapause alleles are more common in the north. (B) Polygenic scores calculated for seasonal data by multiplying seasonal effect size reported in Bergland et al (2014) and GWAS effect size, polarized so that pro-diapause alleles and alleles with higher frequency in spring are positive. Data are shown with a point for the mean and error bars extending to the 2.5% and 97.5% quantiles. Colored points indicate actual data for 100 imputations of each mapping population; grey points indicate the distribution for permutations. Numbers indicate the percentage of imputations that exceed the 97.5% quantile of the permutations, if greater than 50%.
Fig 7
Fig 7. Plasticity and selection contribute to increased diapause in late fall in field-reared samples.
(A) Ovaries were dissected from outdoor cage flies reared on fruit and diapause was assessed at stage 8 (light green) or 10 (dark green). A general linear model was used to determine whether diapause at later collection dates differed significantly the first collection on June 26th, 2018. (‡ P < 0.1, * P < 0.05, ** P < 0.01, *** P < 1x 10⁻⁴). Samples were also collected at a single time point from cages reared on cornmeal-molasses food (brown). This sample had significantly lower diapause incidence than fruit-reared samples collected one day later at both stages. The horizontal grey lines indicate diapause incidence for stage 8 (light grey) and stage 10 (dark grey) in a single sample of 96 mated, 5–8 day old flies reared in laboratory cages on cornmeal-molasses food. (B) Field cage and laboratory cage flies were collected at several timepoints and reared in the lab for two generations before assessing diapause at stage 8 in the standard assay at either 10.5 °C (solid lines) or 12 °C (dashed lines). Diapause was marginally increased in the December outdoor sample at 12 °C (P = 0.08) and significantly increased in December at 10.5 °C (P = 0.0002), whereas it remained relatively consistent across indoor flies. (C) Same as B, but phenotypes for stage 10 diapause. Diapause increased in the December sample of outdoor cage flies relative to the first sample from June (general linear model, P = 3.7 x 10⁻⁵ at 12 °C, P = 6.1 x 10⁻⁵ at 10.5 °C), while diapause was consistent across samples in the lab-reared flies (P > 0.05 for all pairwise comparisons). (D) Weather Underground temperature data during the field season for Carter Mountain, VA, approximately 2 km from our field site.
Fig 8
Fig 8. Diapause-associated alleles are as common as expected in Zambian flies.
The median allele frequency of pro-diapause alleles for all SNPs in the GWAS, LASSO SNPs, the top 0.01% of the GWAS, and the top 0.1% of the GWAS for stage 8 (left) and stage 10 (right). Points represent median of the imputations/permutations; error bars show 2.5% to 97.5% quantiles. Grey points/bars are 100 permutations for populations A and B; 1000 permutations for both. Colored points/bars are 100 imputations of the original data. Text indicates the percentage of imputations that exceed the 97.5% quantile of the permutations, if that percentage is greater than 50%.
Fig 9
Fig 9. Integrated haplotype homozygosity score (iHS) of diapause-associated SNPs in two populations.
(A) iHS was calculated for every SNP in the DGRP, with ancestral and derived states polarized based on direction of diapause effect. For each GWAS, the median iHS was calculated for all SNPs, the LASSO SNPs, the top 0.01% of SNPs in the GWAS, and the top 0.1% of SNPs in the GWAS for each phenotype. Points represent the median; error bars extend to the 2.5% to 97.5% quantiles. Colored bars are 100 imputations of the original data. Grey bars are 100 permutations for populations A and B; 1000 permutations for both. (B) Same as panel A, but using a set of 205 lines collected from Pennsylvania and Maine (“Northern”). Text indicates the percentage of imputations that are lower than the 2.5% quantile of the permutations, if that percentage is greater than 50%.
Fig 10
Fig 10. A small region near tlk on the X chromosome drives population genetic signal in the top 0.01% of SNPs.
The top 0.01% of SNPs for the combined mapping population for stage 8 diapause are color coded by their imputation number. Left panels show the full genome; right panel is focused on a region within the gene tlk (ChrX:3,660,000–3,685,000). (A) Manhattan plot. (B) Clinal polygenic scores using data from Bergland et al 2014. (C-D) IHS in the DGRP and Northern populations. (E) Seasonal polygenic scores from Charlottesville, VA in 2014. (F) Seasonal polygenic score from Lancaster, MA in 2014. Note that y-axis scales vary between left and right panels.

References

    1. Kawecki TJ, Ebert D. Conceptual issues in local adaptation. Ecol Lett. 2004;7:1225–1241. 10.1111/j.1461-0248.2004.00684.x - DOI
    1. Paul MJ, Zucker Irving, Schwartz William J. Tracking the seasons: the internal calendars of vertebrates. Philos Trans R Soc B Biol Sci. 2008;363:341–361. 10.1098/rstb.2007.2143 - DOI - PMC - PubMed
    1. Andrés F, Coupland G. The genetic basis of flowering responses to seasonal cues. Nat Rev Genet. 2012;13:627–639. 10.1038/nrg3291 - DOI - PubMed
    1. Denlinger DL, Hahn DA, Merlin C, Holzapfel CM, Bradshaw WE. Keeping time without a spine: what can the insect clock teach us about seasonal adaptation? Phil Trans R Soc B. 2017;372:20160257 10.1098/rstb.2016.0257 - DOI - PMC - PubMed
    1. Moran NA. The Evolution of Aphid Life Cycles. Annu Rev Entomol. 1992;37:321–348. 10.1146/annurev.en.37.010192.001541 - DOI

Publication types

LinkOut - more resources