

The impact of voluntary front-of-pack nutrition labelling on packaged food reformulation: A difference-in-differences analysis of the Australasian Health Star Rating scheme
- PMID: 33216747
- PMCID: PMC7679009
- DOI: 10.1371/journal.pmed.1003427
The impact of voluntary front-of-pack nutrition labelling on packaged food reformulation: A difference-in-differences analysis of the Australasian Health Star Rating scheme
Abstract
Background: Front-of-pack nutrition labelling (FoPL) of packaged foods can promote healthier diets. Australia and New Zealand (NZ) adopted the voluntary Health Star Rating (HSR) scheme in 2014. We studied the impact of voluntary adoption of HSR on food reformulation relative to unlabelled foods and examined differential impacts for more-versus-less healthy foods.
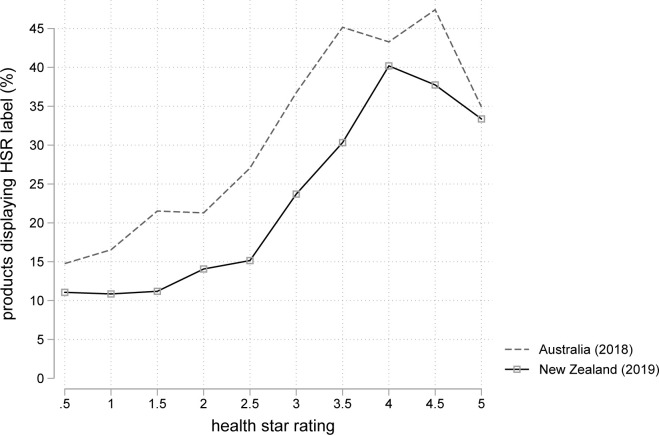
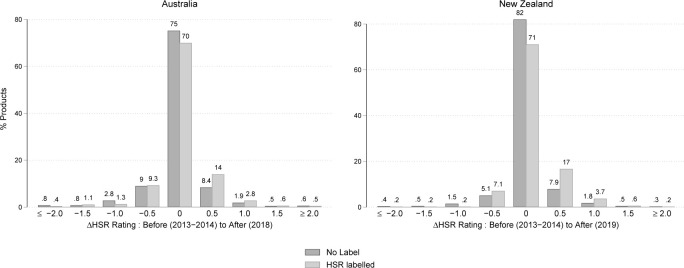
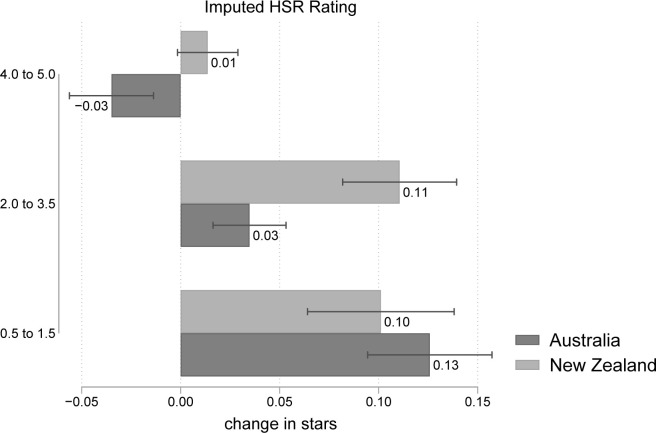
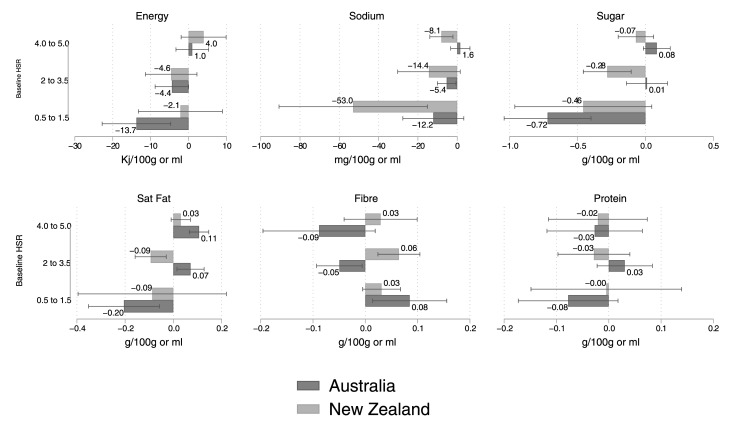
Methods and findings: Annual nutrition information panel data were collected for nonseasonal packaged foods sold in major supermarkets in Auckland from 2013 to 2019 and in Sydney from 2014 to 2018. The analysis sample covered 58,905 unique products over 14 major food groups. We used a difference-in-differences design to estimate reformulation associated with HSR adoption. Healthier products adopted HSR more than unhealthy products: >35% of products that achieved 4 or more stars displayed the label compared to <15% of products that achieved 2 stars or less. Products that adopted HSR were 6.5% and 10.7% more likely to increase their rating by ≥0.5 stars in Australia and NZ, respectively. Labelled products showed a -4.0% [95% confidence interval (CI): -6.4% to -1.7%, p = 0.001] relative decline in sodium content in NZ, and there was a -1.4% [95% CI: -2.7% to -0.0%, p = 0.045] sodium change in Australia. HSR adoption was associated with a -2.3% [-3.7% to -0.9%, p = 0.001] change in sugar content in NZ and a statistically insignificant -1.1% [-2.3% to 0.1%, p = 0.061] difference in Australia. Initially unhealthy products showed larger reformulation effects when adopting HSR than healthier products. No evidence of a change in protein or saturated fat content was observed. A limitation of our study is that results are not sales weighted. Thus, it is not able to assess changes in overall nutrient consumption that occur because of HSR-caused reformulation. Also, participation into labelling and reformulation is jointly determined by producers in this observational study, impacting its generalisability to settings with mandatory labelling.
Conclusions: In this study, we observed that reformulation changes following voluntary HSR labelling are small, but greater for initially unhealthy products. Initially unhealthy foods were, however, less likely to adopt HSR. Our results, therefore, suggest that mandatory labelling has the greatest potential for improving the healthiness of packaged foods.
Conflict of interest statement
I have read the journal's policy and the authors of this manuscript have the following competing interests: C.NM is a member of the New Zealand Health Star Rating Advisory Group. The Advisory Group had no role in the study design, data collection and analysis, decision to publish, or preparation of the manuscript.
Figures
References
-
- World Health Organisation. Non Communicable Diseases—Unhealthy Diet. 2020. Available from: http://www.emro.who.int/noncommunicable-diseases/causes/unhealthy-diets.....
-
- Aschemann-Witzel J, Hamm U. Do consumers prefer foods with nutrition and health claims? Results of a purchase simulation. J Mark Commun. 2010;16(1–2):47–58.
-
- Health Star Rating. Australian Government Department of Health and Ageing.
-
- Department of Health and Social Care. The nutrient profiling model—GOV.UK 2011. Available from: https://assets.publishing.service.gov.uk/government/uploads/system/uploa....
Publication types
MeSH terms
LinkOut - more resources
Full Text Sources
Medical
