. 2020 Nov 20;18(11):e3000925.
doi: 10.1371/journal.pbio.3000925. eCollection 2020 Nov.

Structure of the Lifeact-F-actin complex

Affiliations

Structure of the Lifeact-F-actin complex

Alexander Belyy et al. PLoS Biol. .

Abstract

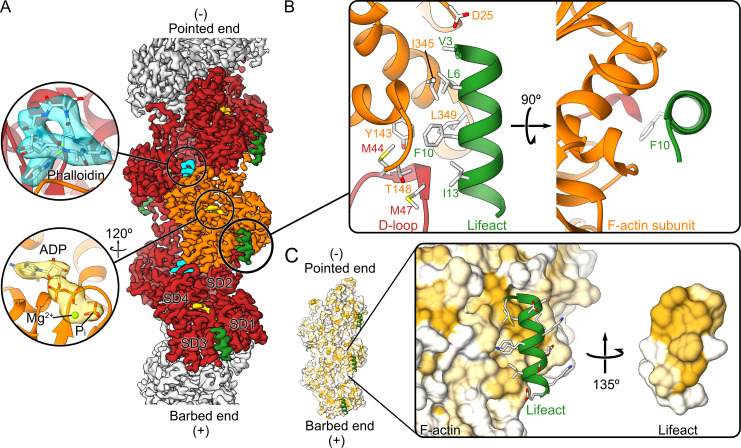
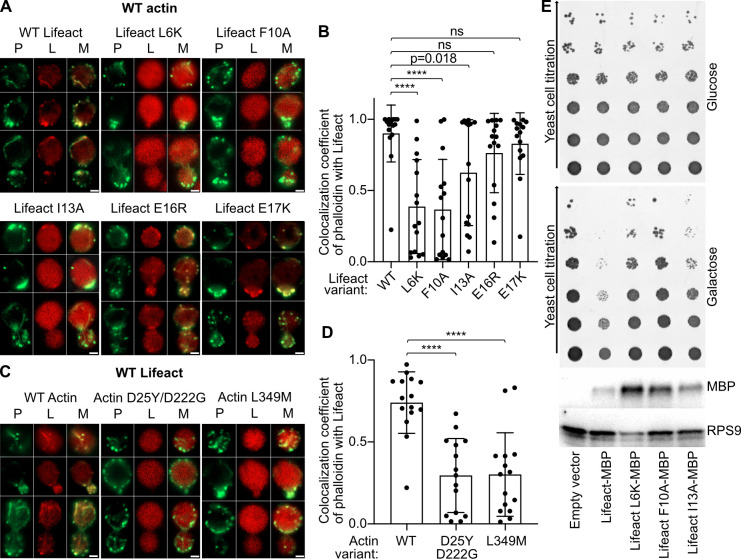
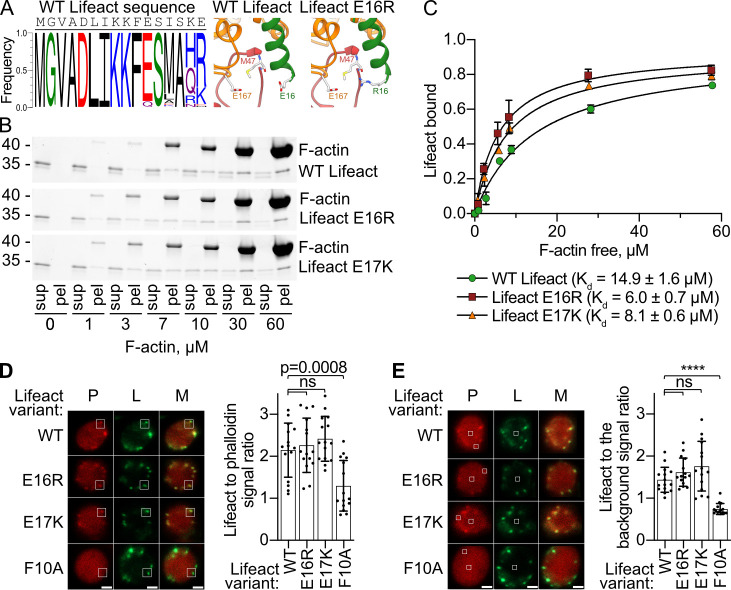
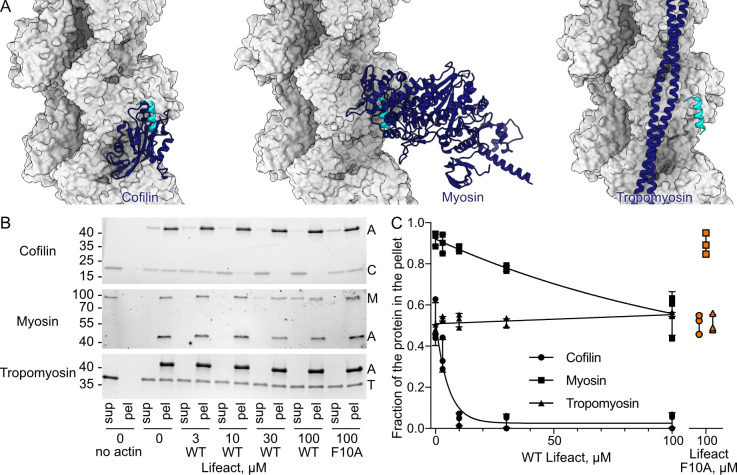
Lifeact is a short actin-binding peptide that is used to visualize filamentous actin (F-actin) structures in live eukaryotic cells using fluorescence microscopy. However, this popular probe has been shown to alter cellular morphology by affecting the structure of the cytoskeleton. The molecular basis for such artefacts is poorly understood. Here, we determined the high-resolution structure of the Lifeact-F-actin complex using electron cryo-microscopy (cryo-EM). The structure reveals that Lifeact interacts with a hydrophobic binding pocket on F-actin and stretches over 2 adjacent actin subunits, stabilizing the DNase I-binding loop (D-loop) of actin in the closed conformation. Interestingly, the hydrophobic binding site is also used by actin-binding proteins, such as cofilin and myosin and actin-binding toxins, such as the hypervariable region of TccC3 (TccC3HVR) from Photorhabdus luminescens and ExoY from Pseudomonas aeruginosa. In vitro binding assays and activity measurements demonstrate that Lifeact indeed competes with these proteins, providing an explanation for the altering effects of Lifeact on cell morphology in vivo. Finally, we demonstrate that the affinity of Lifeact to F-actin can be increased by introducing mutations into the peptide, laying the foundation for designing improved actin probes for live cell imaging.


Conflict of interest statement

The authors have declared that no competing interests exist.

Figures

Fig 1
Fig 1. Cryo-EM structure of the Lifeact–F-actin–ADP–Pi–phalloidin complex.
(A) The 3.5 Å resolution map of the Lifeact–F-actin–ADP–Pi–phalloidin complex shows a defined density for phalloidin (cyan), ADP–Pi (gold), and the Lifeact peptide (green). The central subunit of actin is colored in orange, while its surrounding 4 neighbors are shown in red. (B) Atomic model of the interface between Lifeact and F-actin. (C) Surface of the atomic model of F-actin colored according to its hydrophobicity. Hydrophobicity increases as the color scale goes from white to gold. The inset highlights the hydrophobic nature of the Lifeact-binding surface. Cryo-EM, electron cryo-microscopy; D-loop, DNase I–binding loop; F-actin, filamentous actin; SD, subdomain.
Fig 2
Fig 2. The Lifeact–F-actin complex is affected by point mutations.
(A, C) Confocal microscopy images of yeast cells expressing Lifeact–mCherry variants in a WT actin background (A) and WT Lifeact–mCherry in yeast with different actin variants replacing endogenous WT actin (C). Actin was additionally stained with fluorescently labeled phalloidin (ActinGreen 488). Yeast cells at different division phases are shown. Note that for our experiments, we used the previously described D25Y/D222G double mutant of yeast actin [34]. However, D222 is located in subdomain IV and therefore unlikely plays a role in the Lifeact–F-actin interaction. Scale bars, 2 μm. (B, D) Calculated weighted colocalization coefficients of phalloidin with Lifeact–mCherry from 15 yeast cells from 2 independent experiments with 5 micrographs each, corresponding to (A) and (C), respectively. For statistical analysis, the unpaired t test was used in (B) and (D). ****p < 0.0001; ns, not significant. The error bars in the panels correspond to standard deviations. (E) Growth phenotype assay with yeast overexpressing Lifeact–MBP variants under a strong galactose promoter. The top image marked “Glucose” corresponds to experimental conditions with low Lifeact expression. The central image marked “Galactose” corresponds to experimental conditions with high Lifeact expression. The lower image is a western blot of cells grown on galactose-containing media performed using anti-MBP and anti-Ribosomal protein S9 (RPS9) antibodies. The uncropped drop tests, western blots, and gels can be found in S4 Fig. Data points that were used to create graphs are reported in S2 Table. F-actin, filamentous actin; L, Lifeact; M, merge; MBP, maltose-binding protein; P, phalloidin; WT, wild-type.
Fig 3
Fig 3. Lifeact sequence design.
(A) Frequency of amino acids in the top 100 designs produced by Rosetta (left panel) and predicted structure of the E16R mutant (right panel). The WT structure is included for comparison. (B) Cosedimentation of F-actin and 3- μM Lifeact–mCherry proteins detected by SDS-PAGE. The upper band corresponds to Lifeact–mCherry, and the lower band corresponds to actin. Representative stain-free gels are shown. The uncropped gels can be found in S4 Fig. (C) The fractions of Lifeact–mCherry that cosedimented with F-actin were quantified by densitometry and plotted versus actin concentrations. The error bars in panel C correspond to standard deviations of 3 independent experiments. (D) Representative images of cells expressing the indicated Lifeact variants are shown on the left panel. The total fluorescence signal of Lifeact–mCherry from the 1- μm2 square region consisting of an F-actin-rich patch was divided by the total fluorescence signal of phalloidin in the same region and plotted on the right panel. (E) The total fluorescence signal of Lifeact–mCherry from the 0.25- μm2 square region (as shown on the left panel) consisting of an F-actin-rich patch was divided by the total fluorescence signal of Lifeact–mCherry in the F-actin-lacking region (“background”) and plotted on the graph on the right panel. A total of 15 patches from 2 independent experiments were used to prepare right panels on (D) and (E). For statistical analysis, the unpaired t test was used. ****p < 0.0001; ns, not significant. Scale bars, 1 μm. Data points that were used to create graphs are reported in S2 Table. F-actin, filamentous actin; pel, pellet; sup, supernatant; WT, wild-type.
Fig 4
Fig 4. Lifeact competes with cofilin and myosin in vitro.
(A) Structural models of the cofilin–F-actin (PDB 5YU8) [31], myosin–F-actin (PDB 5JLH) [32], and tropomyosin–F-actin (PDB 3J8A) [33] complexes. (B) SDS-PAGE analysis of cosedimentation experiments of F-actin (4 μM, upper band) with human cofilin-1 (4 μM, lower band); of F-actin (0.2 μM, lower band) with the motor domain of human NM2C (0.2 μM, upper band); and of F-actin (3 μM, lower band) with human tropomyosin alpha-1 (3 μM, upper band) in the presence of the indicated amounts of Lifeact. Representative gels are shown. The uncropped gels can be found in S4 Fig. The fractions of cofilin, myosin, and tropomyosin that cosedimented with F-actin in the corresponding experiments were quantified by densitometry and plotted against Lifeact concentrations at (C). The error bars correspond to standard deviations of 3 independent experiments. Data points that were used to create graphs are reported in S2 Table. A, F-actin; C, cofilin; F-actin, filamentous actin; M, myosin; pel, pellet; sup, supernatant; T, tropomyosin; NM2C, non-muscle myosin 2.
Fig 5
Fig 5. Lifeact impairs the activity of F-actin-binding bacterial toxins.
(A) SDS-PAGE analysis of cosedimentation experiments of F-actin (1 μM, lower band) with ExoY-MBP (1 μM, upper band) in the presence of the indicated amounts of Lifeact. A representative gel is shown. The fractions of ExoY that cosedimented with F-actin were quantified by densitometry and plotted against Lifeact concentrations in (B). (C) The atomic model of the Lifeact–F-actin complex shows that T148, the site of Tcc3HVR modification [36], is localized within a 4 Å distance from F10 of Lifeact (green). (D) The level of actin ADP-ribosylation by TccC3HVR in the presence of Lifeact was analyzed by western blot using an ADP-ribose binding reagent. The equal loading of actin was additionally verified by imaging the same stain-free gel prior to blotting (lower image). The ADP-ribosylation level of actin was quantified by densitometry and plotted against Lifeact concentrations in (E). Error bars at (B) and (E) correspond to standard deviations of 3 independent experiments. (F) HEK 293T cells expressing mCherry fusions of actin or LifeAct variants were intoxicated with 300 pM of the Photorhabdus luminescens toxin PTC3, which injects TccC3HVR into cells. The degree of cytoskeletal collapse and accompanying cell shrinkage was monitored for 5 hours using live cell imaging and is plotted based on 3 independent experiments for each condition. Scale bars, 20 μm. The uncropped western blots and gels can be found in S4 Fig. Data points that were used to create graphs are reported in S2 Table. F-actin, filamentous actin; HEK, human embryonic kidney; MBP, maltose-binding protein; pel, pellet; sup, supernatant; TccC3HVR, hypervariable region of TccC3; WT, wild-type.

References

    1. Pollard TD, Cooper JA. Actin, a central player in cell shape and movement. Science. 2009;326(5957):1208–1212. 10.1126/science.1175862 - DOI - PMC - PubMed
    1. Melak M, Plessner M, Grosse R. Actin visualization at a glance. J Cell Sci. 2017;130(3):525–530. 10.1242/jcs.189068 - DOI - PubMed
    1. Lynen F, Wieland U. Über die Giftstoffe des Knollenblätterpilzes. Justus Liebigs Ann Chem. 1938;533(1):93–117.
    1. Crews P, Manes LV, Boehler M. Jasplakinolide, a cyclodepsipeptide from the marine sponge. Tetrahedron Lett. 1986;27(25):2797–2800.
    1. Dancker P, Low I, Hasselbach W, Wieland T. Interaction of actin with phalloidin: polymerization and stabilization of F-actin. Biochim Biophys Acta. 1975;400(2):407–414. 10.1016/0005-2795(75)90196-8 - DOI - PubMed

Publication types

MeSH terms