. 2021 Jun 15;72(12):e978-e992.
doi: 10.1093/cid/ciaa1747.

Coinfection by Severe Acute Respiratory Syndrome Coronavirus 2 and Influenza A(H1N1)pdm09 Virus Enhances the Severity of Pneumonia in Golden Syrian Hamsters

Affiliations

Coinfection by Severe Acute Respiratory Syndrome Coronavirus 2 and Influenza A(H1N1)pdm09 Virus Enhances the Severity of Pneumonia in Golden Syrian Hamsters

Anna Jinxia Zhang et al. Clin Infect Dis. .

Abstract

Background: Clinical outcomes of the interaction between the co-circulating pandemic severe acute respiratory syndrome coronavirus 2 (SARS-CoV-2) and seasonal influenza viruses are unknown.

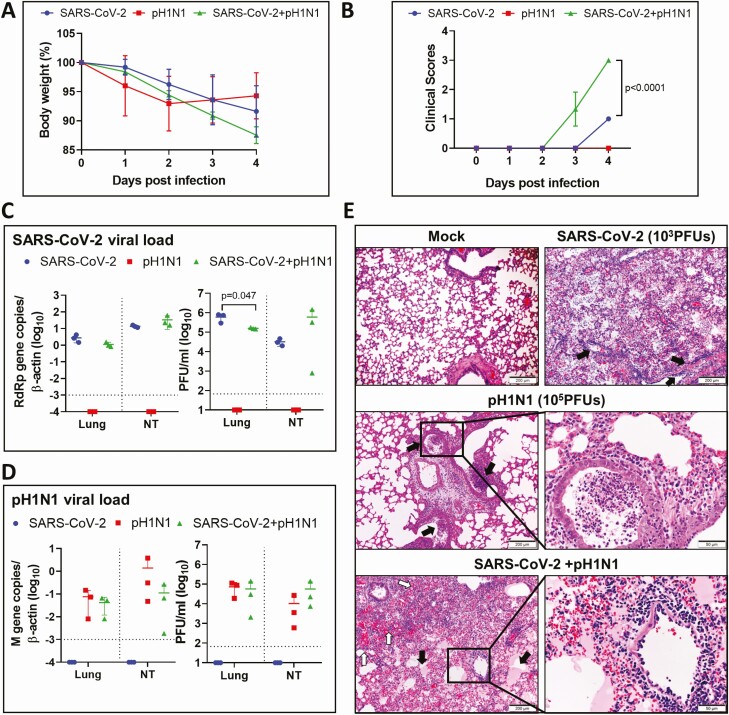
Methods: We established a golden Syrian hamster model coinfected by SARS-CoV-2 and mouse-adapted A(H1N1)pdm09 simultaneously or sequentially. The weight loss, clinical scores, histopathological changes, viral load and titer, and serum neutralizing antibody titer were compared with hamsters challenged by either virus.

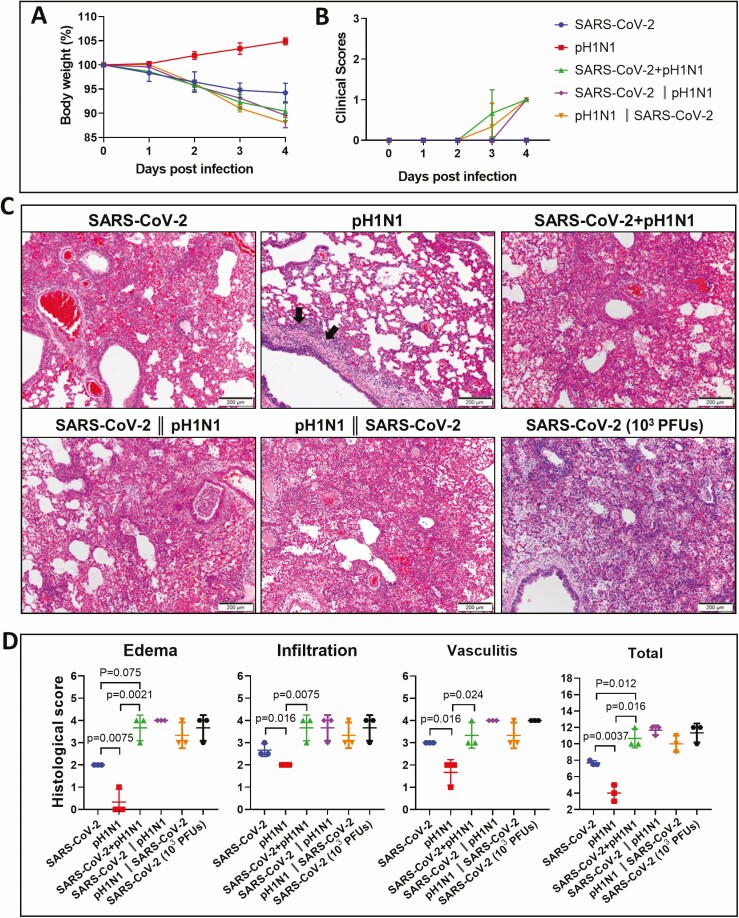
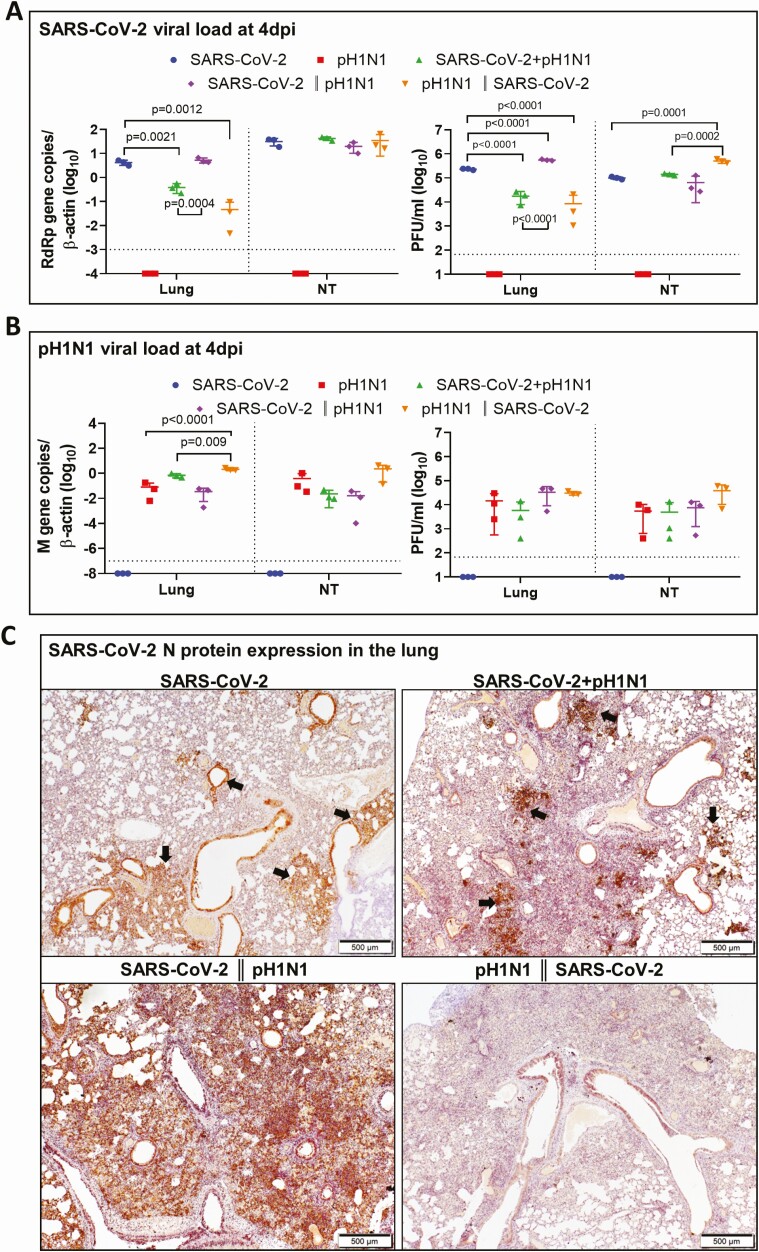
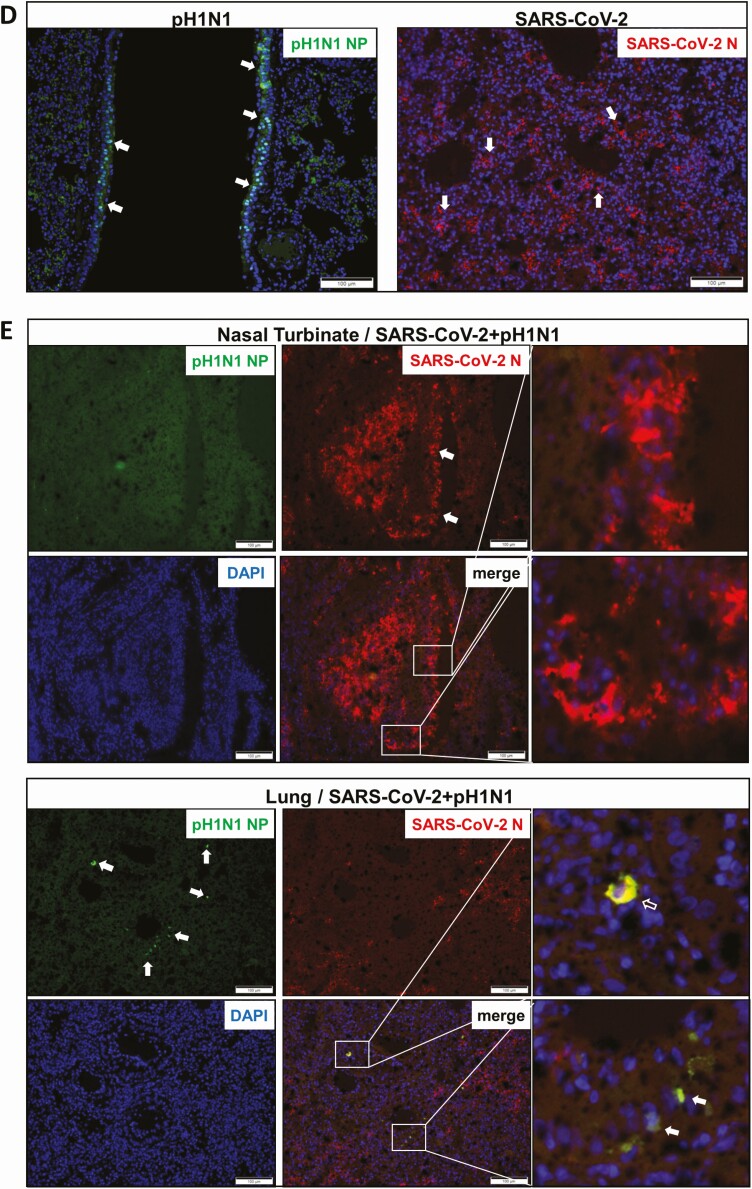
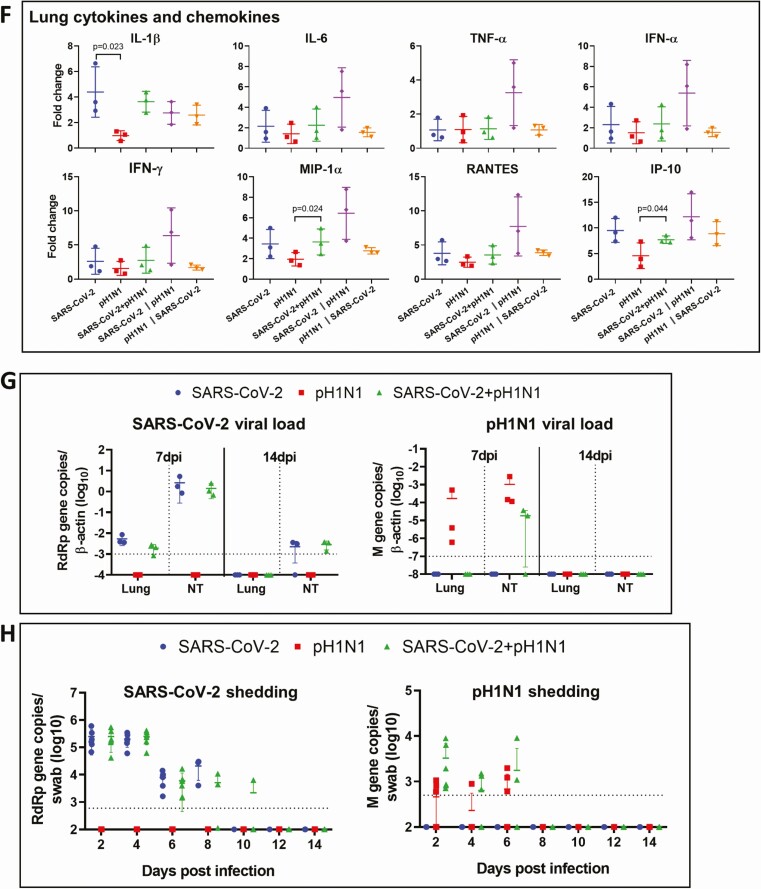
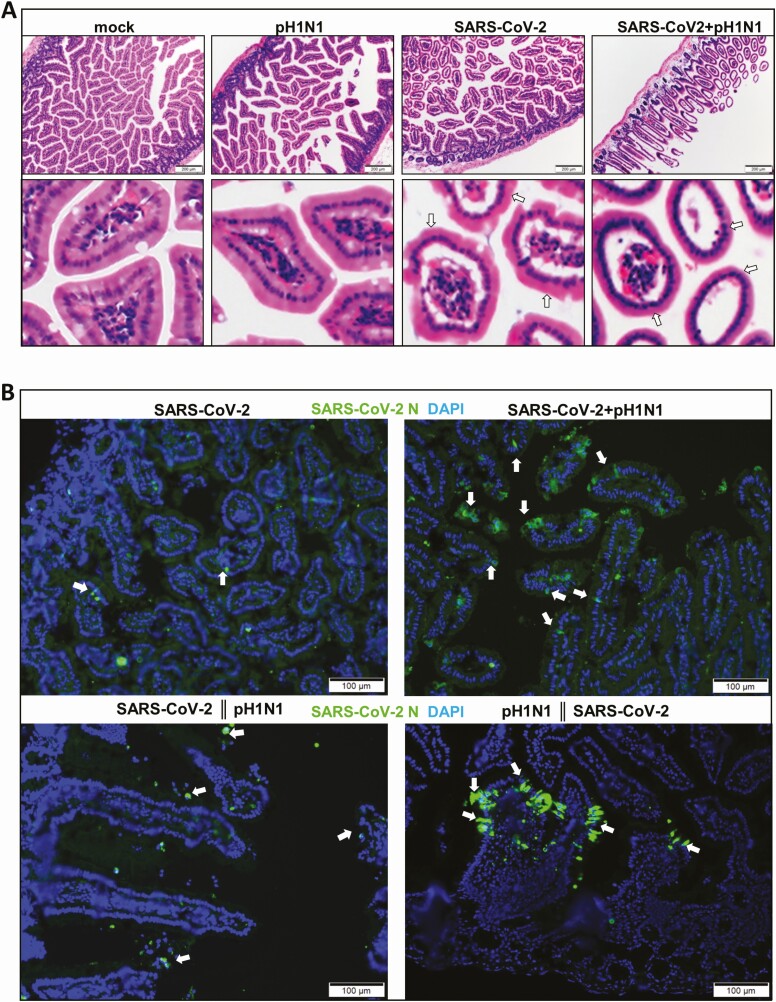
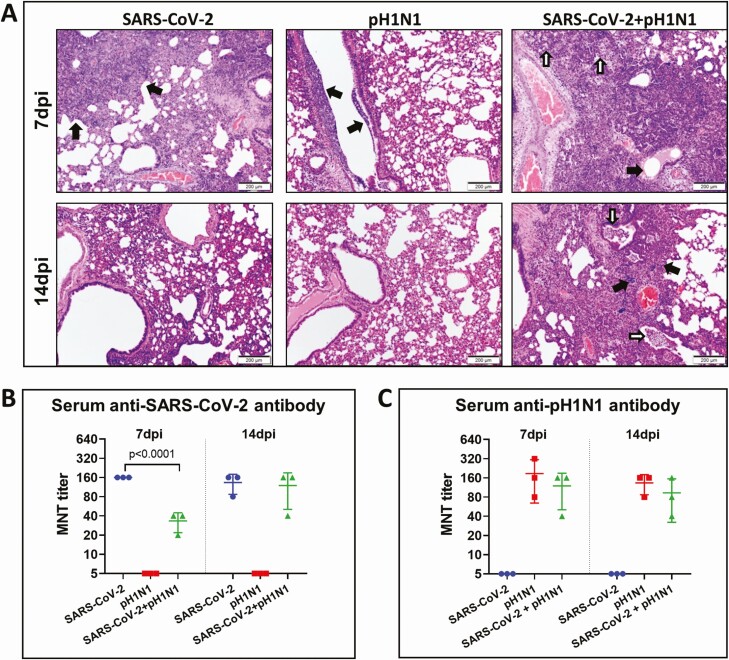
Results: Coinfected hamsters had more weight loss, more severe lung inflammatory damage, and tissue cytokine/chemokine expression. Lung viral load, infectious virus titers, and virus antigen expression suggested that hamsters were generally more susceptible to SARS-CoV-2 than to A(H1N1)pdm09. Sequential coinfection with A(H1N1)pdm09 one day prior to SARS-CoV-2 exposure resulted in a lower lung SARS-CoV-2 titer and viral load than with SARS-CoV-2 monoinfection, but a higher lung A(H1N1)pdm09 viral load. Coinfection also increased intestinal inflammation with more SARS-CoV-2 nucleoprotein expression in enterocytes. Simultaneous coinfection was associated with delay in resolution of lung damage, lower serum SARS-CoV-2 neutralizing antibody, and longer SARS-CoV-2 shedding in oral swabs compared to that of SARS-CoV-2 monoinfection.

Conclusions: Simultaneous or sequential coinfection by SARS-CoV-2 and A(H1N1)pdm09 caused more severe disease than monoinfection by either virus in hamsters. Prior A(H1N1)pdm09 infection lowered SARS-CoV-2 pulmonary viral loads but enhanced lung damage. Whole-population influenza vaccination for prevention of coinfection, and multiplex molecular diagnostics for both viruses to achieve early initiation of antiviral treatment for improvement of clinical outcome should be considered.

Keywords: COVID-19; SARS-CoV-2; coinfection; coronavirus; hamster; influenza; monoinfection.


Figures

Figure 1.
Figure 1.
Schema for all hamster experiments and titration of A(H1N1)pdm09 virus inoculum for hamster infection. A, Schematic diagram for experimental layout. Six- to 8-week-old Syrian hamsters were grouped randomly; severe acute respiratory syndrome coronavirus 2 (SARS-CoV-2) and A(H1N1)pdm09 mouse-adapted A/Hong Kong 415742/2009 strain (pH1N1) were inoculated via the intranasal route. The animals were observed daily for disease signs and body weight change, and killed at 4 days postinfection (dpi) for virologic, cytokine/chemokine expression, and histopathological studies. B, Body weight changes during the 5-day experimental period for groups of animals inoculated with 102, 104, or 106 plaque-forming units (PFUs) of pH1N1 alone. Weight on day 0 before virus inoculation was taken as 100%. C, Viral load determined by real-time reverse-transcription polymerase chain reaction (RT-qPCR) for influenza A matrix gene (M gene) in homogenized lung and nasal turbinate (NT) tissues taken at 4 dpi. Data are presented as copies of M gene/copy of β-actin in log scale. D, Relative expression levels of inflammatory cytokine/chemokine messenger RNA determined by RT-qPCR in pH1N1-infected hamster lungs. Gene expression levels in mock control hamster lung tissues were used as baseline control. E, Representative histologic images of hamster NT (top panels) and lung tissues (bottom panels) at 4 dpi. NT tissue showed epithelial cell detachment in hematoxylin and eosin (H&E) image; the immunohistochemistry-stained pH1N1 nucleoprotein (NP) was abundantly expressed in epithelium and detached cells (brown color, arrows). The H&E images of lung tissue show peribronchiolar and perivascular inflammatory cell infiltration and bronchiolar epithelium cell death, and pH1N1 NP expression in the bronchiolar epithelial cells (arrows). Cytokine/chemokine abbreviations: IFN, interferon; IL, interleukin; IP-10, interferon-γ induced protein 10; MIP-1α, macrophage inflammatory protein 1 alpha; RANTES, regulated upon activation normal T-cell expressed protein; TNF-α, tumor necrosis factor alpha.
Figure 2.
Figure 2.
Simultaneous coinfection of hamsters by higher doses of severe acute respiratory syndrome coronavirus 2 (SARS-CoV-2) and mouse-adapted A/Hongkong/415742/2009 H1N1 (pH1N1). Groups of hamsters were intranasally inoculated with 50 µL of SARS-CoV-2 (103 plaque-forming units [PFUs]) and pH1N1 (105 PFUs) mixture; the animals were monitored for body weight and clinical sign scores, and killed at 4 days postinfection (dpi). Monoinfection by either viruses were included as controls. A, Body weight changes during the 5-day experimental period. Weight on day 0 before virus inoculation was taken as 100%. n = 3 each group. Error bars indicate mean ± standard deviation. B, Average clinical scores for disease signs including lethargy, ruffled fur, hunchback posture, and rapid breathing. A score of 1 was given to each of these clinical signs. P value was calculated by 2-way analysis of variance. C, SARS-CoV-2 viral load in homogenized lung or nasal turbinate (NT) tissues at 4 dpi after monoinfection or coinfection. Right panels are SARS-CoV-2 RdRp gene copies determined by real-time reverse-transcription polymerase chain reaction (RT-qPCR). The left panels are infectious viral titers determined by plaque assays in Vero E6 cells. P value was calculated by Student t test. Horizontal dashed line indicates detection limit of the assays. D, pH1N1 viral load in lung and nasal turbinate (NT) by RT-qPCR (right panel), or plaque assays in Madin-Darby canine kidney cells (left panel). Horizontal dashed line indicates detection limit of the assays. E, Representative images of lung histopathological changes at 4 dpi after monoinfection or coinfection. Top left image shows the normal lung structure of mock control. SARS-CoV-2 (103 PFUs) monoinfection showed diffuse alveolitis with massive alveolar space inflammatory cell infiltration, exudation, and pulmonary vasculitis (arrows, top right image). pH1N1 (105 PFUs)–infected lung showed conspicuous bronchiolar luminal cell debris (arrows), mild peribronchiolar infiltration, and perivascular edema; a bronchiole section inside the boxed area filled with cell debris is shown in magnified image. Images in the bottom panels are SARS-CoV-2+pH1N1-coinfected lung tissue, which showed massive exudation of protein-rich fluid (pink color) filling alveolar space (solid arrows), and a large area of alveolar hemorrhage (open arrows). Boxed area is magnified showing endotheliitis in a blood vessel.
Figure 3.
Figure 3.
Simultaneous or sequential coinfections with lower doses of mouse-adapted A/Hongkong/415742/2009 H1N1 (pH1N1) and severe acute respiratory syndrome coronavirus 2 (SARS-CoV-2) in hamsters showed increased disease severity. Groups of hamsters were inoculated with SARS-CoV-2 (10 plaque-forming units [PFUs]) and pH1N1(104 PFUs), singly, simultaneously, or sequentially as described in Figure 1A. A, Body weight changes during the 5-day experimental period. n = 3 each group. Error bars indicate mean ± standard deviation (SD). B, Average clinical scores for signs of disease including lethargy, ruffled fur, hunchback posture, and rapid breathing. A score of 1 was given to each of these clinical signs. C, Representative hematoxylin and eosin stained images of the lungs at 4 days postinfection (dpi) after monoinfection simultaneous, and sequential coinfections. Lung sections of SARS-CoV-2 (10 PFUs) monoinfection showed patchily distributed alveolar wall and alveolar space infiltration. pH1N1(104 PFUs)–infected lung showed peribronchiolar infiltration, bronchiolar wall infiltration (arrows), and alveolar wall congestion. The images for the lung of both simultaneous and sequential coinfections showed diffuse alveolar infiltration, severe exudation, and alveolar hemorrhage. The severity of damage is much greater when compared to either virus monoinfection, but is comparable to higher dose of SARS-CoV-2 (103 PFUs) monoinfection shown in the lower right image. D, Histology scores for the lung sections at 4 dpi after monoinfection or coinfections. Each category of the characteristic histopathology changes for alveolitis caused by virus infection, including pulmonary edema, alveolar infiltration, and blood vessel inflammation were examined and scored. Lung sections from higher dose SARS-CoV-2 (103 PFUs) monoinfection were included for comparison. n = 3 each group. Three lung lobes were examined from each hamster. P value was calculated by one-way analysis of variance. Error bars indicate mean ± SD. Double vertical lines indicate sequential inoculation (24 hours apart); + indicates simultaneous inoculation.
Figure 4.
Figure 4.
Viral replication profiles in the lung and nasal turbinate (NT) tissue of hamsters after monoinfection, simultaneous, or sequential coinfection. A, Severe acute respiratory syndrome coronavirus 2 (SARS-CoV-2) viral load in lung and NT tissues. SARS-CoV-2 RdRp gene copies determined by real-time reverse-transcription polymerase chain reaction (RT-qPCR) (left panel). SARS-CoV-2 infectious viral titers were determined by plaque assays in Vero E6 cells (right). n = 3 each group. P values are calculated by one-way analysis of variance (ANOVA). Error bars indicate mean ± standard deviation (SD). Horizontal dashed line indicates detection limit of the assays. B, Mouse-adapted A/Hongkong/415742/2009 H1N1 (pH1N1) viral load in lung and NT tissues by RT-qPCR (influenza A matrix gene, left panel) or plaque assays in Madin-Darby canine kidney cells (right). n = 3 each group. P values are calculated by one-way ANOVA. Error bars indicate mean ± SD. Horizontal dashed line indicates detection limit of the assays. C, Representative images of immunohistochemistry-stained SARS-CoV-2 N protein in the lung tissues after monoinfection or coinfection. SARS-CoV-2 N protein Continued was stained in brown. The images of SARS-CoV-2 monoinfection shows N protein expression in regional alveoli and bronchiolar epithelium (arrows); simultaneously coinfected lung has small patches of N protein expression in a large area of inflammatory consolidated lung tissue (arrows); the lung coinfected sequentially by SARS-CoV-2 prior to pH1N1 (SARS-CoV-2 || pH1N1) shows extensive N protein expression distributed diffusely in the lung, whereas in sequential coinfection by pH1N1 prior to SARS-CoV-2 (pH1N1 || SARS-CoV-2), the large area of inflammatory consolidation in lung tissue shows a few N protein–positive cells. D, Immunofluorescence images illustrate pH1N1 NP antigen and SARS-CoV-2 N antigen in single virus–infected hamster lung tissues. pH1N1 nucleoprotein (NP) is only seen in the epithelium of bronchiolar epithelium, not in alveoli (NP, green). SARS-CoV-2 N antigen is seen diffusely distributed in alveoli (N, red). E, Dual immunofluorescence images illustrate the distribution of pH1N1 NP and SARS-CoV-2 N in simultaneously coinfected hamster NT (upper panels) and lung tissues (lower panels). pH1N1 NP antigen was rarely seen in the coinfected NT tissues, whereas SARS-CoV-2 N protein was abundantly detected (arrows, N stained red). In the lung tissue, the 2 viral antigens also distributed differently. These images show pH1N1 NP expression in a few cells in the bronchiolar epithelium, but not in alveoli (arrows, green), while SARS-CoV-2 N is seen in alveoli (red) but not in bronchiole. Co-localization of SARS-CoV-2 N and pH1N1 NP antigen is shown in a macrophage (magnified image, open arrow). F, Relative expression of inflammatory cytokines/chemokines in hamster lung tissues determined by RT-qPCR using gene-specific primers. G, RT-qPCR determined SARS-CoV-2 viral load (left) and pH1N1 viral load (right) in the lung and NT tissues taken at 7 days postinfection (dpi) or 14 dpi after simultaneous coinfection or monoinfection. n = 3 each group. Error bars indicate mean ± SD. Horizontal dashed line indicates detection limit of the assays. H, SARS-CoV-2 (left) and pH1N1 (right) virus shedding from oral swabs determined by RT-qPCR. Oral swab samples were collected every other day during the 14 days after virus challenge. Error bars indicate mean ± SD. Horizontal dashed line indicates detection limit of the assays. Double vertical lines indicate sequential inoculation (24 hours apart); + indicates simultaneous inoculation. Abbreviations: IP-10, interferon-γ induced protein 10; M gene, influenza A matrix gene; MIP-1α, macrophage inflammatory protein 1 alpha; N, severe acute respiratory syndrome coronavirus 2 nucleocapsid protein; NP, influenza A nucleoprotein; NT, nasal turbinate; pH1N1, mouse-adapted A/Hongkong/415742/2009 H1N1; PFU, plaque-forming unit; RANTES, regulated upon activation, normal T-cell expressed protein; RdRp, RNA-dependent RNA polymerase; SARS-CoV-2, severe acute respiratory syndrome coronavirus 2; TNF-α, tumor necrosis factor alpha.
Figure 4.
Figure 4.
Viral replication profiles in the lung and nasal turbinate (NT) tissue of hamsters after monoinfection, simultaneous, or sequential coinfection. A, Severe acute respiratory syndrome coronavirus 2 (SARS-CoV-2) viral load in lung and NT tissues. SARS-CoV-2 RdRp gene copies determined by real-time reverse-transcription polymerase chain reaction (RT-qPCR) (left panel). SARS-CoV-2 infectious viral titers were determined by plaque assays in Vero E6 cells (right). n = 3 each group. P values are calculated by one-way analysis of variance (ANOVA). Error bars indicate mean ± standard deviation (SD). Horizontal dashed line indicates detection limit of the assays. B, Mouse-adapted A/Hongkong/415742/2009 H1N1 (pH1N1) viral load in lung and NT tissues by RT-qPCR (influenza A matrix gene, left panel) or plaque assays in Madin-Darby canine kidney cells (right). n = 3 each group. P values are calculated by one-way ANOVA. Error bars indicate mean ± SD. Horizontal dashed line indicates detection limit of the assays. C, Representative images of immunohistochemistry-stained SARS-CoV-2 N protein in the lung tissues after monoinfection or coinfection. SARS-CoV-2 N protein Continued was stained in brown. The images of SARS-CoV-2 monoinfection shows N protein expression in regional alveoli and bronchiolar epithelium (arrows); simultaneously coinfected lung has small patches of N protein expression in a large area of inflammatory consolidated lung tissue (arrows); the lung coinfected sequentially by SARS-CoV-2 prior to pH1N1 (SARS-CoV-2 || pH1N1) shows extensive N protein expression distributed diffusely in the lung, whereas in sequential coinfection by pH1N1 prior to SARS-CoV-2 (pH1N1 || SARS-CoV-2), the large area of inflammatory consolidation in lung tissue shows a few N protein–positive cells. D, Immunofluorescence images illustrate pH1N1 NP antigen and SARS-CoV-2 N antigen in single virus–infected hamster lung tissues. pH1N1 nucleoprotein (NP) is only seen in the epithelium of bronchiolar epithelium, not in alveoli (NP, green). SARS-CoV-2 N antigen is seen diffusely distributed in alveoli (N, red). E, Dual immunofluorescence images illustrate the distribution of pH1N1 NP and SARS-CoV-2 N in simultaneously coinfected hamster NT (upper panels) and lung tissues (lower panels). pH1N1 NP antigen was rarely seen in the coinfected NT tissues, whereas SARS-CoV-2 N protein was abundantly detected (arrows, N stained red). In the lung tissue, the 2 viral antigens also distributed differently. These images show pH1N1 NP expression in a few cells in the bronchiolar epithelium, but not in alveoli (arrows, green), while SARS-CoV-2 N is seen in alveoli (red) but not in bronchiole. Co-localization of SARS-CoV-2 N and pH1N1 NP antigen is shown in a macrophage (magnified image, open arrow). F, Relative expression of inflammatory cytokines/chemokines in hamster lung tissues determined by RT-qPCR using gene-specific primers. G, RT-qPCR determined SARS-CoV-2 viral load (left) and pH1N1 viral load (right) in the lung and NT tissues taken at 7 days postinfection (dpi) or 14 dpi after simultaneous coinfection or monoinfection. n = 3 each group. Error bars indicate mean ± SD. Horizontal dashed line indicates detection limit of the assays. H, SARS-CoV-2 (left) and pH1N1 (right) virus shedding from oral swabs determined by RT-qPCR. Oral swab samples were collected every other day during the 14 days after virus challenge. Error bars indicate mean ± SD. Horizontal dashed line indicates detection limit of the assays. Double vertical lines indicate sequential inoculation (24 hours apart); + indicates simultaneous inoculation. Abbreviations: IP-10, interferon-γ induced protein 10; M gene, influenza A matrix gene; MIP-1α, macrophage inflammatory protein 1 alpha; N, severe acute respiratory syndrome coronavirus 2 nucleocapsid protein; NP, influenza A nucleoprotein; NT, nasal turbinate; pH1N1, mouse-adapted A/Hongkong/415742/2009 H1N1; PFU, plaque-forming unit; RANTES, regulated upon activation, normal T-cell expressed protein; RdRp, RNA-dependent RNA polymerase; SARS-CoV-2, severe acute respiratory syndrome coronavirus 2; TNF-α, tumor necrosis factor alpha.
Figure 5.
Figure 5.
Simultaneous severe acute respiratory syndrome coronavirus 2 (SARS-CoV-2) and mouse-adapted A/Hongkong/415742/2009 H1N1 (pH1N1) coinfection induced intestinal tissue damage. A, Hematoxylin and eosin images of small intestine sections after monoinfection or simultaneous coinfection of hamsters at 4 days postinfection. Normal structure of intestinal villi is shown in mock control hamster. No obvious morphological changes are shown in pH1N1 (104 plaque-forming units [PFUs]) SARS-CoV-2 (10 PFUs) caused some degree of intestinal villi edema (arrows), but simultaneous coinfection increased small intestine inflammatory infiltration and intestinal villi edema, which cause deformation of villi (arrows). B, Images of immunofluorescence-stained SARS-CoV-2 N protein in intestinal sections. N protein was stained in green (arrows), cell nuclei in blue (DAPI). Double vertical lines indicate sequential inoculation (24 hours apart); + indicates simultaneous inoculation.
Figure 6.
Figure 6.
Reduced antibody responses and delayed resolution of lung inflammation after severe acute respiratory syndrome coronavirus 2 (SARS-CoV-2) and mouse-adapted A/Hongkong/415742/2009 H1N1 (pH1N1) coinfection in hamsters. A, Representative hematoxylin and eosin images of lung tissues at 7 days postinfection (dpi) (upper panel) and 14 dpi (lower panel) after monoinfection or simultaneous coinfection. At 7dpi, SARS-CoV-2 infected lung showed proliferative changes (black arrows); pH1N1 infected lung only showed bronchiolar luminal cell debris (black arrows); while the lung of coinfection showed alveolar infiltration (while arrows) and bronchiolar secretion (black arrow). At 14dpi, only the coinfected lung showed bronchiolar luminal infiltration (white arrows) and foci of alveolar infiltration (black arrows). B, Serum neutralizing antibodies against SARS-CoV-2 (left) and pH1N1 (right) were determined by microneutralization test (MNT) on Vero E6 cells and Madin-Darby canine kidney cells, respectively.

Comment in

Similar articles

Cited by

References

    1. World Health Organization. Weekly epidemiological update—3 November 2020. Available at: https://www.who.int/docs/default-source/coronaviruse/situation-reports/w.... Accessed 11 June 2020.
    1. Chan JF-W, Yuan S, Kok K-H, et al. . A familial cluster of pneumonia associated with the 2019 novel coronavirus indicating person-to-person transmission: a study of a family cluster. Lancet 2020; 395:514–23. - PMC - PubMed
    1. Hung IF, Cheng VC, Li X, et al. . SARS-CoV-2 shedding and seroconversion among passengers quarantined after disembarking a cruise ship: a case series. Lancet Infect Dis 2020; 20:1051–60. - PMC - PubMed
    1. Cheng VC, Wong SC, Chuang VW, et al. . The role of community-wide wearing of face mask for control of coronavirus disease 2019 (COVID-19) epidemic due to SARS-CoV-2. J Infect 2020; 81:107–14. - PMC - PubMed
    1. Li X, Sridhar S, Chan JF-W. The coronavirus disease 2019 pandemic: how does it spread and how do we stop it? Curr Opin HIV AIDS 2020; 15:328–35. - PubMed