The effect of chronic nausea on gastric slow wave spatiotemporal dynamics in children
- PMID: 33217123
- PMCID: PMC8193999
- DOI: 10.1111/nmo.14035
The effect of chronic nausea on gastric slow wave spatiotemporal dynamics in children
Abstract
Background: Chronic nausea in adolescents with functional gastrointestinal disorders is an increasingly reported but poorly understood symptom that negatively affects quality of life. Functional gastrointestinal disorders are known to correlate closely with slow wave rhythm disturbances. The ability to characterize gastric electrophysiologic perturbations in functional nausea patients could provide potential diagnostic and therapeutic tools for nausea patients.
Methods: We used high-resolution electrogastrograms (HR-EGG) to measure gastric slow wave parameters in pediatric chronic nausea patients and healthy subjects both pre- and postprandial. We computed the dominant frequency, percentage power distribution, gastric slow wave propagation direction, and speed from HR-EGG.
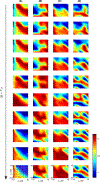
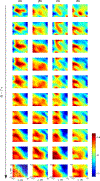
Key results: We observed significant differences in the dominant frequency and power distributed in normal and bradyarrhythmia frequency ranges when comparing patients and healthy subjects. Propagation patterns in healthy subjects were predominantly anterograde, while patients exhibited a variety of abnormalities including retrograde, anterograde, and disrupted patterns. There was a significant difference in the preprandial mean slow wave direction between healthy subjects (222° ± 22°) and patients (103° ± 66°; p ˂ 0.01), although the postprandial mean direction between healthy subjects and patients was similar (p = 0.73). No significant difference in slow wave propagation speed was found between patients and healthy subjects in either pre- (p = 0.21) or postprandial periods (p = 0.75).
Conclusions and inferences: The spatiotemporal characterization of gastric slow wave activity using HR-EGG distinguishes symptomatic chronic nausea patients from healthy subjects. This characterization may in turn inform and direct clinical decision-making and lead to further insight into its pathophysiology.
Keywords: chronic nausea; electrogastrogram; gastric slow wave; pediatrics.
© 2020 John Wiley & Sons Ltd.
Conflict of interest statement
DISCLOSURE
All authors have no conflicts of interest to disclose.
Figures


Comment in
-
Retrograde slow-wave activation: a missing link in gastric dysfunction?Neurogastroenterol Motil. 2021 Apr;33(4):e14112. doi: 10.1111/nmo.14112. Epub 2021 Feb 28. Neurogastroenterol Motil. 2021. PMID: 33644950 No abstract available.
-
Response to "retrograde slow wave activation: A missing link in gastric dysfunction?".Neurogastroenterol Motil. 2021 Apr;33(4):e14124. doi: 10.1111/nmo.14124. Epub 2021 Mar 8. Neurogastroenterol Motil. 2021. PMID: 33682988 Free PMC article. No abstract available.
References
-
- Lin XM, Chen JDZ. Abnormal gastric slow waves in patients with functional dyspepsia assessed by multichannel electrogastrography. Am J Physiol-Gastrointest Liver Physiol. 2001;280:G1370–G1375. - PubMed
-
- Lin ZY, McCallum RW, Schirmer BD, Chen JDZ. Effects of pacing parameters on entrainment of gastric slow waves in patients with gastroparesis. Am J Physiol-Gastrointest Liver Physiol. 1998;274:G186–G191. - PubMed
Publication types
MeSH terms
Grants and funding
LinkOut - more resources
Full Text Sources
Medical

